We simply attempt to be fearful when others are greedy and to be greedy only when others are fearful – Warren Buffet.
Greed and fear, two opposing emotional conditions, are principal drivers that have a profound impact on trading and investing. It is well documented greed inflates market prices during a boom and fear depresses action through busts.
Officially known as the CBOE volatility index, and recognised as Wall Street’s ‘fear gauge’, the ‘VIX’ index is considered by many as a representation of anxiety in the stock market. Frequently mentioned in various publications, the index has evolved into a benchmark for stock market volatility.
What is the VIX?
The VIX is a forward-looking indicator, and represents an indication of the 30-day implied volatility as priced by the S&P 500 index option market.
The S&P 500 is considered by many as a benchmark for the performance of the US stock market. It is a stock market index tracking the stocks of 500 large-cap US companies, and is one of the most commonly followed equity indices.
Dr. Robert Whaley developed the CBOE market volatility index for the Chicago Board Options Exchange in 1993. Whaley’s paper: Derivatives on Market Volatility: Hedging Tools Long Overdue, which appeared in the Journal of Derivatives, laid the groundwork for the index.
Historically, the VIX has an inverse relationship to the performance of the S&P 500, often prompting questions from traders new to the VIX. Understanding why the VIX behaves inversely to the S&P 500 is important because the volatility index acts as a measure of market sentiment.
While you do not have to be an expert in options to understand the dynamics behind the VIX, knowing basic options terminology helps when the VIX enters the discussion:
- Call option: gives the holder the right, but not the obligation, to buy a defined amount of the underlying security at a certain price by a certain date: the expiration date.
- Put option: gives the holder the right, but not the obligation, to sell a defined amount of the underlying security at a certain price by a certain date.
- Strike price: is the price at which the holder of the option may buy or sell the underlying market.
- Expiration date: is the date at which the holder has no rights, and the option has no value.
- Implied volatility: is the calculated expectation of future volatility.
VIX calculation
The option price used in the formula is the mid-point of the bid/ask spread. The VIX is a real-time measure of the 30-day implied volatility as indicated by the pricing of S&P 500 index options, expressed as an annualised volatility measure.
Although stated as an annualised percentage, traders can determine shorter-term market movements. As an example, the 30-day expected market movement is found by dividing the VIX percentage value by the square root of 12 (12 months in a year). If the VIX stands at 15%, the 30-day expected volatility, in either direction, is 4.33% (15/3.46). Calculating the daily expected movement of the S&P 500 is found by dividing the VIX percentage value by the square root of 252 (the number of trading days in a year). A VIX reading of 15, therefore, equates to an expected daily volatility of 0.94% (15/15.87).
Using the VIX
Many traders and investors question the inverse correlation between the VIX and the S&P 500. The relationship may be broken down to the nature of purchasing options. In times of turmoil, stocks fall under pressure and a certain amount of fear enters the market. This results in a net buying of put options, essentially ‘protecting’ investors against further downside. Buying put options gives the holder the right, but not the obligation, to sell a defined amount of the underlying security, consequently pushing implied volatility higher for both puts and calls.
Dr. Robert Whaley:
When you see VIX go up, you can know there are a bunch of people out there that are buying insurance on the stock market because they’re anxious about something. When VIX goes down, it’s just recognition that people aren’t too worried. The average closing level is 19. If it’s 11 now, that means people aren’t particularly concerned. At the same time, its level was 9 a couple weeks ago, so there’s clearly more anxiety now than there was a few weeks ago, but relative to its entire history it’s just not that big a deal.
Since late 2015, the VIX has fluctuated between 10.70 and 35.00 around 95% of the time, though reached as high as 80.00 in 2008! Whether the VIX is considered high or low should be taken in the context of the current volatility. Traders also need to acknowledge volatility is mean reverting.
Like the put/call ratio and sentiment surveys, the VIX is considered a contrarian indicator. For contrarians, low readings on the VIX are bearish, while high readings are bullish. The spike-like behaviour with which the VIX exhibits during times of market stress often represents a timely signal for determining when selling has become overdone and the market is due to bounce, or even bottom for a longer-term move higher.
Figure 1.1 illustrates when the VIX crosses through 35.00, the S&P 500 stock index reverses and turns higher. Therefore, a high VIX reading within the context of historical volatility can identify possible buying opportunities in the US stock market.
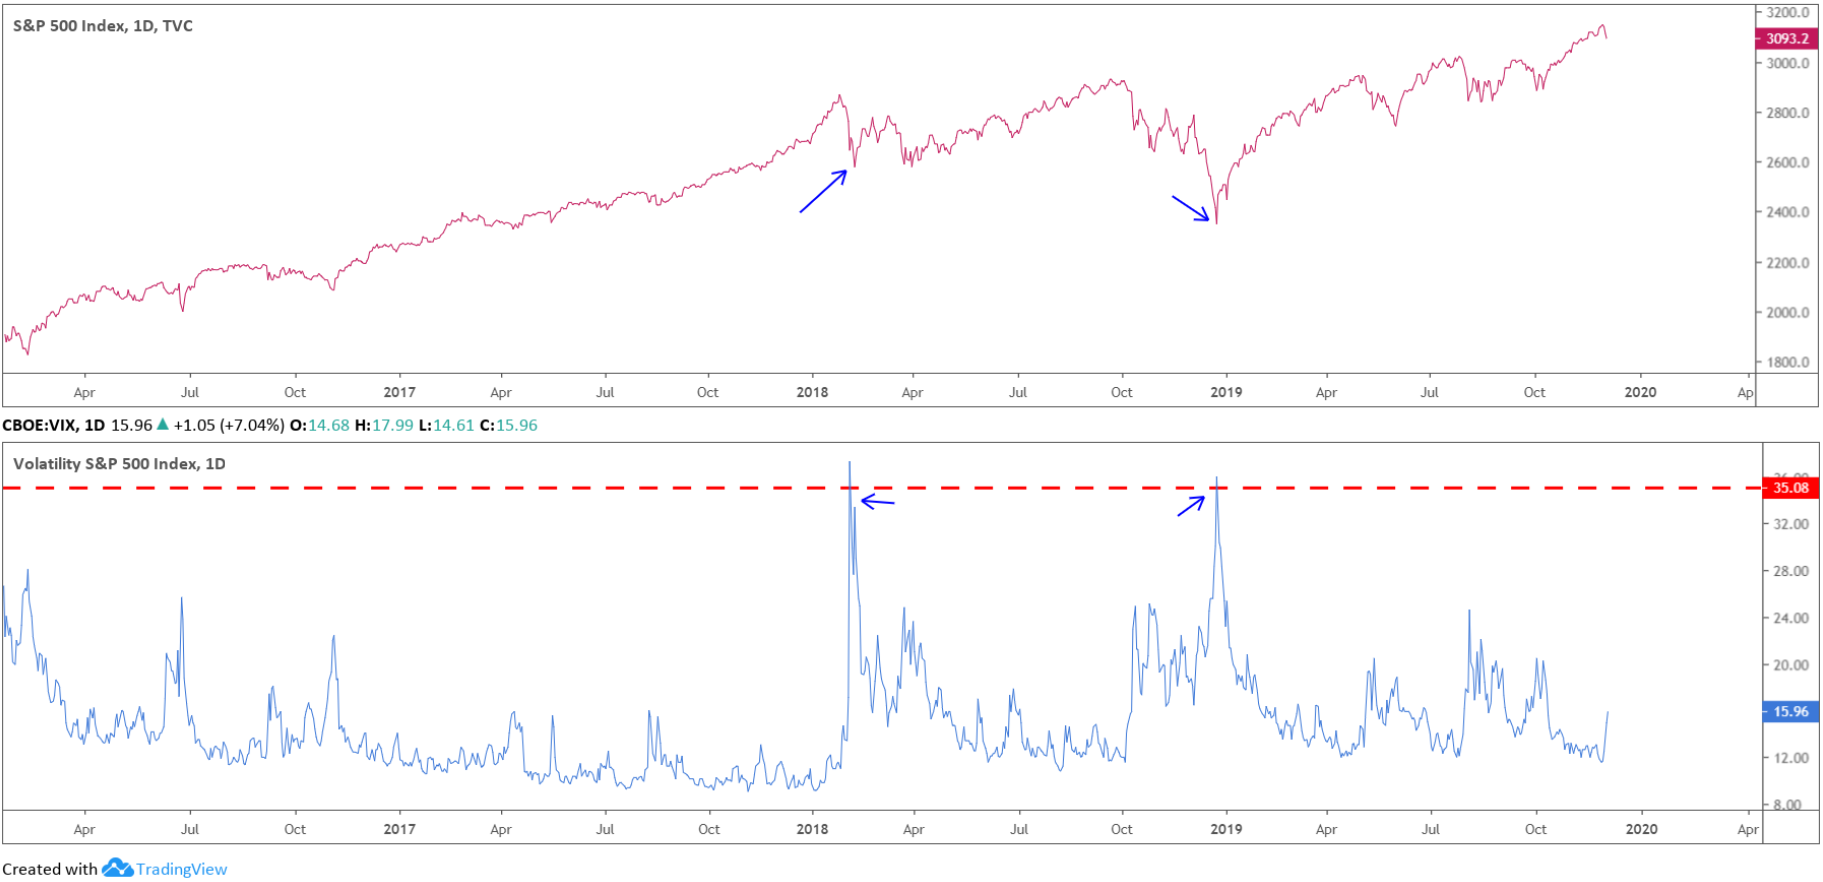
(Figure 1.1)
Other US equity market volatility indexes
CBOE Dow Jones Industrial Average Volatility Index:
- The index indicates the market’s expectation of the 30-day implied volatility based on the index option prices on the Dow Jones Industrial Average.
- The Dow consists of 30 stocks that represent a wide variety of industries, and some of the largest companies in the US.
CBOE Nasdaq-100 Volatility Index:
- The index displays 30-day implied volatility for the Nasdaq.
- Consists of the 100 largest companies not involved in the financial sector.
- Dominated by technology and communications-oriented stocks, which when combined make up 75 percent of the index.
CBOE Russel 2000 Volatility Index:
- The index prices in the 30-day implied volatility for the Russel 2000.
- Comprised of 2000 of the smallest companies in the Russel 3000 index.
- Although representing two-thirds of the companies in the Russel 3000, which consists of 3000 of the largest publicly traded companies in the US, the Russel 2000 only represents about 8% of the market cap of the Russel 3000.
- The index stands tall as a representation of the domestic economic trends in the US.
Notes:
https://www.brainyquote.com/quotes/warren_buffett_173493
https://business.vanderbilt.edu/bio/robert-whaley/
https://rewconsulting.files.wordpress.com/2012/09/jd93.pdf