In the right hands, oscillators offer an additional opinion on market conditions.
At its core, the stochastic oscillator is a momentum indicator in the field of technical analysis: a technical indicator. Momentum is the strength of a positive or negative change in market prices. It essentially measures the speed at which price action is rising/falling.
Many market practitioners credit George Lane (1921-2004) as the creator of the stochastic oscillator, though others apparently preceded Lane. According to research, Lane taught its use and popularised the indicator. The originator, however, goes by the name of Ralph Dystant (1902-1978) who introduced the indicator as part of an Elliot wave course.
George Lane’s description of the indicator:
Stochastics measures the momentum of price. If you visualise a rocket going up in the air – before it can turn down, it must slow down. Momentum always changes direction before price.
Stochastic calculation
While the majority of modern trading platforms perform the calculation automatically, it’s beneficial to understand the dynamics behind the scenes.
The stochastic oscillator commonly contains two lines: one reflecting the value of the oscillator for each session and another displaying its three-day simple moving average: %K and %D.
For the purpose of this article, the focus is on the fast and slow stochastic settings. The main difference between the two is sensitivity: the slow function is less sensitive than the fast calculation. It is also worth pointing out the full stochastic is essentially a mirror image of the slow stochastic until the smoothing average is altered.
The typical default setting for the stochastic is 14 periods, though traders are free to alter the time periods as they see fit. This can stretch to 5-minute periods, hourly periods, daily, weekly or even monthly periods. Many traders spend countless hours testing the results of signals using different periods in order to see which works best.
The calculation formula:
%K = (C – L) / (H – L) * 100.
Fast % D = 3-period SMA of %K.
Slow % D = 3-period SMA of %D.
Period: 14.
- H is the highest high for the period.
- L is the lowest low for the period.
- C is the most recent/current close.
As illustrated in the formula above, a 14-period %K is the raw number and uses the most recent close, along with the highest high and the lower low over the last 14 periods. %D is a 3-day simple moving average (SMA) of %K. This is the fast stochastic. The slow stochastic, nonetheless, smoothes the initial %D with another 3-period SMA. In other words, the slow stochastic is a derivative of the fast %D.
See figure 1.1 for a visual representation:
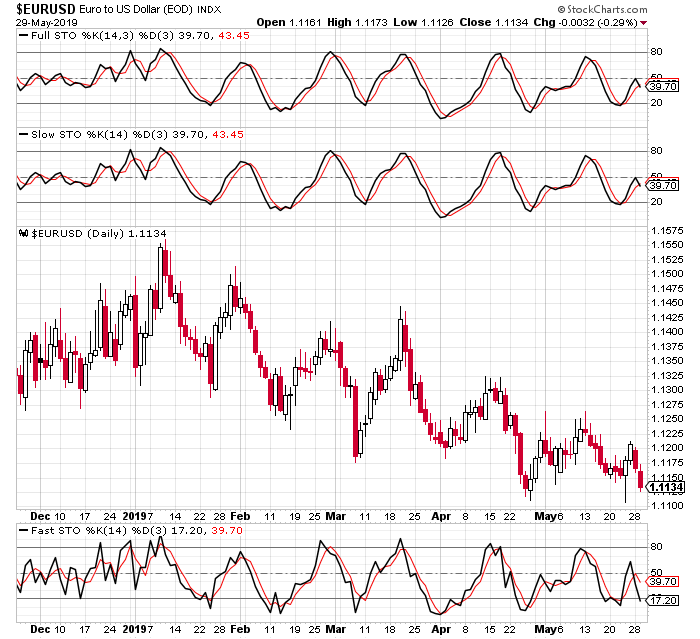 (Figure 1.1)
The many uses of the stochastic oscillator
Similar to the majority of oscillators, the stochastic provides a healthier view of the market in ranging environments. While this is true, the indicator also has its uses in trending markets as well.
Overbought/Oversold
Unlike indexes, oscillators are often restricted, with the stochastics bounded from 0-100. Above 80 signals an overbought market, while beneath 20 suggests oversold action.
Figure 1.2 demonstrates a market typically changes direction (sometimes with a lag) at the point the oscillator exits overbought or oversold territory. Although not a requirement, many prefer both the %K and %D values to move above/below the overbought/oversold values before labelling a market as such.
Note at the beginning of 2019, the EUR/USD put in a top around the 1.1550 mark, which converged with an overbought signal. Since then the market has been entrenched within a downtrend, with current price standing at 1.1134. Throughout the trend, two opportunities to trade countertrend took form that aligned with oversold conditions, one in February and another in April.
Throughout a sustained trend, traders may also want to acknowledge oversold and overbought signals can remain within their extremes for a prolonged period. For that reason, always attempt to take signals formed within these extreme regions in line with the predominant trend.
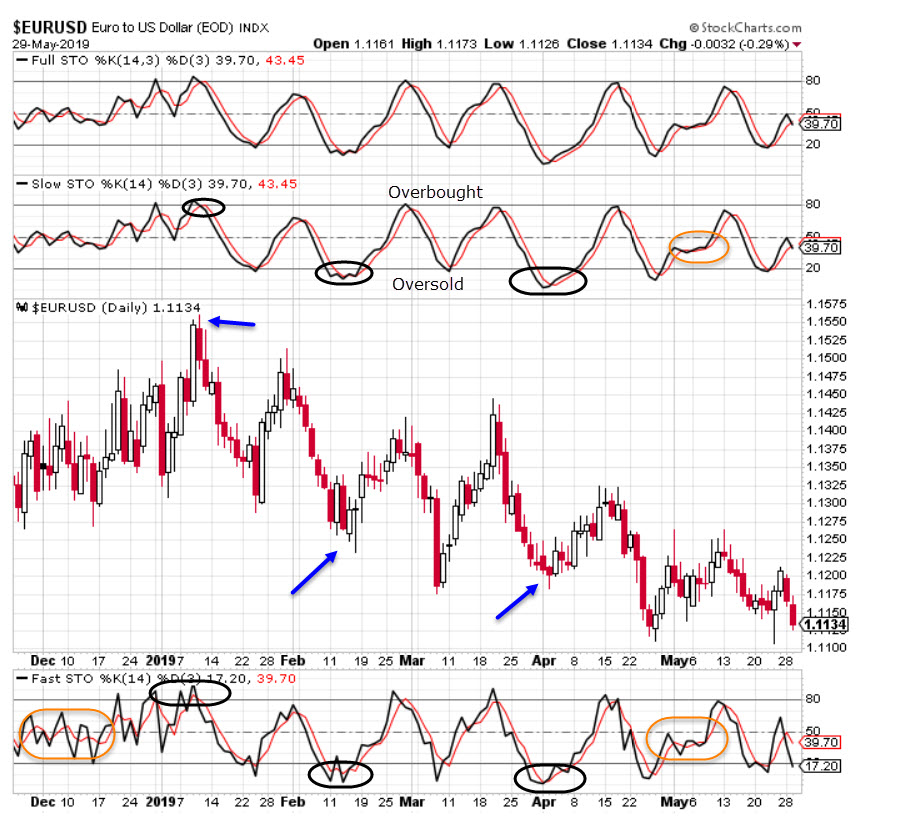 (Figure 1.2)
Crossovers at overbought/oversold levels
The stochastic indicator consists of two lines: the indicator itself (%K) and a signal line (%D), representing a 3-period simple moving average of %K (the fast stochastic that is).
A %K move through the signal line demonstrates the current closing price is nearing the lowest low of the period selected, therefore considered a bearish signal, while the opposite (a %K crossover of %D to the upside) suggests a bullish tone.
Using the same chart depicted in figure 1.2, note the %K and %D values crossover on numerous occasions. Despite the number of signals, some are stronger than others. One way of filtering the stronger crossover is to look for a crossover to form at extreme points: overbought and oversold regions.
Divergences
Divergence arises when underlying price movement prints a fresh high/low that is not confirmed by the stochastics. Figure 1.3 shows this as regular divergence. Hidden divergence (shown to the right of figure 1.3), sometimes referred to as reversals, has price action lead the way rather than the oscillator in regular divergence.
(Figure 1.3 – Blue signifies price action and red represents stochastic movement):
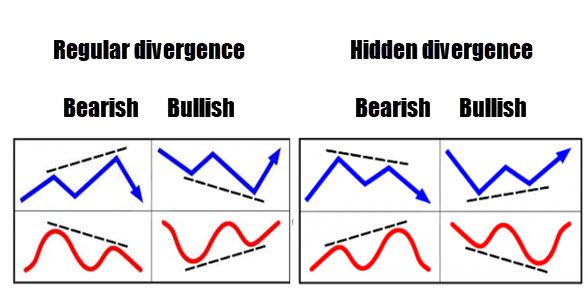
Divergence signals can offer an effective edge on the price chart, enabling traders to spot a potentially weakening/strengthening market. Divergences are also visible across all timeframes. For the best results, however, divergence observed on higher timeframes tends to suggest higher-probability signals.
Figure 1.4 illustrates a hidden divergence signal, visible on both the fast and slow stochastic windows:
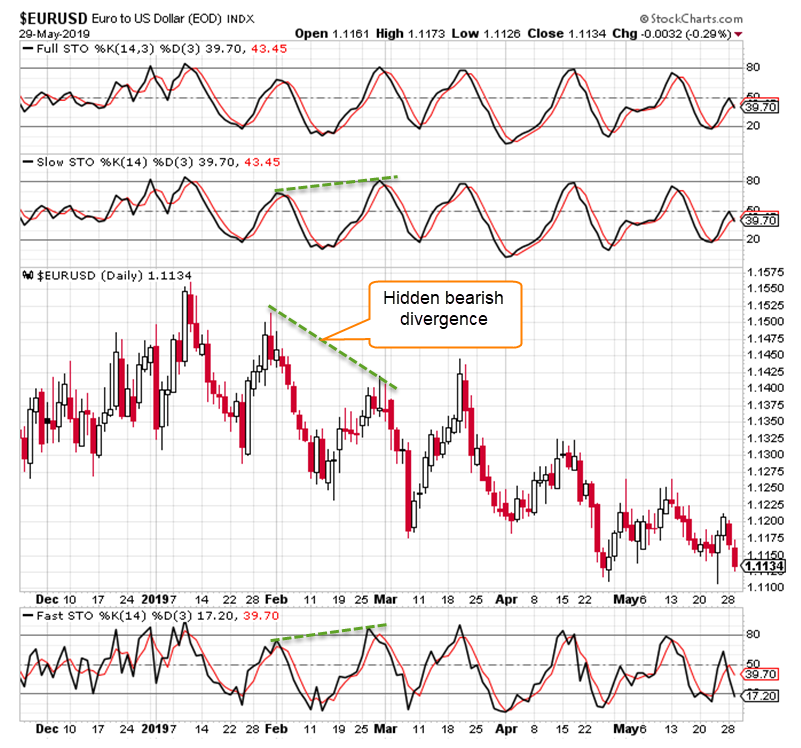 (Figure 1.4)
To trade or not to trade
While the stochastic oscillator certainly has its uses, momentum oscillators base their calculations on price data and, therefore, do not essentially add any new information. Think of it more as a manipulation of price data.
Therefore, to use the stochastics as a standalone indicator or trading strategy is likely to produce substandard results. Many traders use the indicator for confirmation purposes. For example, a price action trader notes a financial instrument is shaking hands with strong support (a level which held price action higher in the past and thus may do again in the future). This level, confirmed by a stochastics crossover out of oversold territory, likely adds weight to the trade. The same goes for a positive divergence signal, too.
NOTES:
New Market Timing Techniques: Innovative Studies in Market Rhythm & Price Exhaustion 1st Edition; Thomas R. DeMark.
Futures and Options Magazine, March, 2007.
Charts provided by www.StockCharts.com.