
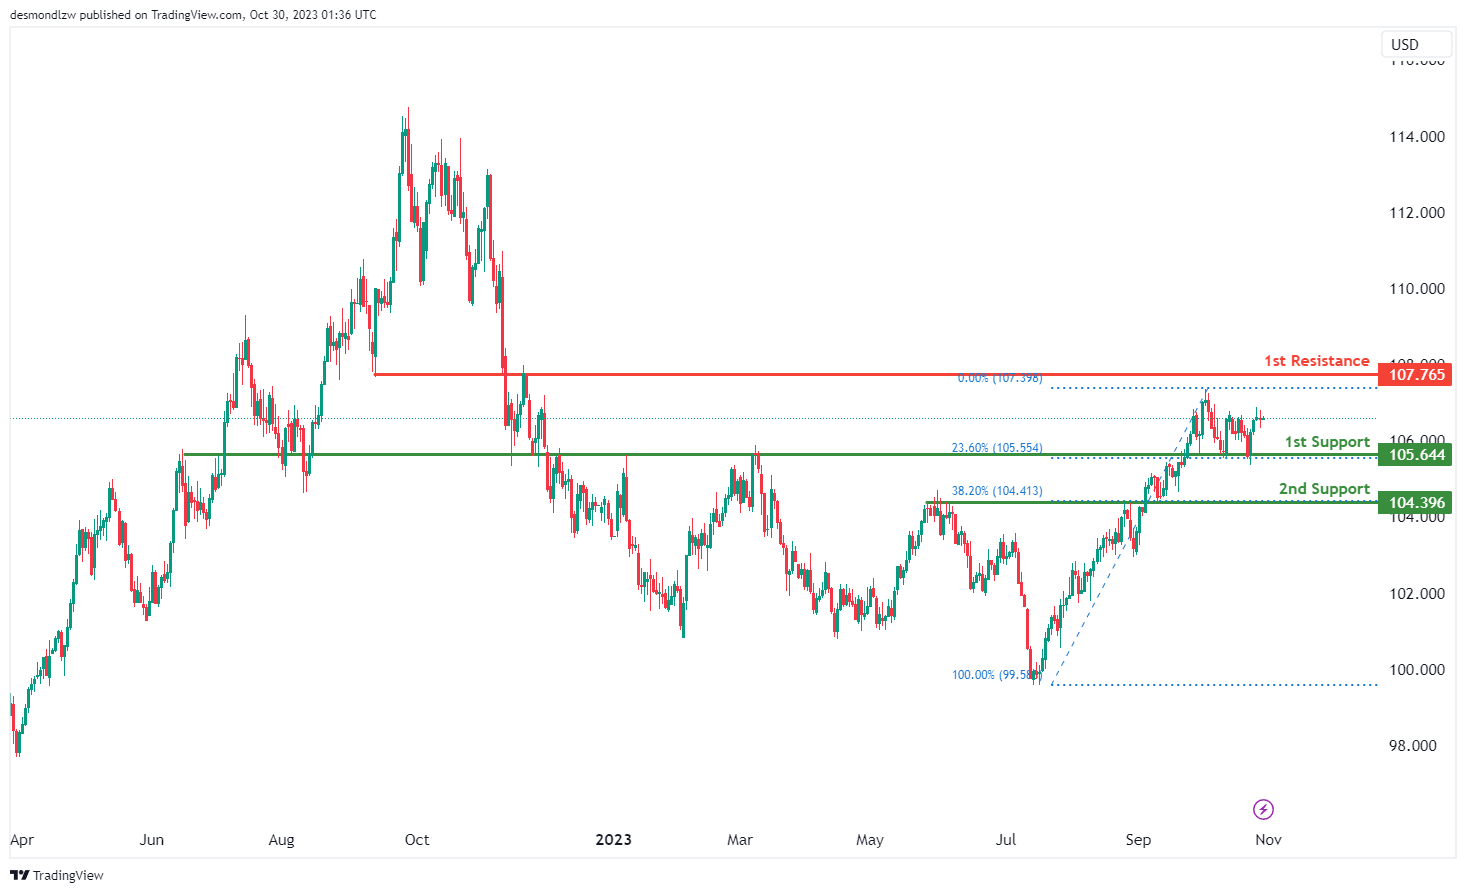
DXY:
The DXY chart currently exhibits bullish momentum, suggesting the potential for a bullish continuation towards the 1st resistance.
The 1st support at 105.64 is considered significant as it aligns with an overlap support and coincides with the 23.60% Fibonacci Retracement level, indicating its potential to serve as a strong area of price support. Additionally, the 2nd support at 104.39 is identified as another overlap support and corresponds to the 38.20% Fibonacci Retracement level, further reinforcing its potential as a support level.
On the resistance side, the 1st resistance at 107.76 is characterized as an overlap resistance, implying that it could pose a significant obstacle to any notable upward price movement. The overall bullish momentum suggests a potential continuation towards this resistance level.
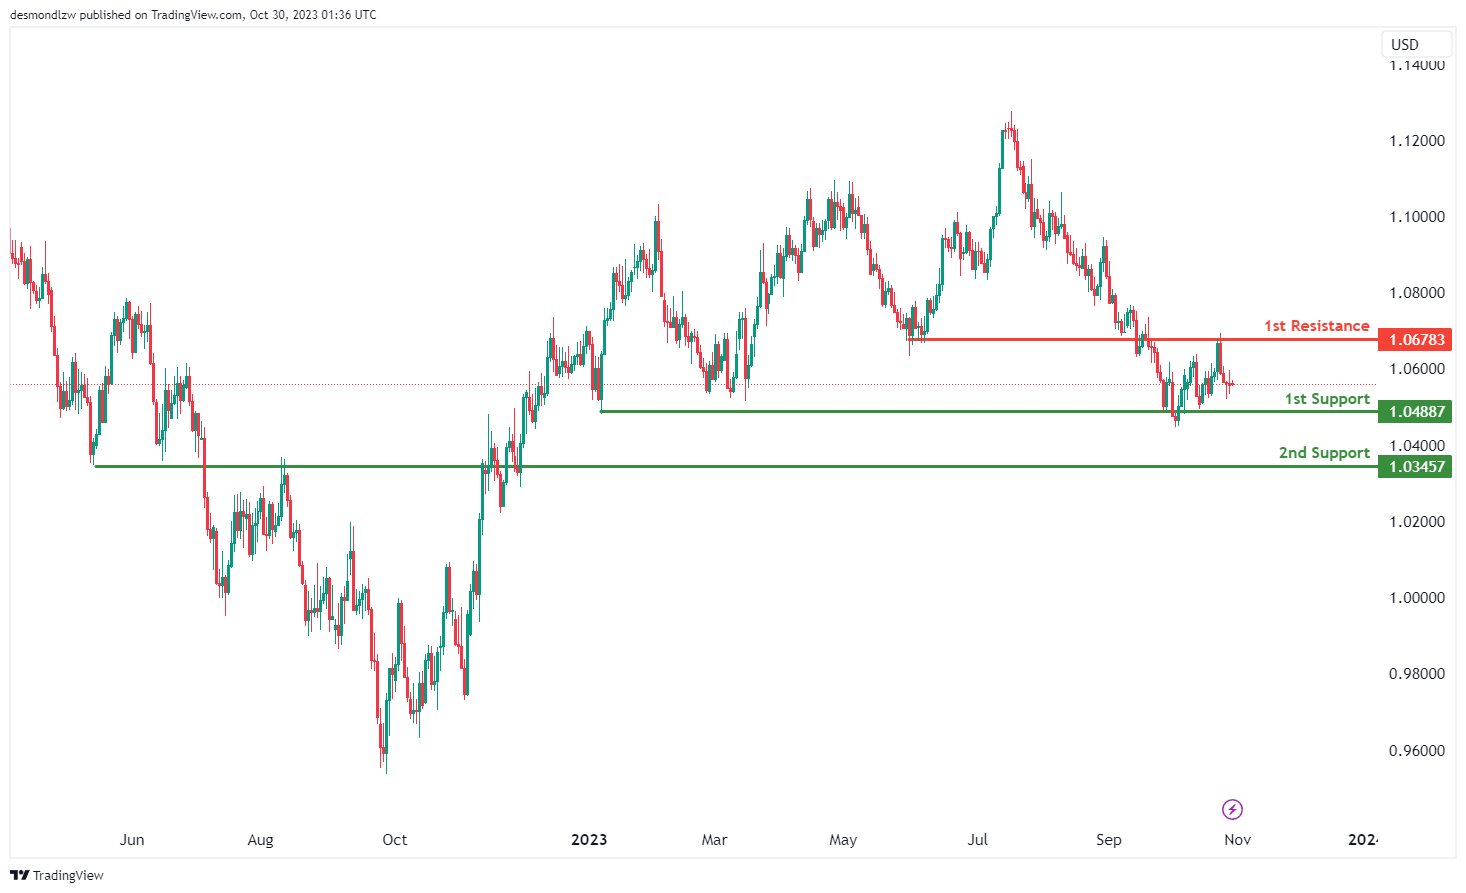
EUR/USD:
The EUR/USD chart currently demonstrates neutral momentum, indicating the potential scenario of price fluctuating between the 1st resistance and 1st support levels.
The 1st support at 1.0488 is considered significant as it aligns with an overlap support, suggesting a potential area of price support. Additionally, the 2nd support at 1.0345 is also identified as an overlap support, reinforcing its potential role as a support level.
On the resistance side, the 1st resistance at 1.0678 is characterized as an overlap resistance, indicating a potential barrier to further upward price movements. The overall neutral momentum suggests that the price may oscillate within this range for the time being.
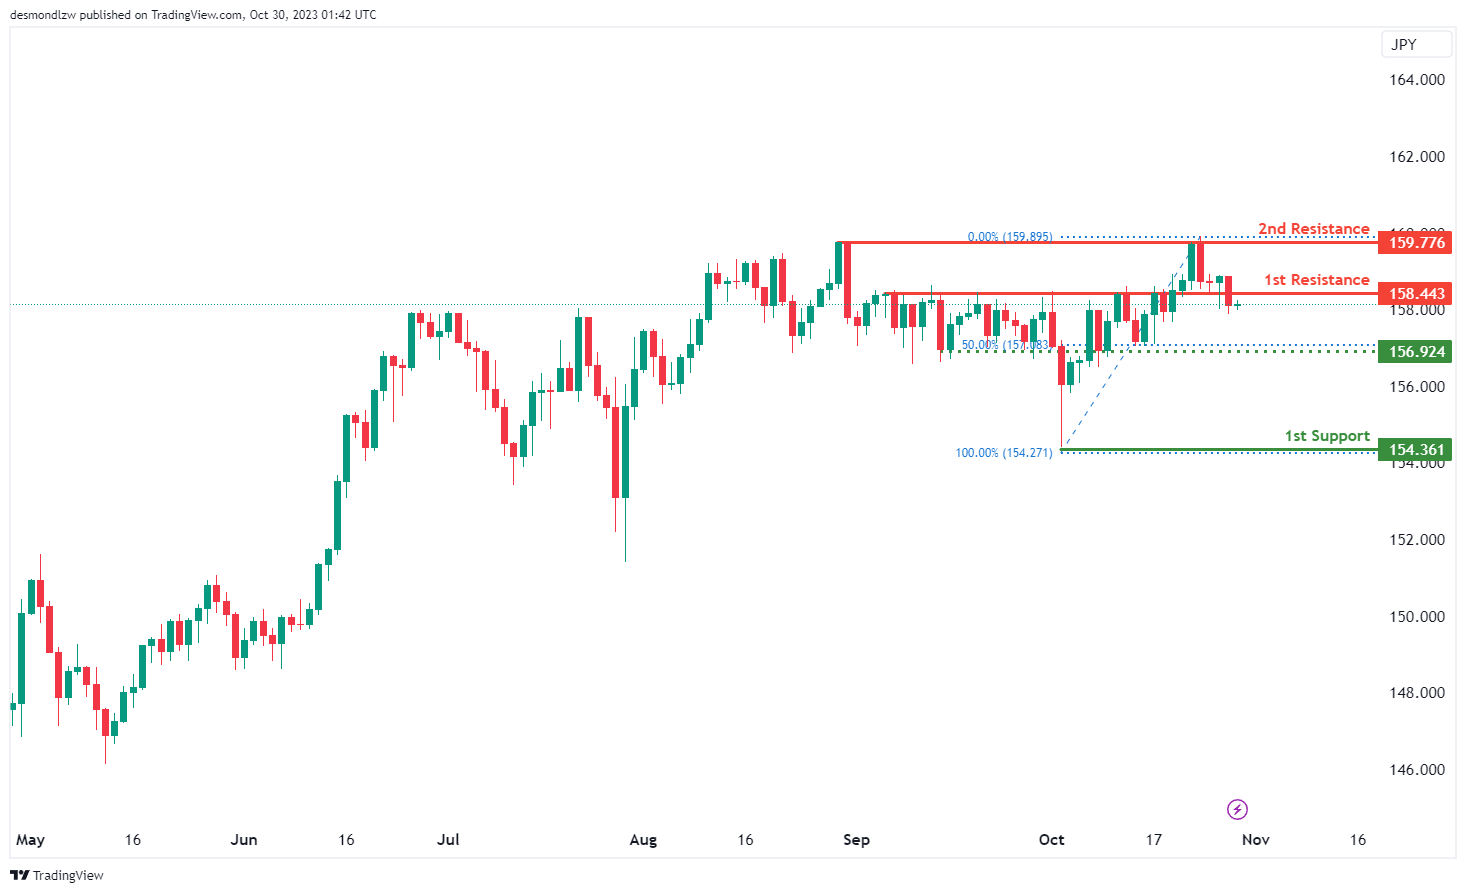
EUR/JPY:
The EUR/JPY chart currently exhibits bearish momentum, suggesting the potential for a bearish continuation towards the 1st support level.
The 1st support at 154.36 is considered significant as it aligns with a swing low support level, indicating a potential area of price support. Additionally, there is an intermediate support at 156.92, which coincides with an overlap support and the 50% Fibonacci Retracement level, further reinforcing its significance as a potential strong support level.
On the resistance side, the 1st resistance at 158.44 is identified as a pullback resistance level. Additionally, the 2nd resistance at 159.77 is characterized as a swing high resistance, indicating another potential level where the price may face resistance in its bearish trajectory.
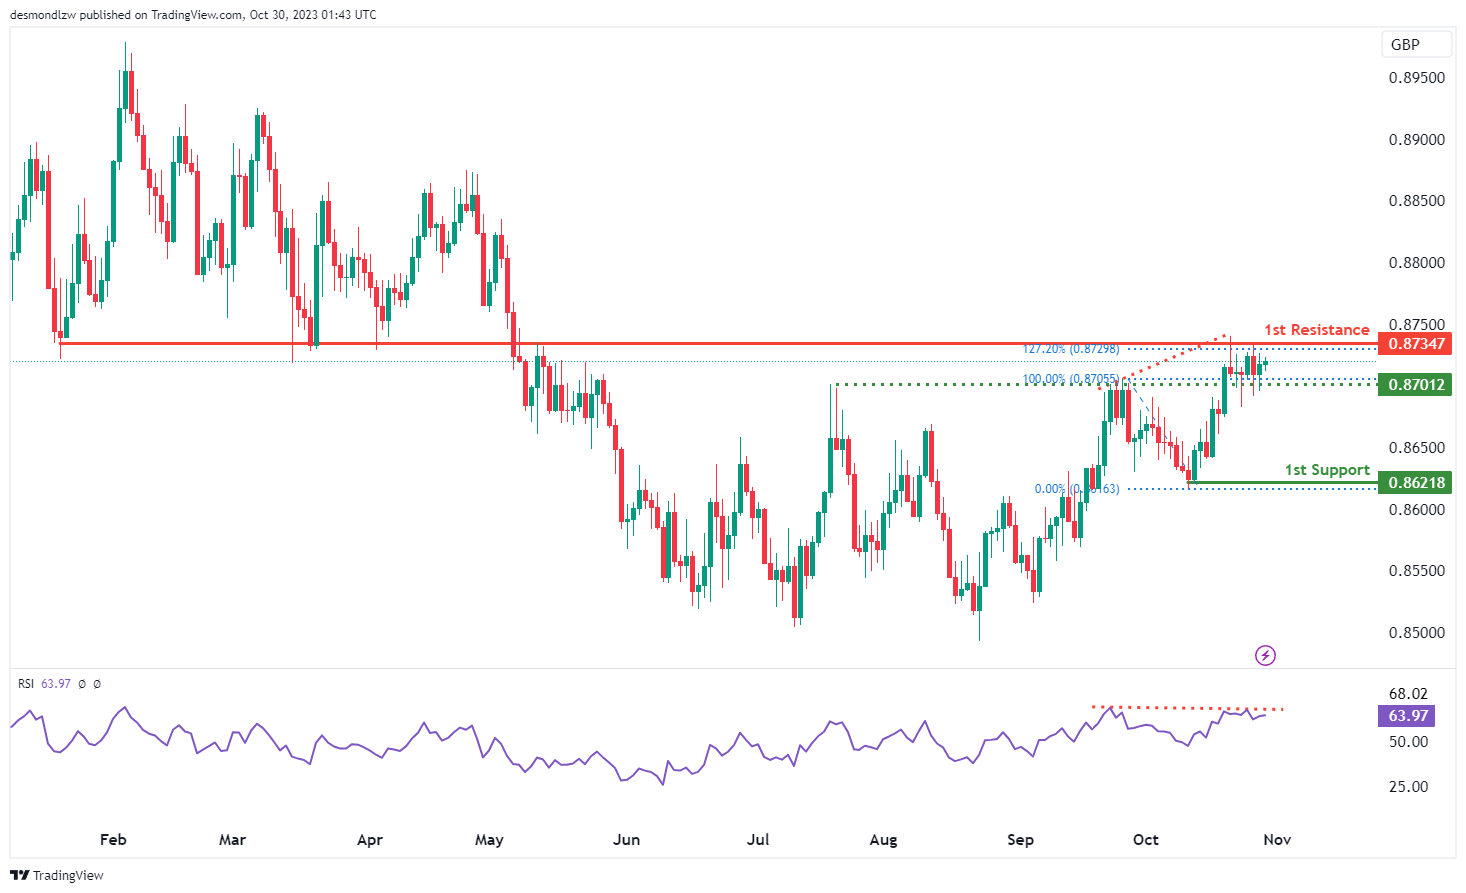
EUR/GBP:
The EUR/GBP chart currently demonstrates bearish overall momentum, indicating the potential for a bearish continuation towards the 1st support at 0.8622.
The 1st support is considered significant as it aligns with a swing low support, indicating its potential as a strong support level. Additionally, there is an intermediate support at 0.8701, identified as an overlap support, which adds another layer of potential price support.
On the resistance side, the 1st resistance at 0.8735 is characterized as an overlap resistance, reinforcing its potential as a barrier to upward price movements.
It’s worth noting that the Relative Strength Index (RSI) is also displaying bearish divergence versus price, suggesting the possibility of a reversal occurring soon. This divergence adds further weight to the potential for a bearish move.
.
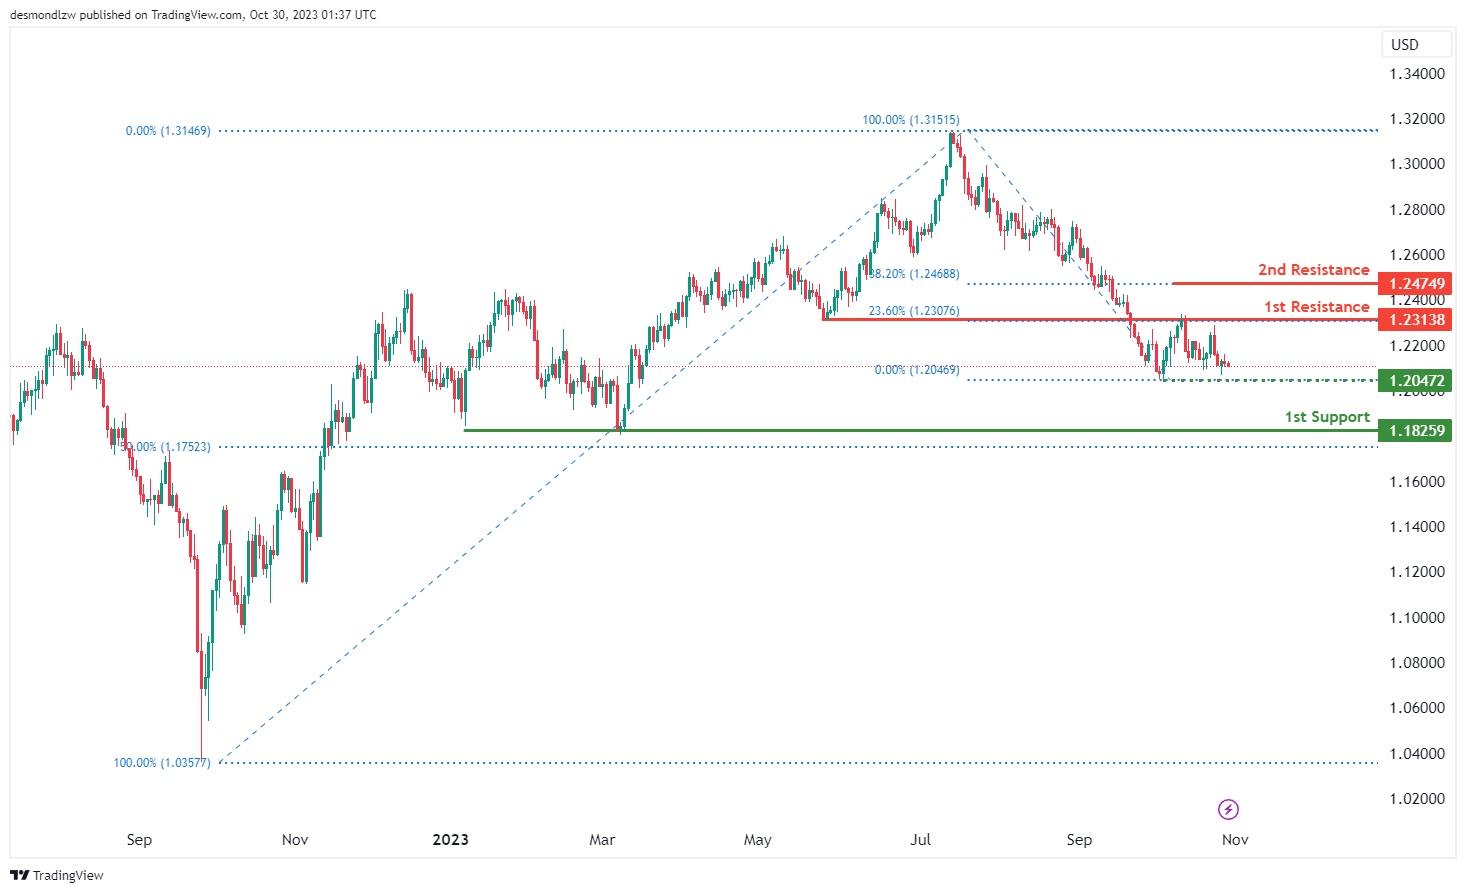
GBP/USD:
The GBP/USD chart currently demonstrates a bearish momentum, suggesting the potential for a bearish continuation towards the 1st support level at 1.1825.
The 1st support at 1.1825 is considered significant as it aligns with a swing low support level and coincides with the 50% Fibonacci Retracement, making it a strong potential support zone. Additionally, there is an intermediate support at 1.2047, which is associated with a swing low support, providing further potential support for the price.
On the resistance side, the 1st resistance at 1.2313 is characterized as an overlap resistance and aligns with the 23.60% Fibonacci Retracement, indicating a potential barrier to further upward price movements. Furthermore, the 2nd resistance at 1.2474 is noted as a level with 38.20% Fibonacci Retracement, adding to its significance as a potential area where the price may face resistance.
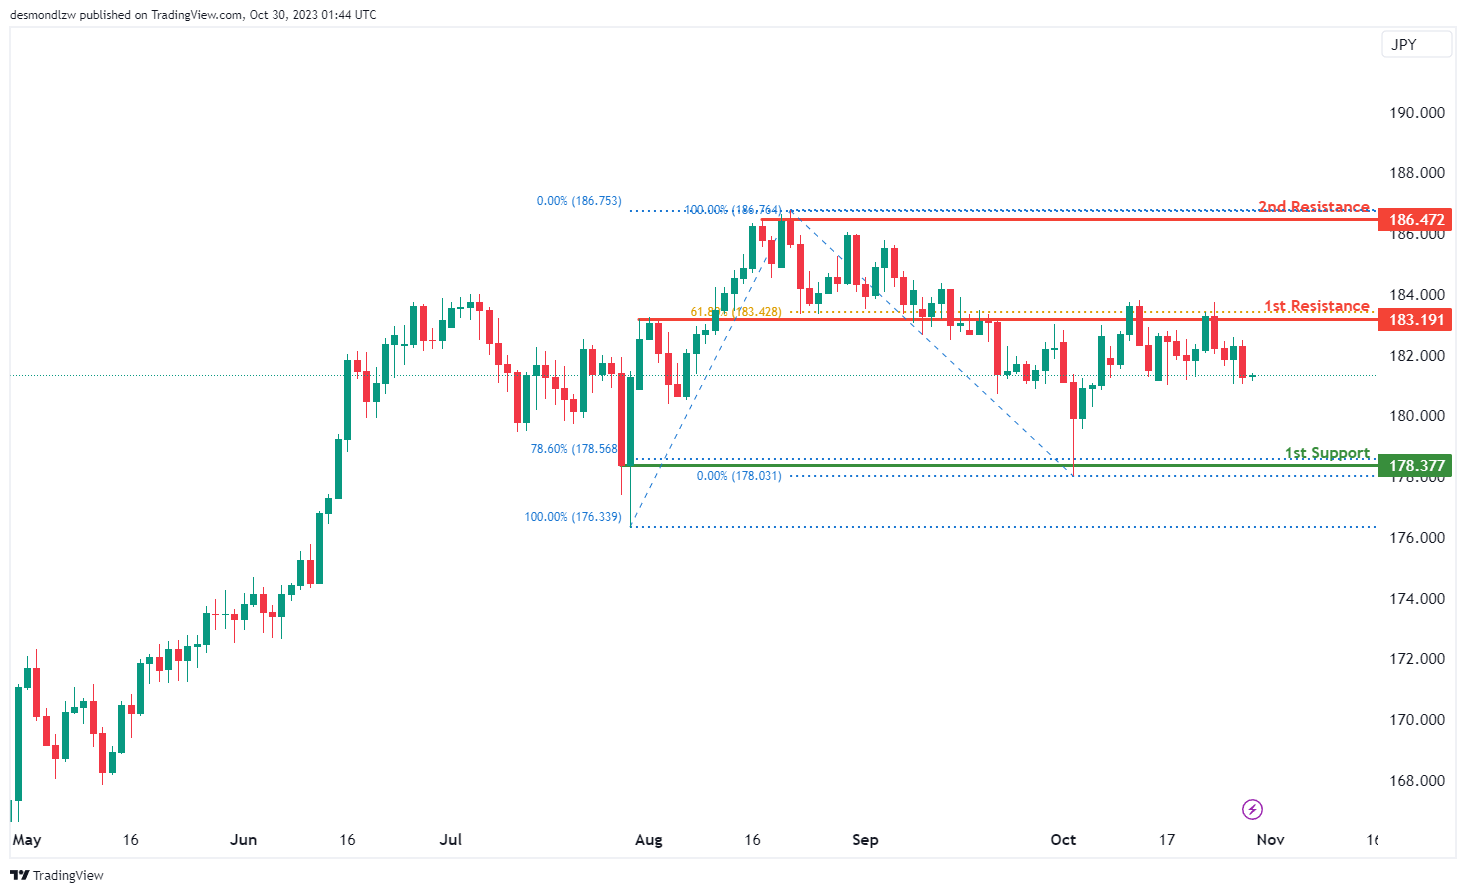
GBP/JPY:
The GBP/JPY chart currently exhibits bearish overall momentum, indicating the potential for a bearish continuation towards the 1st support at 178.37.
The 1st support is considered significant as it aligns with a multi-swing low support and coincides with the 78.60% Fibonacci Retracement level, making it a strong potential support zone.
On the resistance side, the 1st resistance at 183.19 is characterized as an overlap resistance and is associated with the 61.80% Fibonacci Retracement level, making it a potential barrier to further upward price movement. The 2nd resistance at 186.47 is identified as a multi-swing high resistance, further reinforcing its potential as a resistance level.
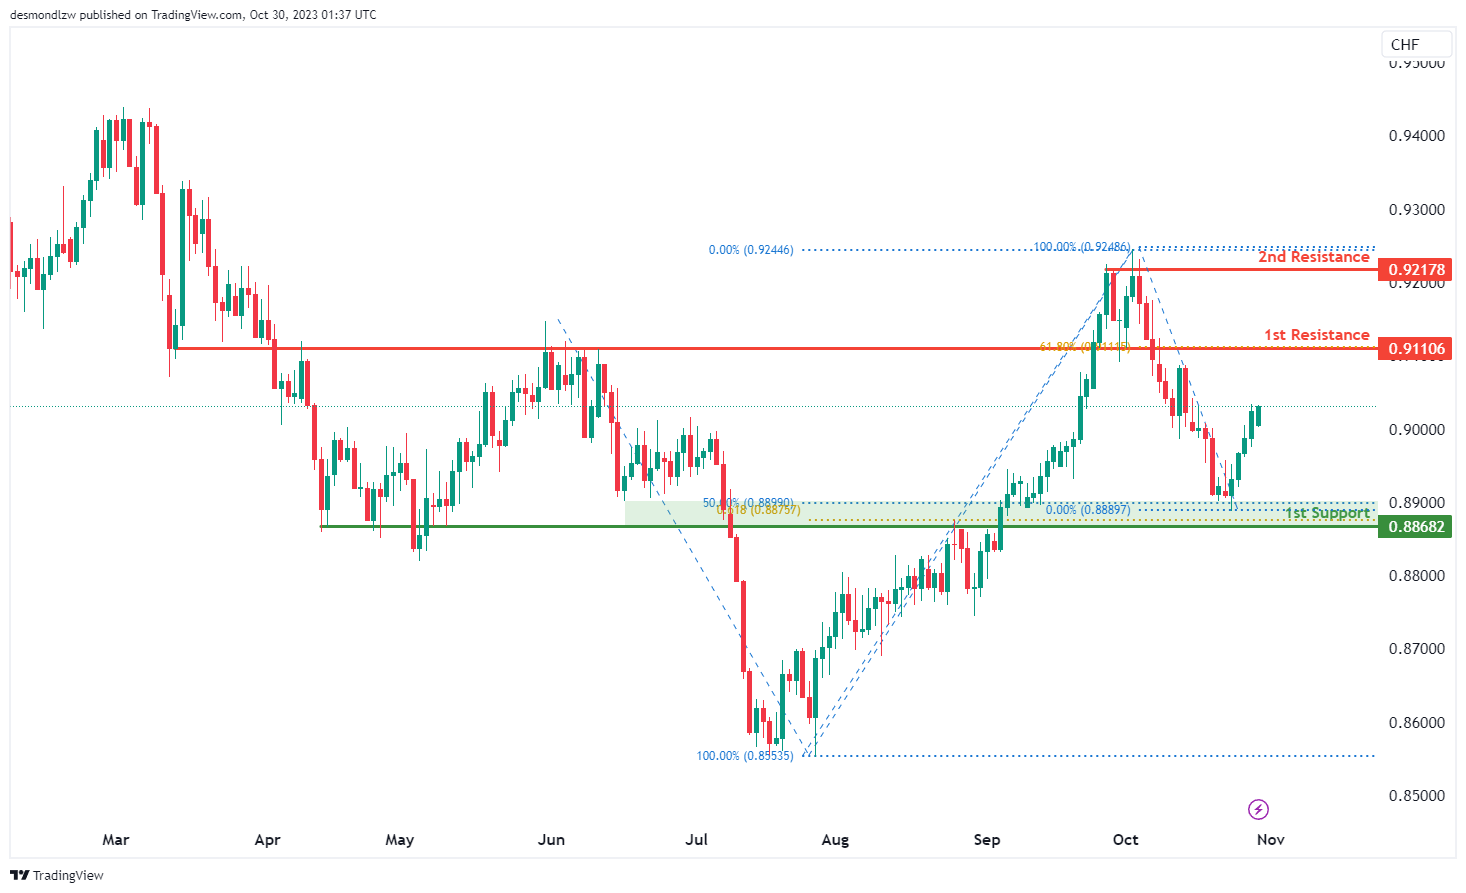
USD/CHF:
The USD/CHF chart currently exhibits a bullish overall momentum, indicating the potential for a bullish continuation towards the 1st resistance level.
The 1st support at 0.8868 is considered significant as it aligns with an overlap support level, and it also coincides with the 50% Fibonacci Retracement and the 61.80% Fibonacci Projection, indicating Fibonacci confluence. This makes it a strong potential support zone.
On the resistance side, the 1st resistance at 0.9110 is characterized as a pullback resistance level, and it aligns with the 61.80% Fibonacci Retracement. Additionally, there is a 2nd resistance level at 0.9217, which is identified as a multi-swing high resistance, further reinforcing the potential for resistance in this area.
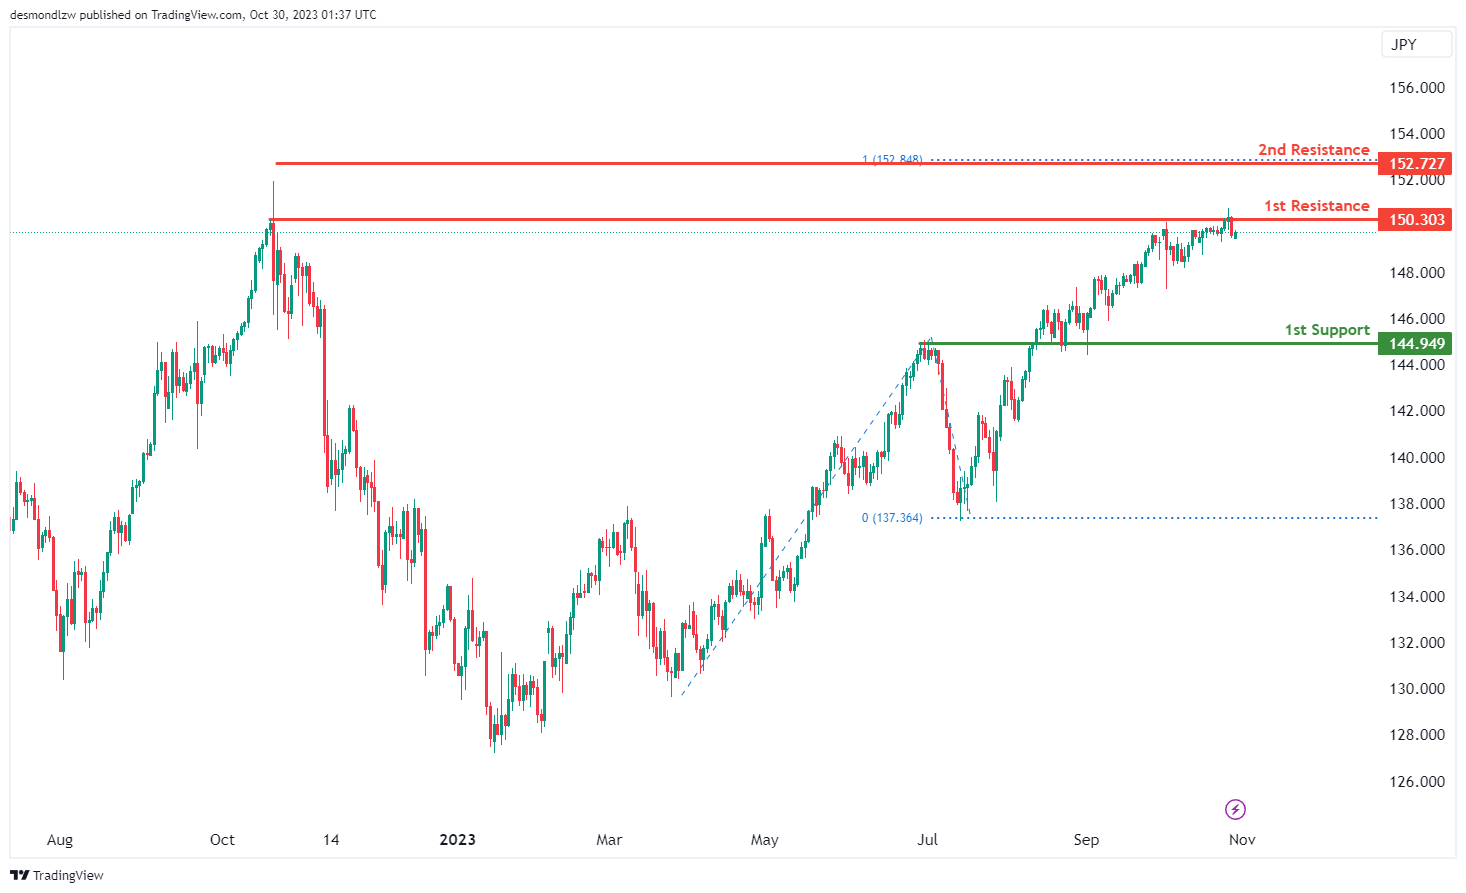
USD/JPY:
The USD/JPY chart currently has a bearish overall momentum, suggesting the potential for a bearish continuation towards the 1st support.
The 1st support at 144.94 is considered significant as it aligns with an overlap support level, indicating its potential to serve as a crucial price support zone.
On the resistance side, the 1st resistance at 150.30 is characterized as a multi-swing high resistance level, implying that it could pose as a significant obstacle to any notable upward price movement. Beyond this, the 2nd resistance at 152.72 is identified as a swing high resistance level, coinciding with the 100% Fibonacci Projection, further reinforcing the potential for resistance in this region.
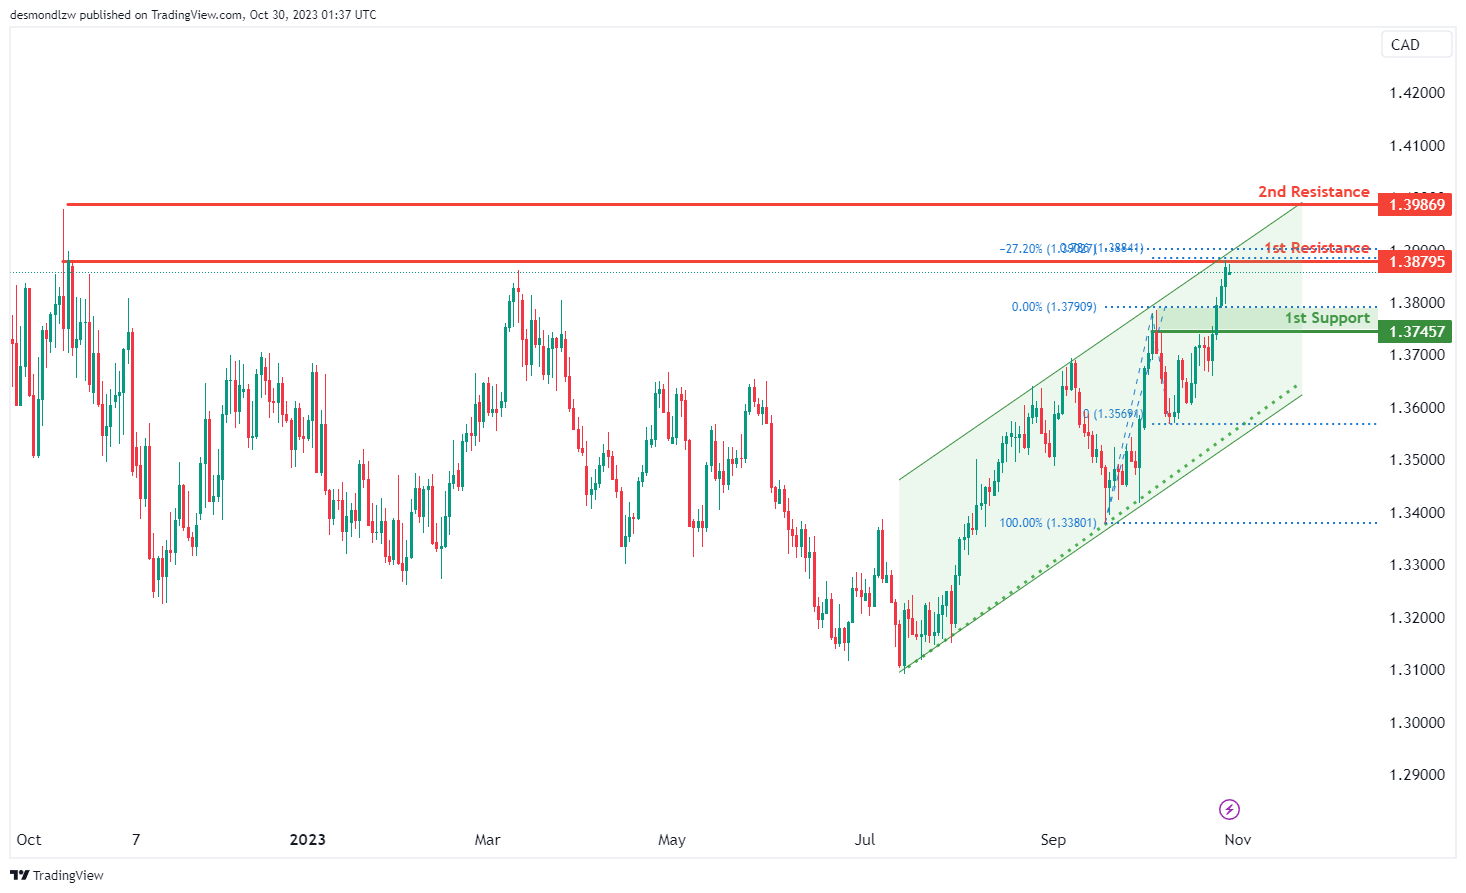
USD/CAD:
The USD/CAD chart currently demonstrates a bullish overall momentum, attributed to its position within a bullish ascending channel. However, there is a potential scenario for a short-term drop to the 1st support before bouncing and rising towards the 1st resistance.
The 1st support at 1.3745 is considered a good support level as it aligns with a pullback support, indicating a potential area of price support. In the short term, there may be a drop towards this level.
On the resistance side, the 1st resistance at 1.3879 is characterized as a multi-swing high resistance. It’s significant because it aligns with the -27% Fibonacci Expansion level, making it a strong potential resistance zone. Beyond that, there is a 2nd resistance at 1.3986, which is marked as a swing high resistance, further reinforcing the potential for resistance in that region.
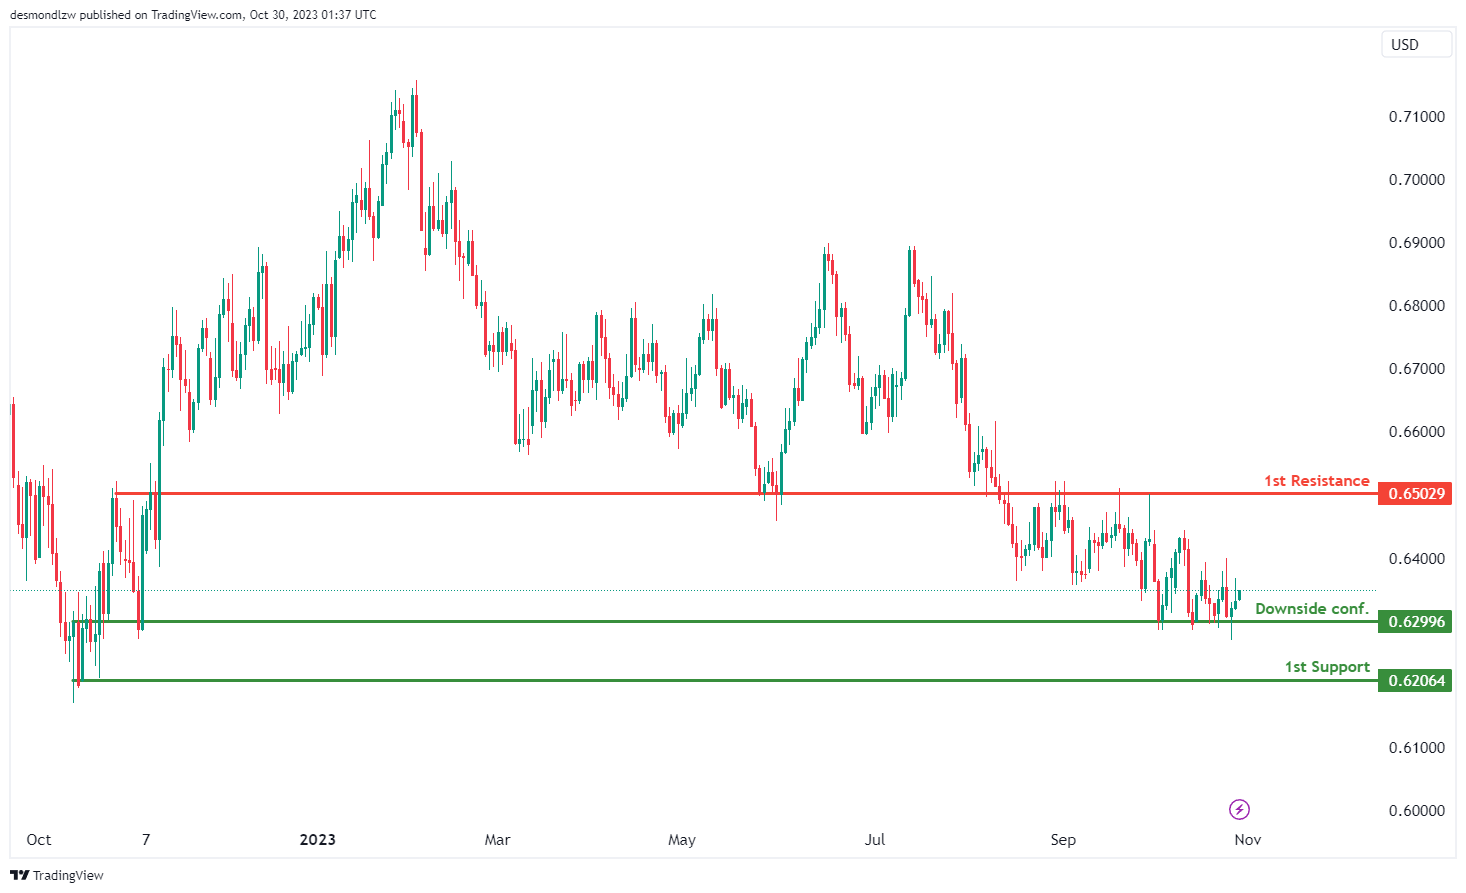
AUD/USD:
The AUD/USD chart currently exhibits a bullish overall momentum. There’s a potential scenario where the price could experience a bullish bounce off the 1st support at 0.6206 and head towards the 1st resistance at 0.6520.
The 1st support at 0.6206 is considered a swing low support, indicating its potential as a level of price support. Additionally, traders are waiting for downside confirmation at the level of 0.6299, which is identified as another swing low support, adding to its significance.
On the resistance side, the 1st resistance at 0.6520 is characterized as an overlap resistance. This analysis suggests the possibility of a bullish move in the AUD/USD chart, with the 1st support acting as a potential bounce point and the 1st resistance as a target for upward price movement.
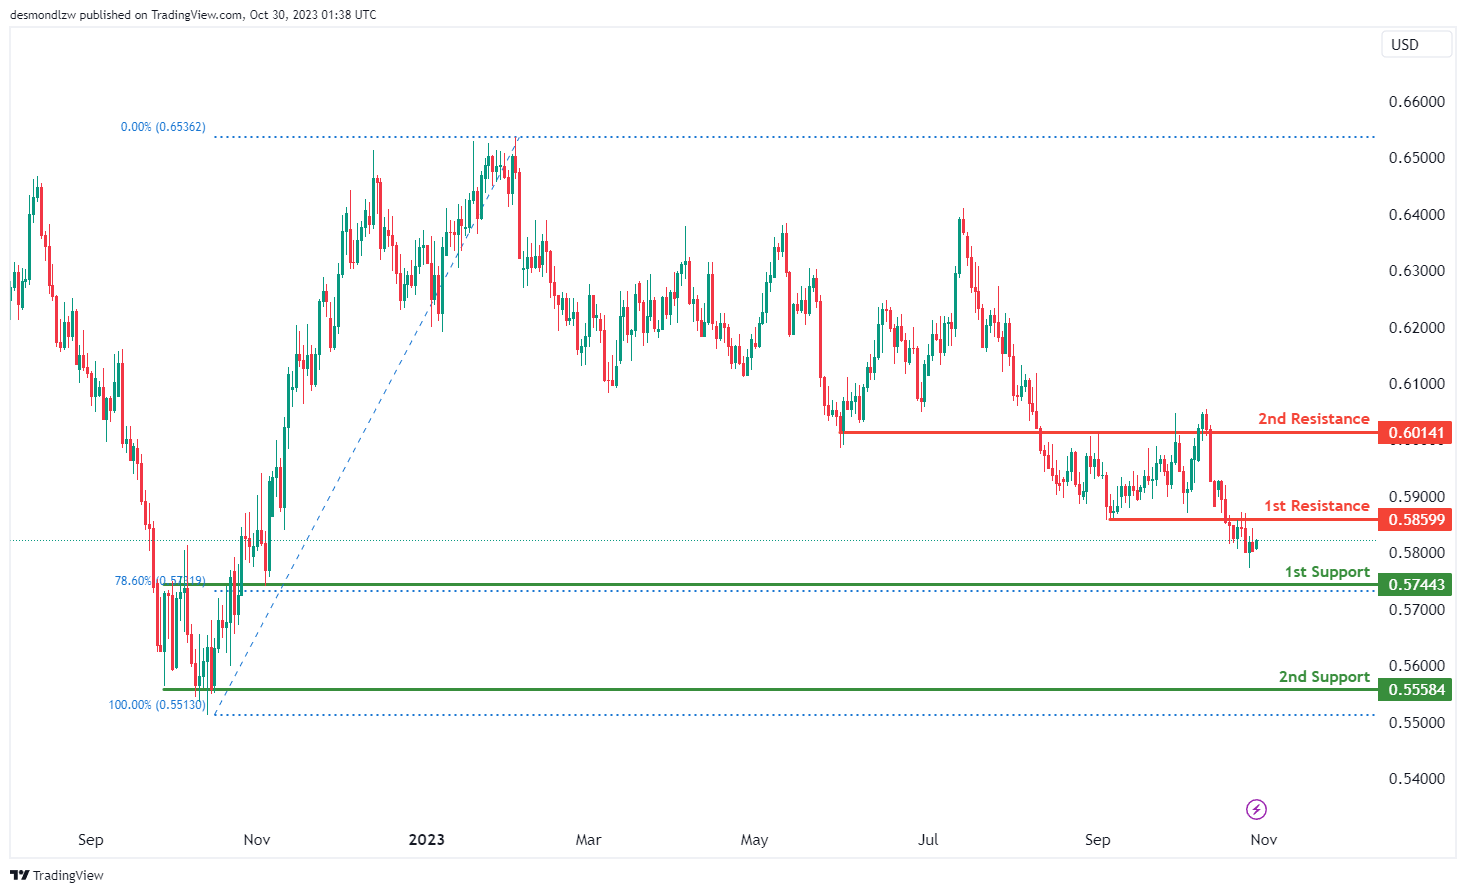
NZD/USD
The NZD/USD chart currently demonstrates a bearish overall momentum, suggesting the potential for a bearish continuation towards the 1st support level.
The 1st support at 0.5744 is considered significant as it aligns with an overlap support and coincides with the 78.60% Fibonacci Retracement level, providing a strong potential support zone. Additionally, there is a 2nd support level at 0.5558, identified as a multi-swing low support, which further reinforces the potential for bearish movement.
On the resistance side, the 1st resistance at 0.5859 is characterized as an overlap resistance, and beyond this, the 2nd resistance at 0.6014 is also noted as an overlap resistance. These levels may act as barriers to upward price movements in the bearish scenario.
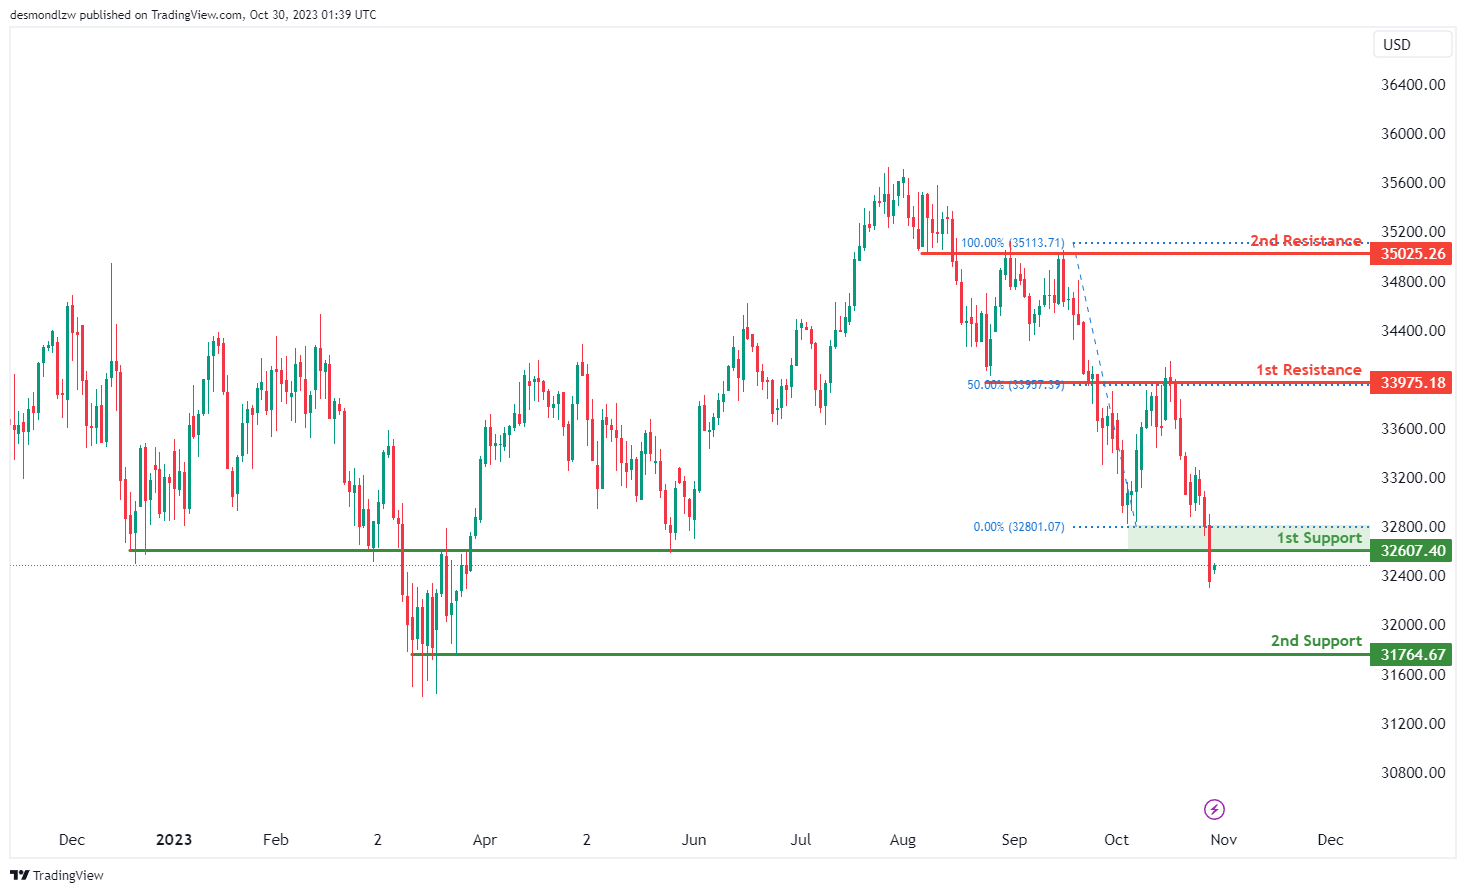
DJ30:
The DJ30 (Dow Jones Industrial Average) chart currently demonstrates a bearish overall momentum, suggesting the potential for a bearish break off the 1st support level and a drop towards the 2nd support.
The 1st support at 32607.40 is considered significant as it aligns with a pullback support, indicating a potential area of price support. However, there is also a 2nd support level at 31764.67, which is identified as a multi-swing low support, further reinforcing the potential for it to act as a support zone.
On the resistance side, the 1st resistance at 33975.18 is characterized as an overlap resistance and is notable because it aligns with the 50% Fibonacci Retracement level, suggesting a potential strong resistance zone that could impede upward price movement. Additionally, there is a 2nd resistance at 35025.26, marked as an overlap resistance, indicating another potential level where the price may face resistance.
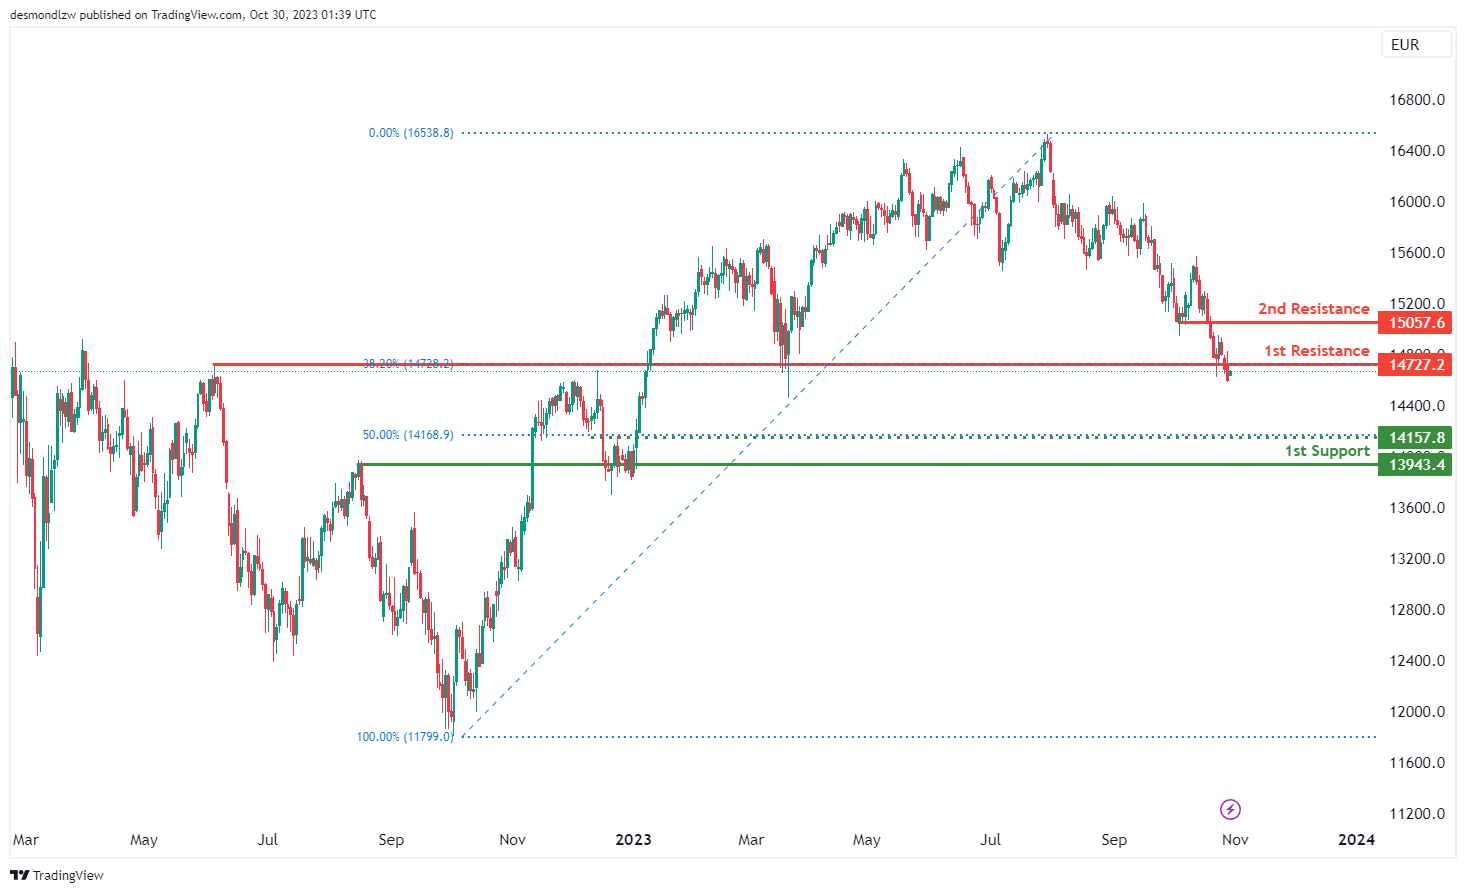
GER40:
The GER40 chart currently exhibits a bearish overall momentum, suggesting the potential for a bearish continuation towards the 1st support level at 13943.40.
The 1st support at 13943.40 is considered significant as it aligns with an overlap support and coincides with the 50% Fibonacci Retracement level, indicating a potential strong support zone. Additionally, there is an intermediate support level at 14157.80, characterized as a pullback support, which further reinforces the potential for it to act as a support level.
On the resistance side, the 1st resistance at 14727.20 is identified as a pullback resistance and is notable because it aligns with the 38.20% Fibonacci Retracement level. This resistance level suggests a potential barrier to upward price movement. Furthermore, there is a 2nd resistance at 15057.60, marked as a pullback resistance, indicating another potential level where the price may face resistance.
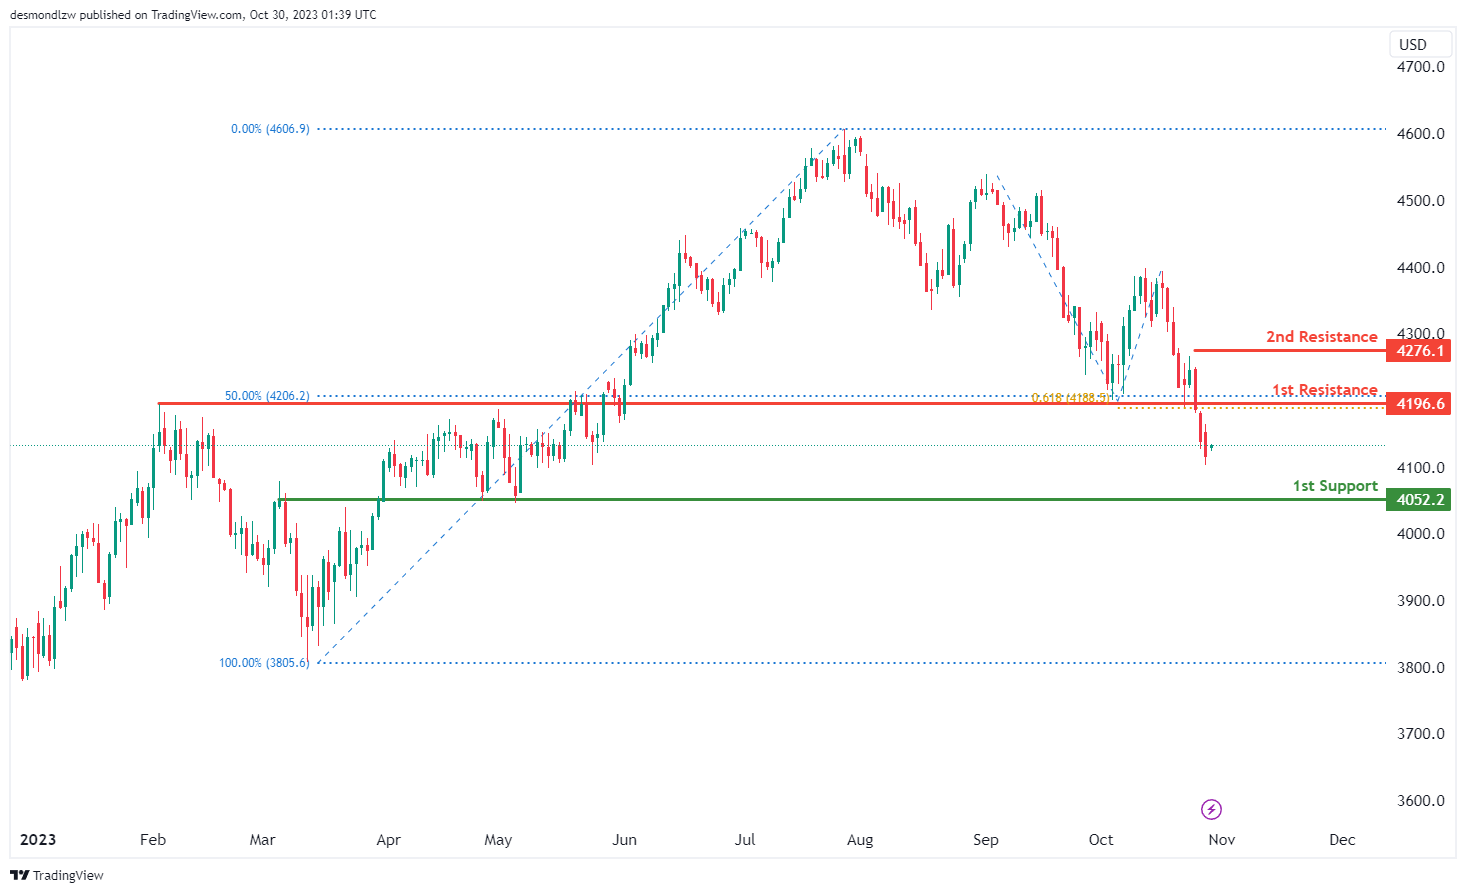
`US500
The US500 chart currently exhibits a bearish overall momentum. There’s a potential scenario for a bearish continuation towards the 1st support level at 4052.2.
The 1st support at 4052.2 is considered significant as it aligns with an overlap support, indicating its potential to act as a strong support level.
On the resistance side, the 1st resistance at 4196.6 is characterized as a pullback resistance. This resistance level is notable because it aligns with both the 50% Fibonacci Retracement and the 61.80% Fibonacci Projection, indicating a Fibonacci confluence, which makes it a strong potential barrier to upward price movement. Additionally, there is a 2nd resistance at 4276.1, identified as a swing high resistance, further reinforcing the potential for resistance in this region.
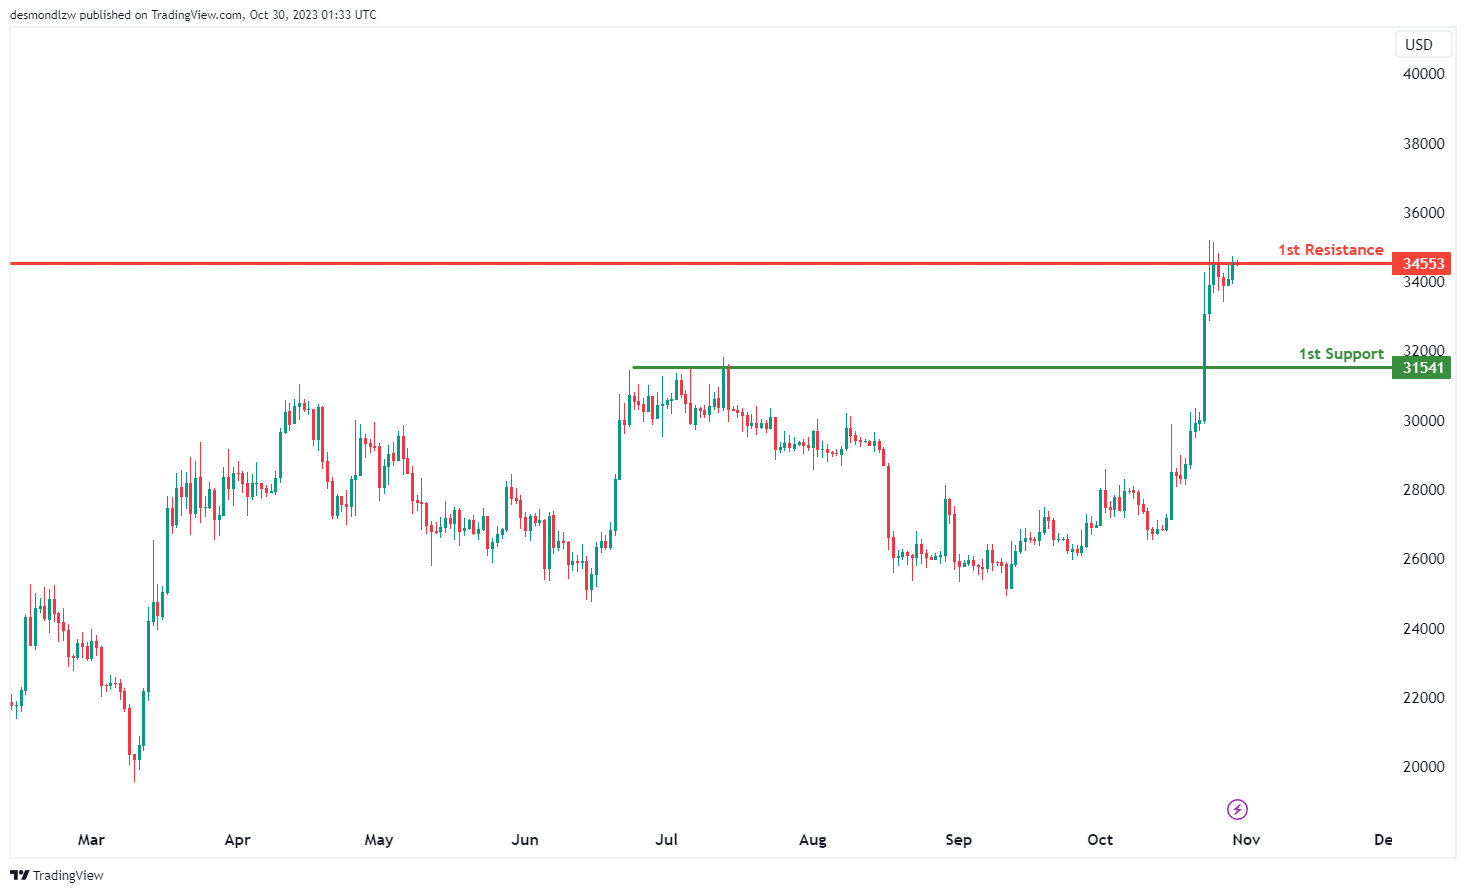
BTC/USD:
The BTC/USD chart currently has a bearish overall momentum, and there is a potential scenario for a bearish continuation towards the 1st support level at 31541.
The 1st support at 31541 is considered significant as it aligns with a pullback support level, indicating a potential area of price support.
On the resistance side, the 1st resistance at 34553 is characterized as an overlap resistance level, which could pose as a barrier to further upward price movements in the bearish direction.
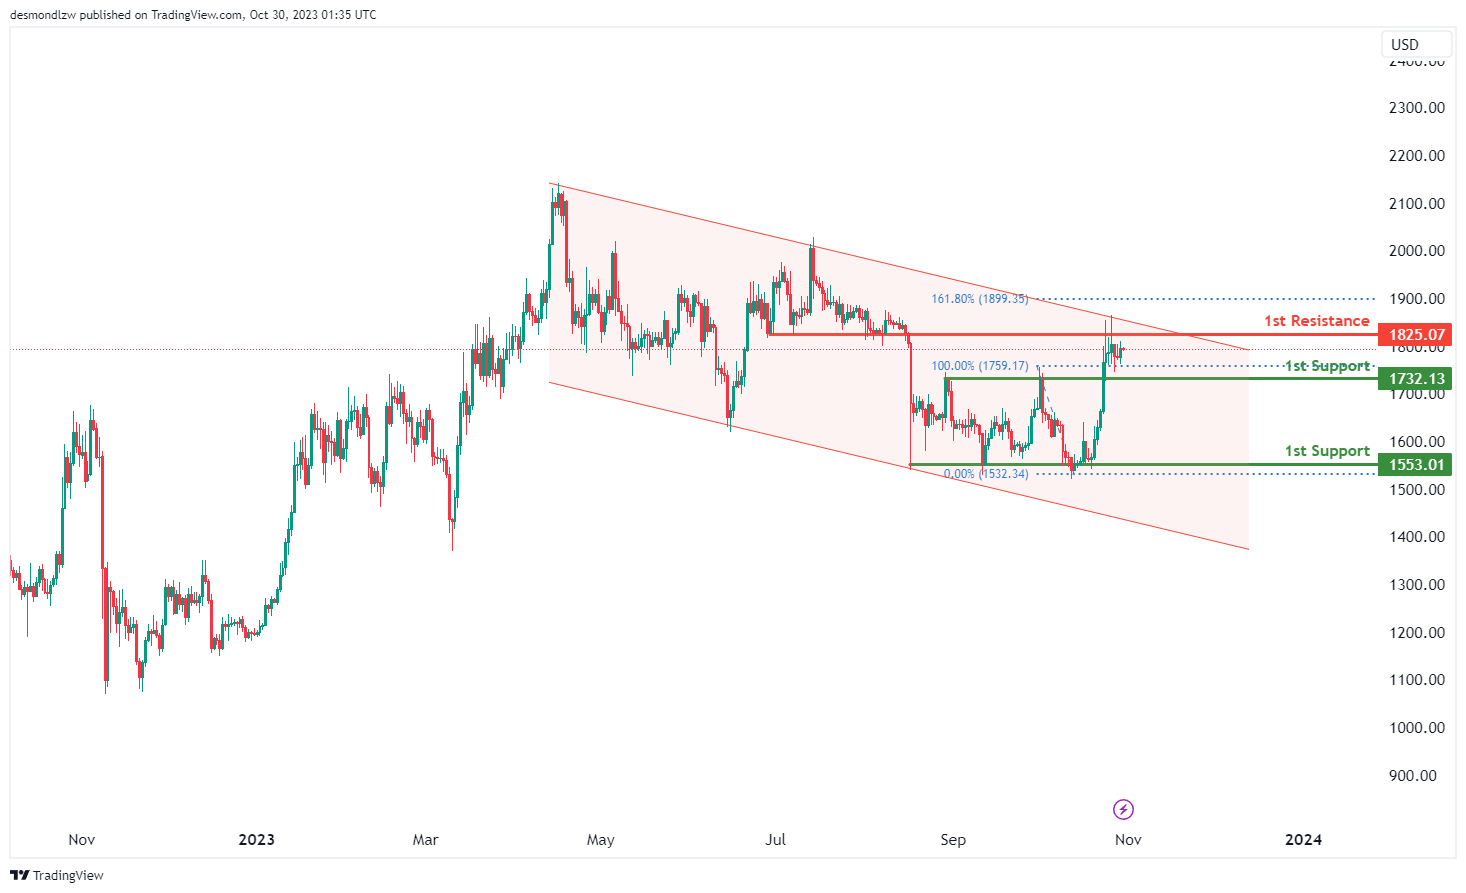
ETH/USD:
The ETH/USD chart currently exhibits a bearish overall momentum, and this momentum is reinforced by the price being within a bearish descending channel. There’s a potential scenario for a bearish continuation towards the 1st support level at 1732.13.
The 1st support at 1732.13 is considered significant as it aligns with a pullback support level, suggesting it could act as a substantial area of price support. Additionally, there is a 2nd support level at 1553.01, identified as a multi-swing low support, further reinforcing the potential for it to serve as a support zone.
On the resistance side, the 1st resistance at 1825.07 is characterized as an overlap resistance, indicating a potential barrier to further upward price movements in the bearish direction.
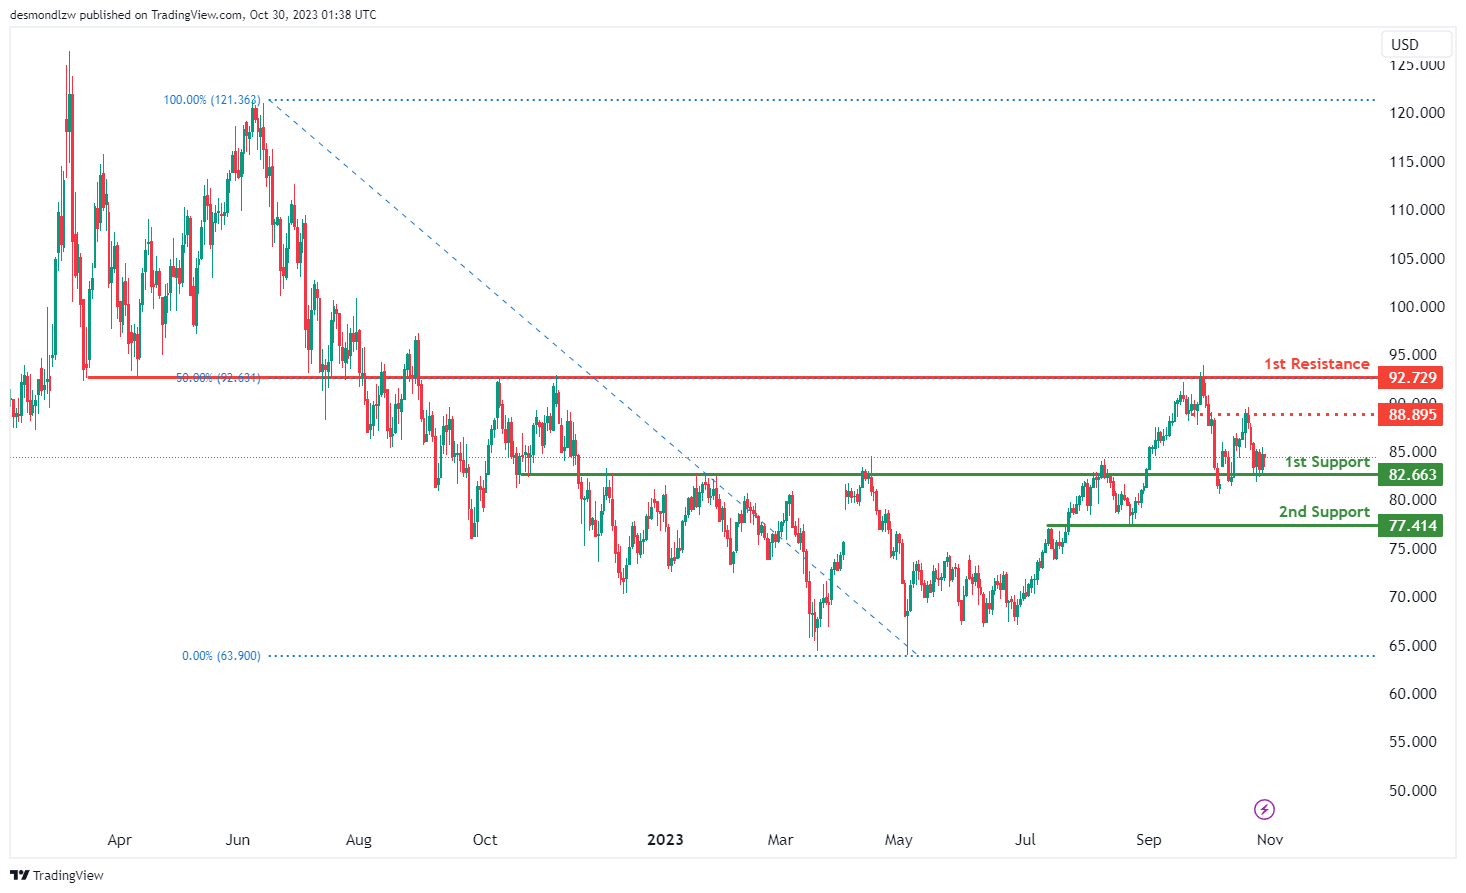
WTI/USD:
The WTI chart currently exhibits a bullish overall momentum, indicating the potential for a bullish bounce off the 1st support level and a move towards the 1st resistance.
The 1st support at 82.66 is considered significant as it aligns with an overlap support, making it a potentially strong support level. Additionally, there is a 2nd support at 77.41, which is also identified as an overlap support, reinforcing the potential support zone.
On the resistance side, the 1st resistance at 92.72 is characterized as an overlap resistance and coincides with the 50% Fibonacci Retracement level, making it a strong potential barrier to upward price movement. There is also an intermediate resistance level at 88.89, marked as an overlap resistance, which could further impede upward price advances.
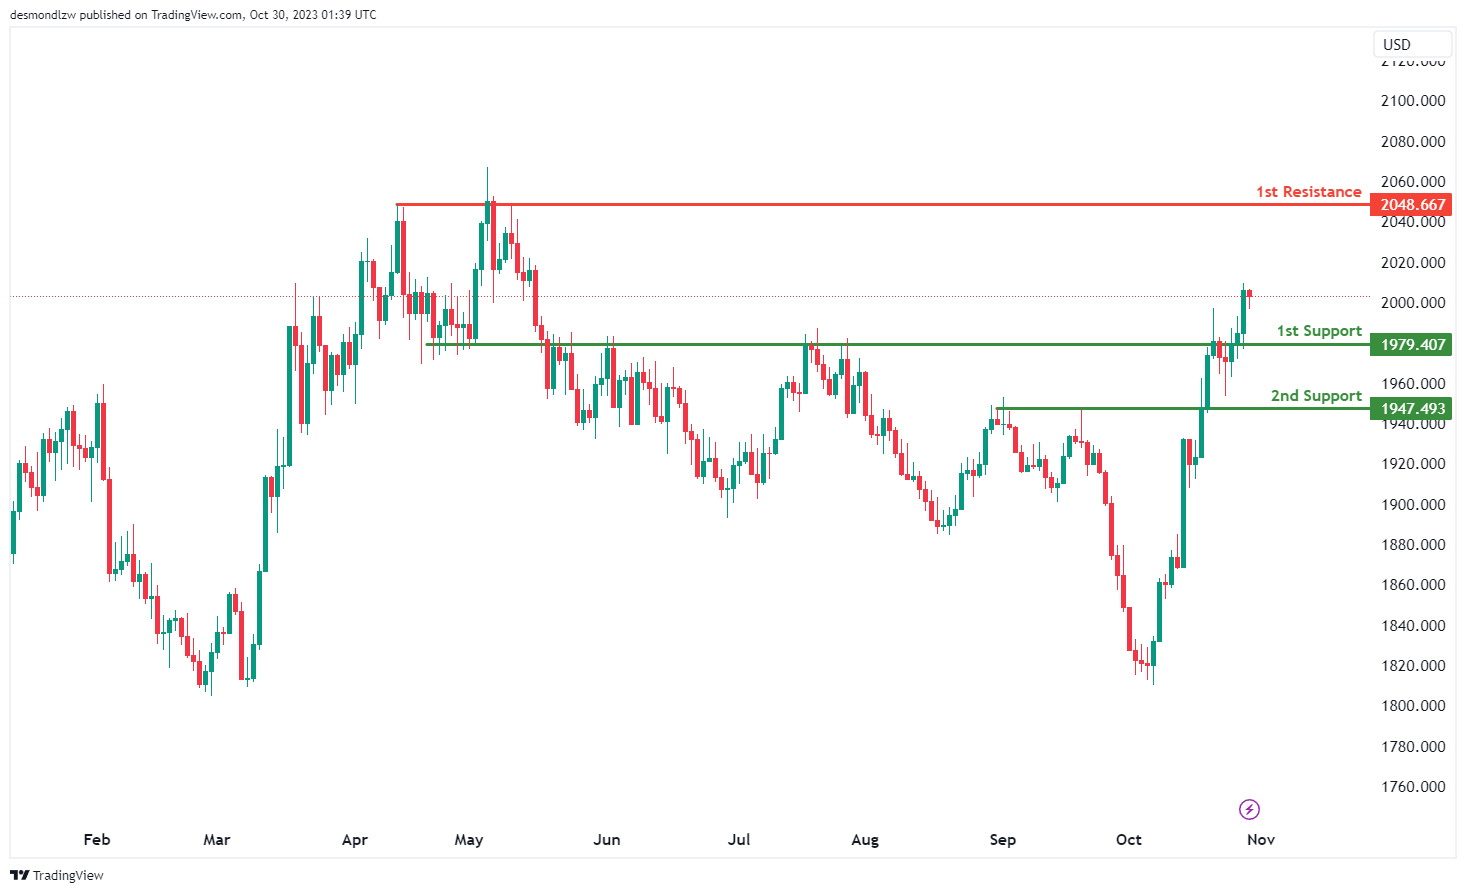
XAU/USD (GOLD):
The XAU/USD (Gold/US Dollar) chart currently demonstrates bullish momentum, suggesting the potential for a bullish continuation towards the 1st resistance level at 2048.66.
The 1st support at 1979.40 is considered significant as it aligns with an overlap support, indicating its potential to act as a strong support level. Additionally, the 2nd support level at 1947.49 is identified as a pullback support, reinforcing the potential support zone.
On the resistance side, the 1st resistance at 2048.66 is characterized as a multi-swing high resistance, implying that it could pose a significant obstacle to any notable upward price movement in the bullish direction.
The accuracy, completeness and timeliness of the information contained on this site cannot be guaranteed. IC Markets does not warranty, guarantee or make any representations, or assume any liability regarding financial results based on the use of the information in the site.
News, views, opinions, recommendations and other information obtained from sources outside of www.icmarkets.com, used in this site are believed to be reliable, but we cannot guarantee their accuracy or completeness. All such information is subject to change at any time without notice. IC Markets assumes no responsibility for the content of any linked site.
The fact that such links may exist does not indicate approval or endorsement of any material contained on any linked site. IC Markets is not liable for any harm caused by the transmission, through accessing the services or information on this site, of a computer virus, or other computer code or programming device that might be used to access, delete, damage, disable, disrupt or otherwise impede in any manner, the operation of the site or of any user’s software, hardware, data or property.


