
Key risk events today:
ECB President Lagarde and BoE Gov Bailey Speak.
(Previous analysis as well as outside sources – italics).
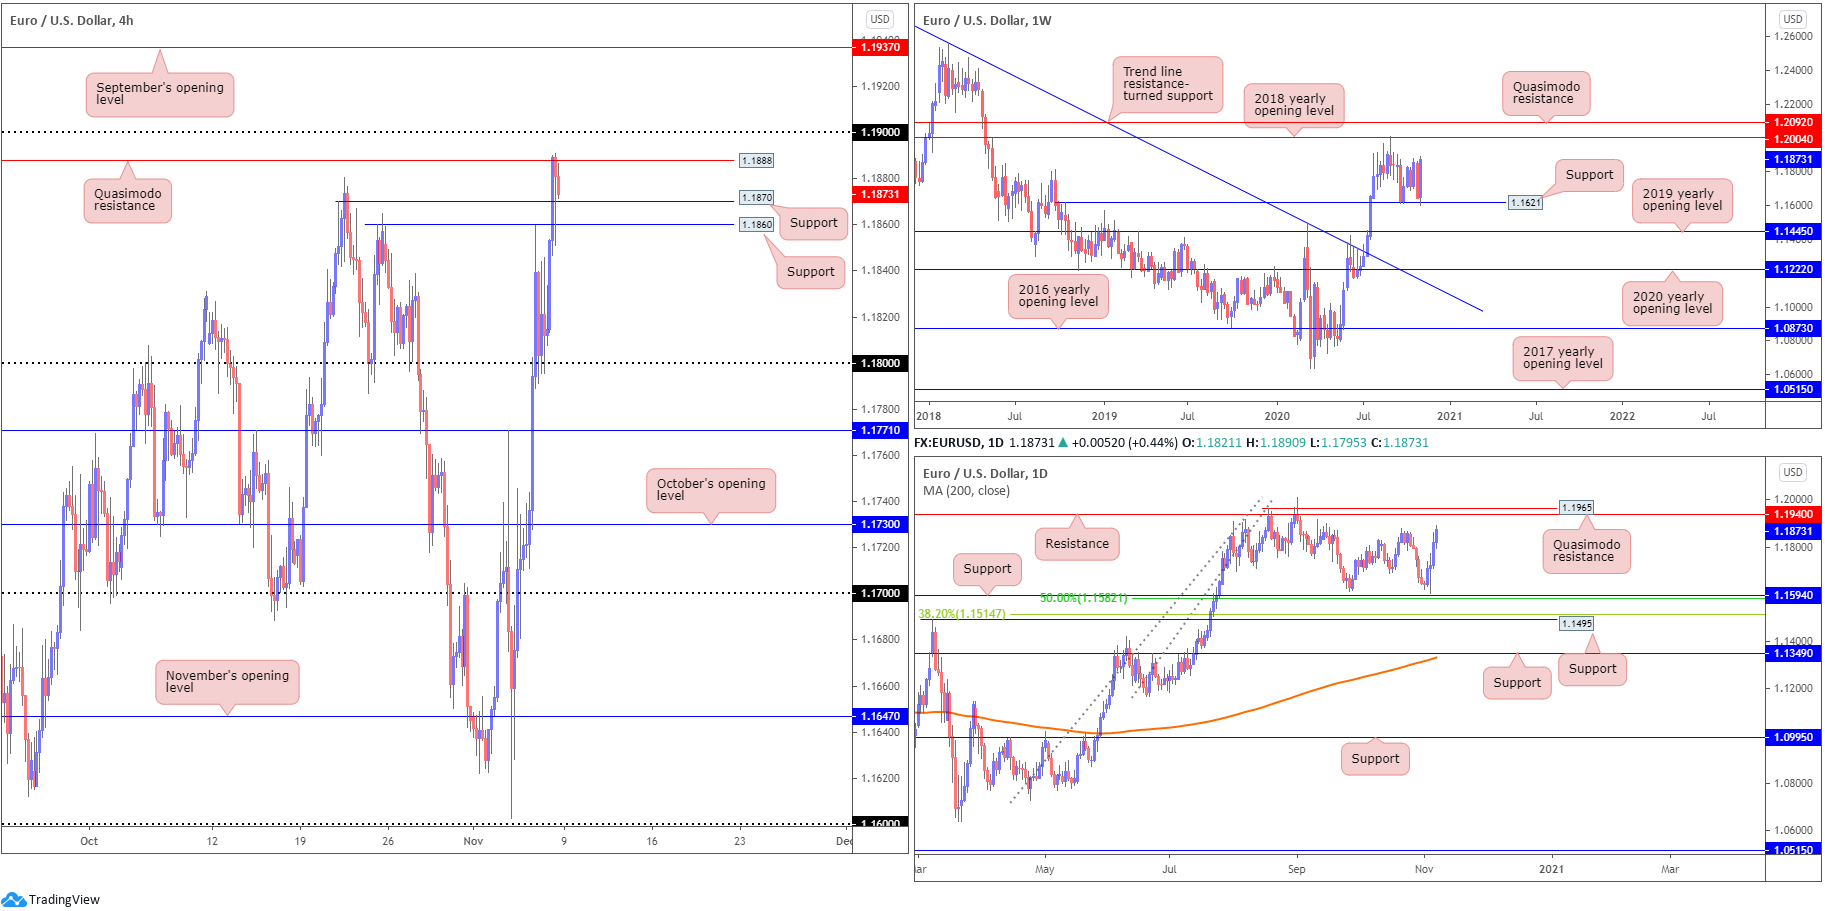
EUR/USD:
Weekly gain/loss: +1.96%
Weekly close: 1.1873
Weekly perspective:
Surging 2%, Europe’s shared currency capitalised on the US dollar’s demise last week. Sharply bid off support at 1.1621, with enough passion to wipe out recent losses and form a bullish reversal candle, the 2018 yearly opening value at 1.2004 is set as the next upside target this week, closely shadowed by Quasimodo resistance priced at 1.2092.
Trend traders may also acknowledge July’s trend line resistance break, taken from the high 1.2555, on top of the break of the 1.1495 March 9 swing high.
Daily perspective:
In the shape of four consecutive bullish candles, last week had EUR/USD bulls make an appearance just north of support at 1.1594 and nearby 50.0% retracement ratio at 1.1582. This has brought light to resistance at 1.1940 and Quasimodo resistance at 1.1965 this week, organised under the weekly resistance at 1.2004 (2018 yearly opening value).
H4 perspective
October’s non-farm payrolls surprised to the upside Friday, adding 638,000 jobs following an upwardly revised 672,000 print in September. In addition, US unemployment ticked lower to 6.9%, down from September’s 7.9% reading.
Into the closing stages of Friday’s session, deriving technical impetus from the 1.18 retest earlier in the day, H4 overturned two Quasimodo resistances at 1.1860 and 1.1870 and shook hands with another Quasimodo resistance priced in at 1.1888. Selling pressure from 1.1888, as you can see, has been somewhat restricted by 1.1860 and 1.1870 serving as supports. This unlocks a possible bullish scenario north of the 1.19 handle to September’s opening value at 1.1937.
Areas of consideration:
- Weekly price twisting off support at 1.1621 and forming a bullish reversal candle could convince buyers to target at least daily resistance at 1.1940 this week.
- The above opens up a possible 1.19 break in early trade on the H4, and subsequent advance to 1.1937 (September’s opening value).
- In view of the connection between 1.1937 and daily resistance at 1.1940, however, sellers may also make an appearance here.
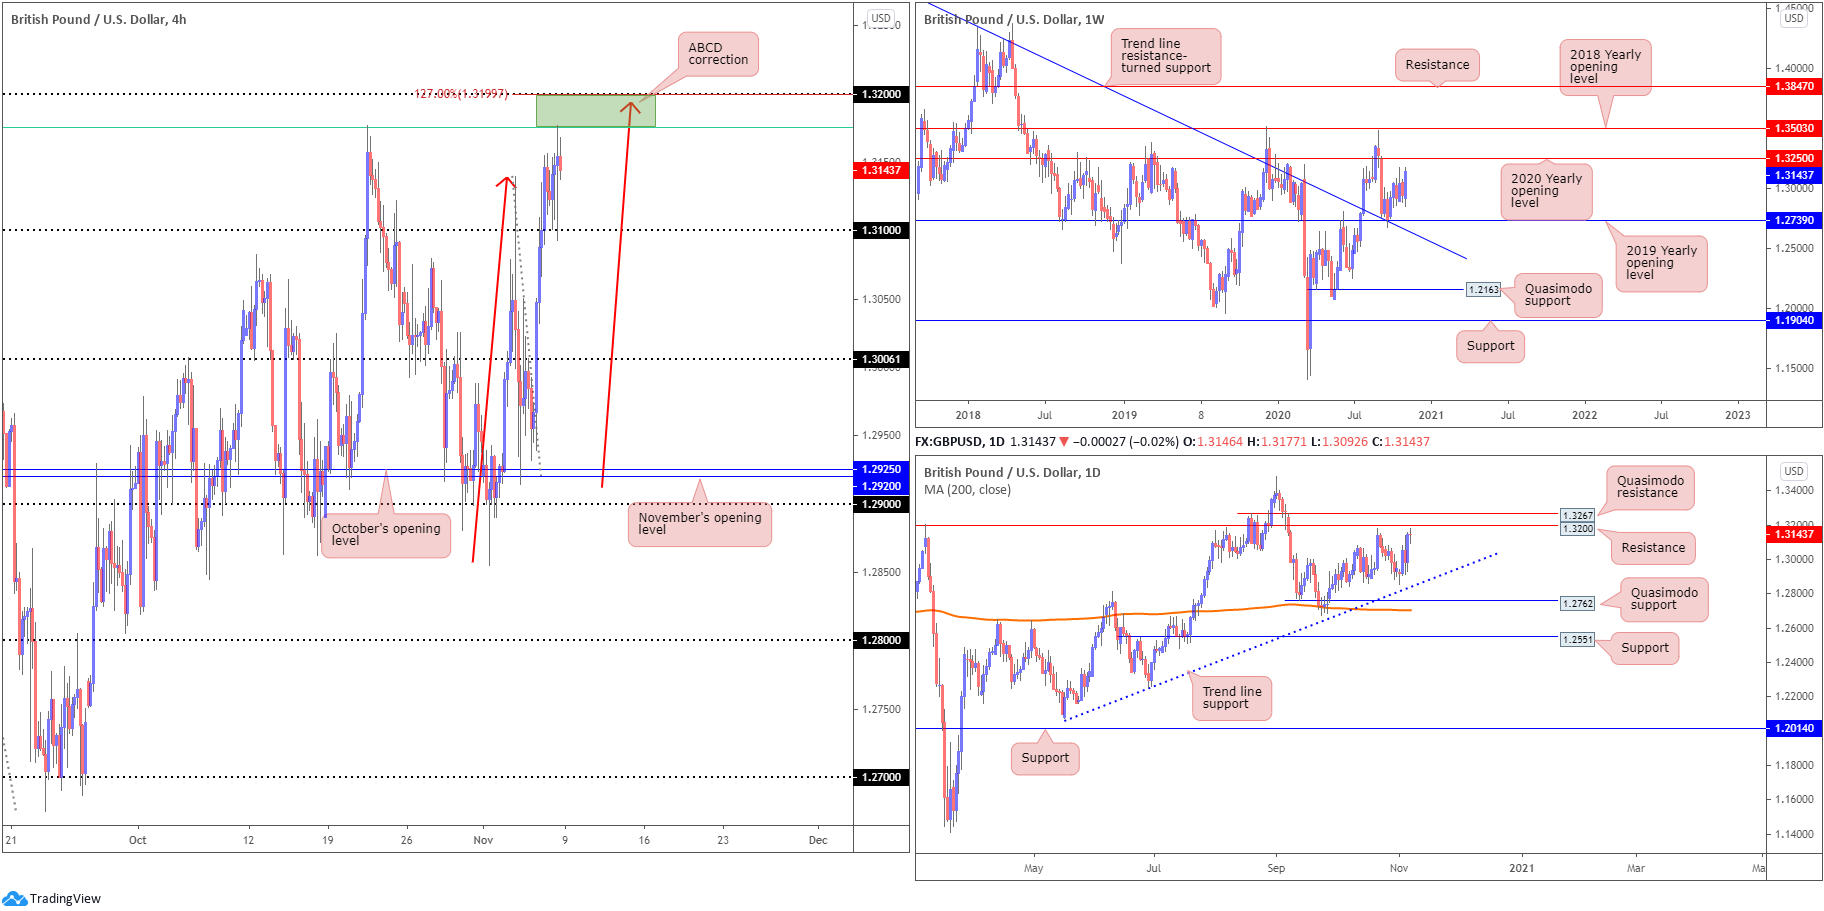
GBP/USD:
Weekly gain/loss: +1.53%
Weekly close: 1.3143
Weekly perspective:
In a similar manner to EUR/USD, the British pound outperformed against the buck last week, adding 200 pips and producing a solid bullish engulfing candle. The 2020 yearly opening value at 1.3250 is seen as the next port of call to the upside, with a break exposing the 2018 yearly opening value at 1.3503.
While it’s unlikely we’ll voyage this far south this week, the 2019 yearly opening value from 1.2739 is observed, closely converging with trend line resistance-turned support, taken from the high 1.5930. It is also worth pointing out the aforementioned trend line was engulfed in July of this year, announcing an uptrend could be on the cards.
Daily perspective:
Leaving trend line support, extended from the low 1.2075, unchallenged, recent flow finished within striking distance of resistance at 1.3200. Traders will also observe Quasimodo resistance overhead at 1.3267.
Quasimodo support at 1.2762 and the 200-day SMA (orange – 1.2704) are also interesting areas to note, arranged just south of the aforementioned trend line support.
H4 perspective:
Cable echoed a subdued stance Friday, delivering a doji indecision candle on the daily timeframe. This followed Thursday’s 1.3% rally on dollar weakness amidst healthy risk appetite.
Following a retest at the 1.31 handle, Friday responded from interesting resistance (noted in Friday’s technical briefing) between 1.32/1.3174 (green), made up of the 1.32 handle, an ABCD pullback (red arrows) at 1.3192, a 1.27 BC projection point at 1.3199 along with a 61.8% Fibonacci retracement ratio at 1.3174 (green line).
Above 1.32/1.3174, little is seen on offer in terms of resistance until reaching 1.33ish.
Areas of consideration:
- Higher timeframes display room to move higher until daily resistance at 1.3200.
- With 1.3200 representing the upper edge of the H4 resistance zone at 32/1.3174, this area could be somewhere that attracts selling, perhaps retesting 1.31 this week. The caveat, of course, is the possibility weekly buyers press for resistance at 1.3250 and squeeze out any lower timeframe sellers.
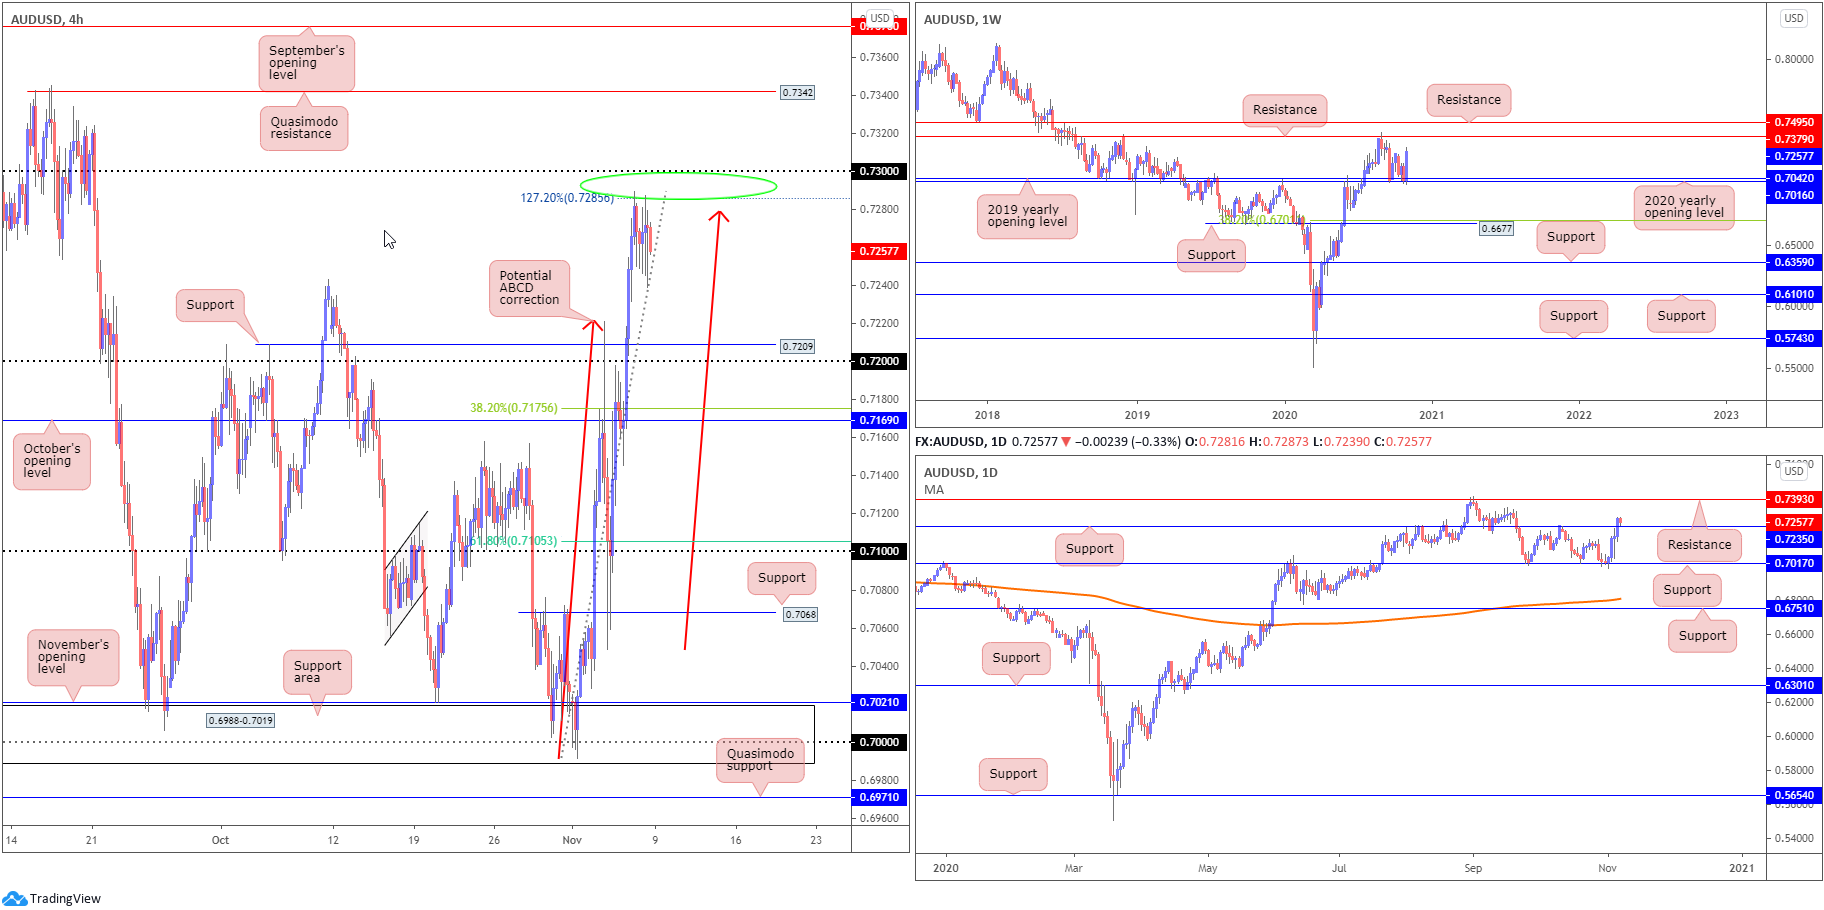
AUD/USD:
Weekly gain/loss: +3.29%
Weekly close: 0.7257
Weekly perspective:
Last week’s risk rally, together with the 2020 (0.7016) and 2019 (0.7042) yearly opening values (supports), underpinned the Australian dollar’s near-250-pip advance against the US dollar, consequently producing a sizeable bullish engulfing candle.
The positive close, in addition to this market trending higher since early 2020, might motivate additional bullish flow this week towards resistance priced in at 0.7379.
Daily perspective:
Shaped by four consecutive bullish candles, initially deriving impetus off support at 0.7017, Thursday ripped through resistance at 0.7235 and directed the spotlight towards resistance at 0.7393 (sited just above weekly resistance at 0.7379).
Before bulls attempt to shift gears, a retest at 0.7235 as support could be in the offing.
H4 perspective:
Friday’s technical briefing noted the following (italics):
H4, thanks to Thursday’s upbeat tone, is now touching gloves with an interesting area of resistance, composed of the 0.73 handle and an ABCD resistance (red arrows) at 0.7279 (along with a 127.2% Fib projection point at 0.7285).
Friday, as evident from the chart, ended the session marginally lower. Sellers have clearly expressed interest in the 0.73/0.7285 region; the question is whether they have enough energy to take the currency pair back to the 0.72 neighbourhood this week, as Friday could simply represent buyers liquidating positions ahead of the weekend.
Areas of consideration:
- Sellers have their work cut out for them from 73/0.7285 on the H4. Not only do both weekly and daily charts reveal room to move beyond 0.73 to at least 0.7379 (weekly resistance), a downside move on the H4 could be halted as soon as 0.7235 support on the daily timeframe.
- A retreat to 0.72 could trigger dip-buyers, while a H4 close above 0.73 may tempt breakout buying moves, targeting Quasimodo resistance at 0.7342, followed by September’s opening value at 0.7376.
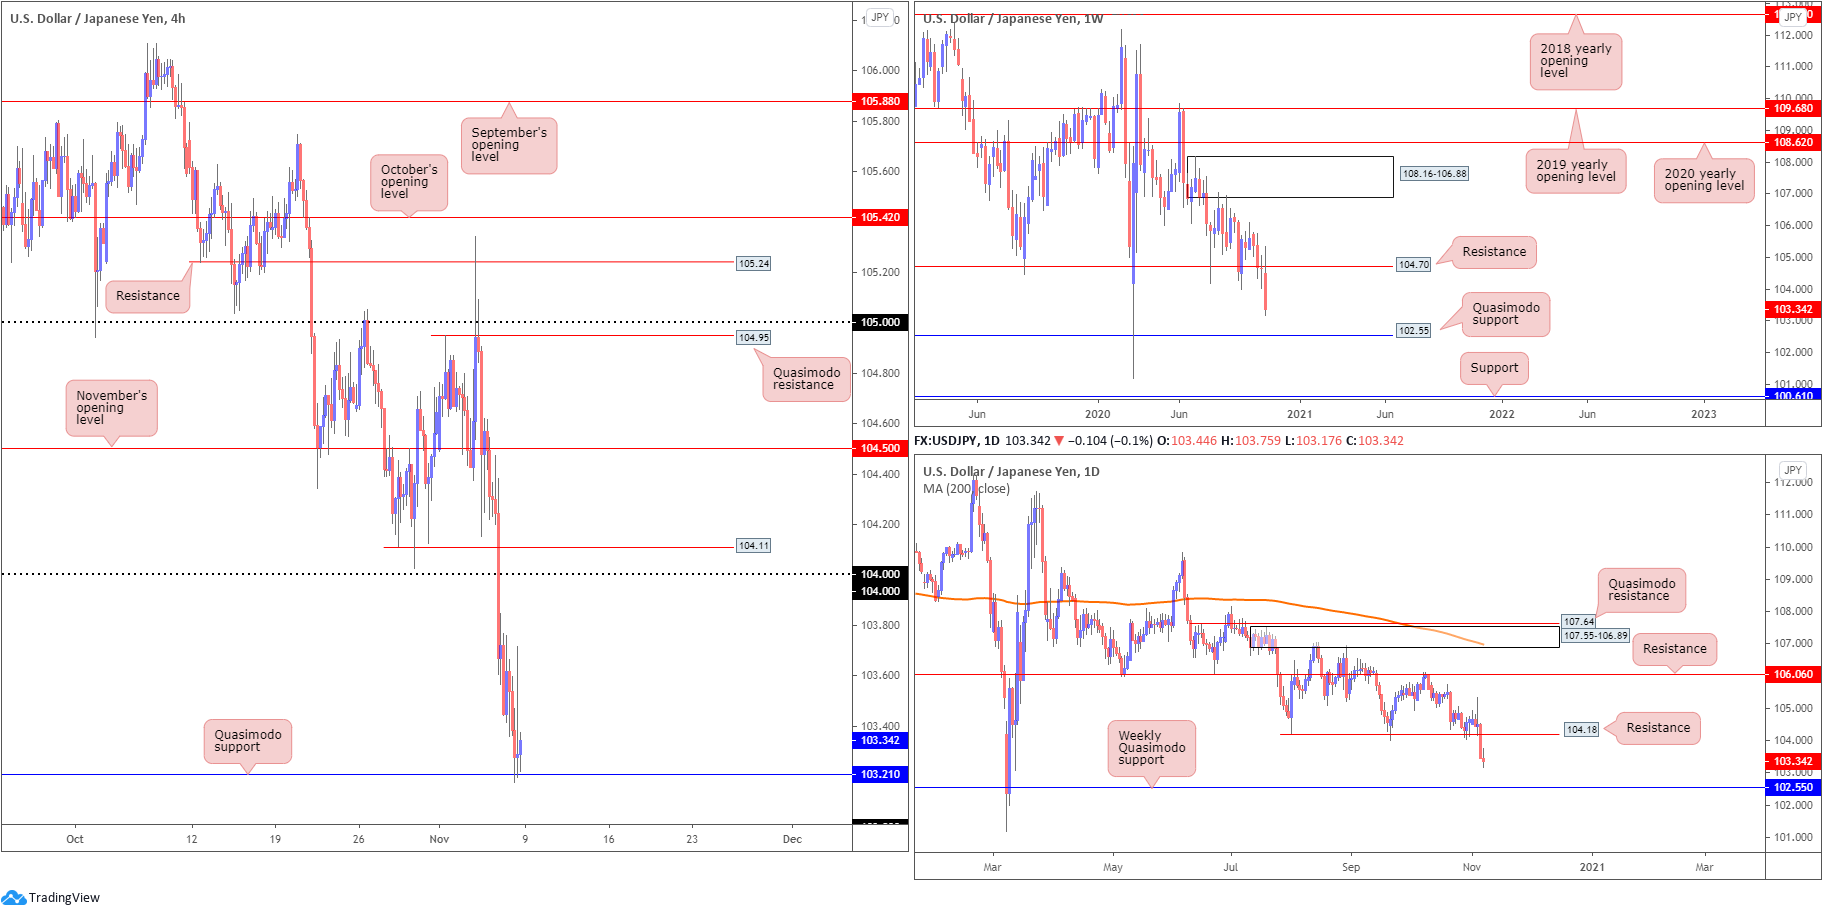
USD/JPY:
Weekly gain/loss: -1.25%
Weekly close: 103.34
Weekly perspective:
Long-term support at 104.70 was submerged as a result of broad-based USD weakness last week. Shedding 130 pips and recording a fourth consecutive bearish week, Quasimodo support at 102.55 offers a feasible target, with a break bringing light to another layer of support at 100.61.
Overall, we have been trending lower since 2017 on this scale.
Daily perspective:
Movement on the daily timeframe also flattened support at 104.18 (now acting resistance), potentially setting the stage for an approach to weekly Quasimodo support mentioned above at 102.55 this week.
H4 perspective:
Thursday’s action destroying 104 led to Friday crossing swords with not only multi-month lows but also Quasimodo support at 103.21, a level positioned just north of the 103 handle.
Areas of consideration:
- Sentiment, based on the higher timeframes, still currently favours sellers.
- Absent of support on the higher timeframes until reaching weekly Quasimodo support at 102.55, and a lack of bullish enthusiasm witnessed off H4 Quasimodo support from 103.21 could promote bearish scenarios this week. A H4 close under 103.21/103 clears H4 supports for weekly sellers to approach 102.55 and simultaneously provides intraday sellers a potential opportunity.
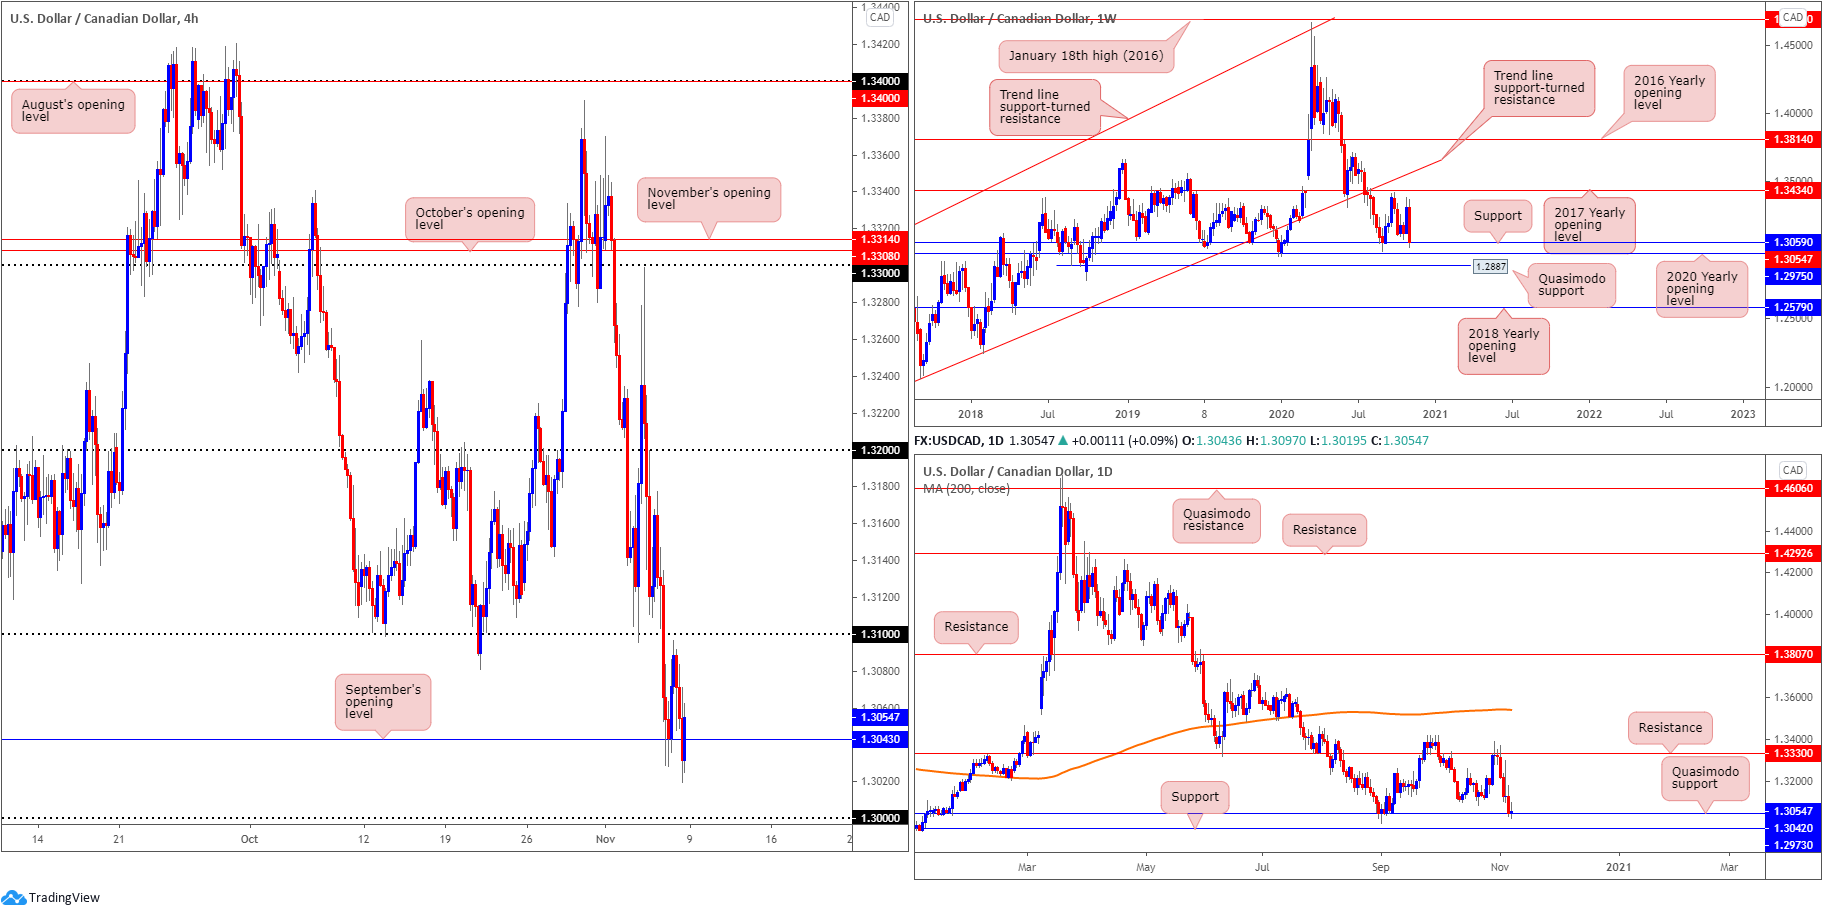
USD/CAD:
Weekly gain/loss: -1.96%
Weekly close: 1.3054
Weekly perspective:
Sinking more than 250 pips south of the 2017 yearly opening value at 1.3434 last week guided price into support at 1.3059, plotted north of the 2020 yearly opening value at 1.2975 and a Quasimodo support priced in at 1.2887.
Given this market has traded lower since topping at 1.4667 in early 2020, breaking the aforementioned supports swings the pendulum in favour of further weakness towards the 2018 yearly opening value at 1.2579.
Daily perspective:
The week kicked off with a strong response from resistance at 1.3330, a level exhibiting history as far back as August 2019, leading to Thursday shaking hands with Quasimodo support at 1.3042. Traders will acknowledge this level closely intersects with weekly support at 1.3059.
Friday offered little sign of bullish recovery off 1.3042, projecting a possible move to support at 1.2973 this week.
H4 perspective:
Persistent USD softness capped upside attempts in USD/CAD Friday, despite oil breaking beneath $37.50 a barrel. US politics remained the key driver for the day.
Technically, the pair continues to toy with September’s opening value from 1.3043, as early trade on Friday faded levels just south of the 1.31 handle. The key figure 1.30 is likely a monitored level as we head into a fresh week.
Areas of consideration:
- The rationale behind September’s opening value at 1.3043 remaining somewhat supportive of late is down to the level joining closely with both weekly support from 1.3059 and daily Quasimodo support at 1.3042. However, given the recent failure to reach 1.31, prospective buyers here may seek a H4 close north of 1.31 before taking action.
- 30 also remains a crucial level to watch this week. This barrier, in addition to daily support at 1.2973, which essentially marks the same base as weekly support at 1.2975 (2020 yearly opening value), potentially offers a strong floor.
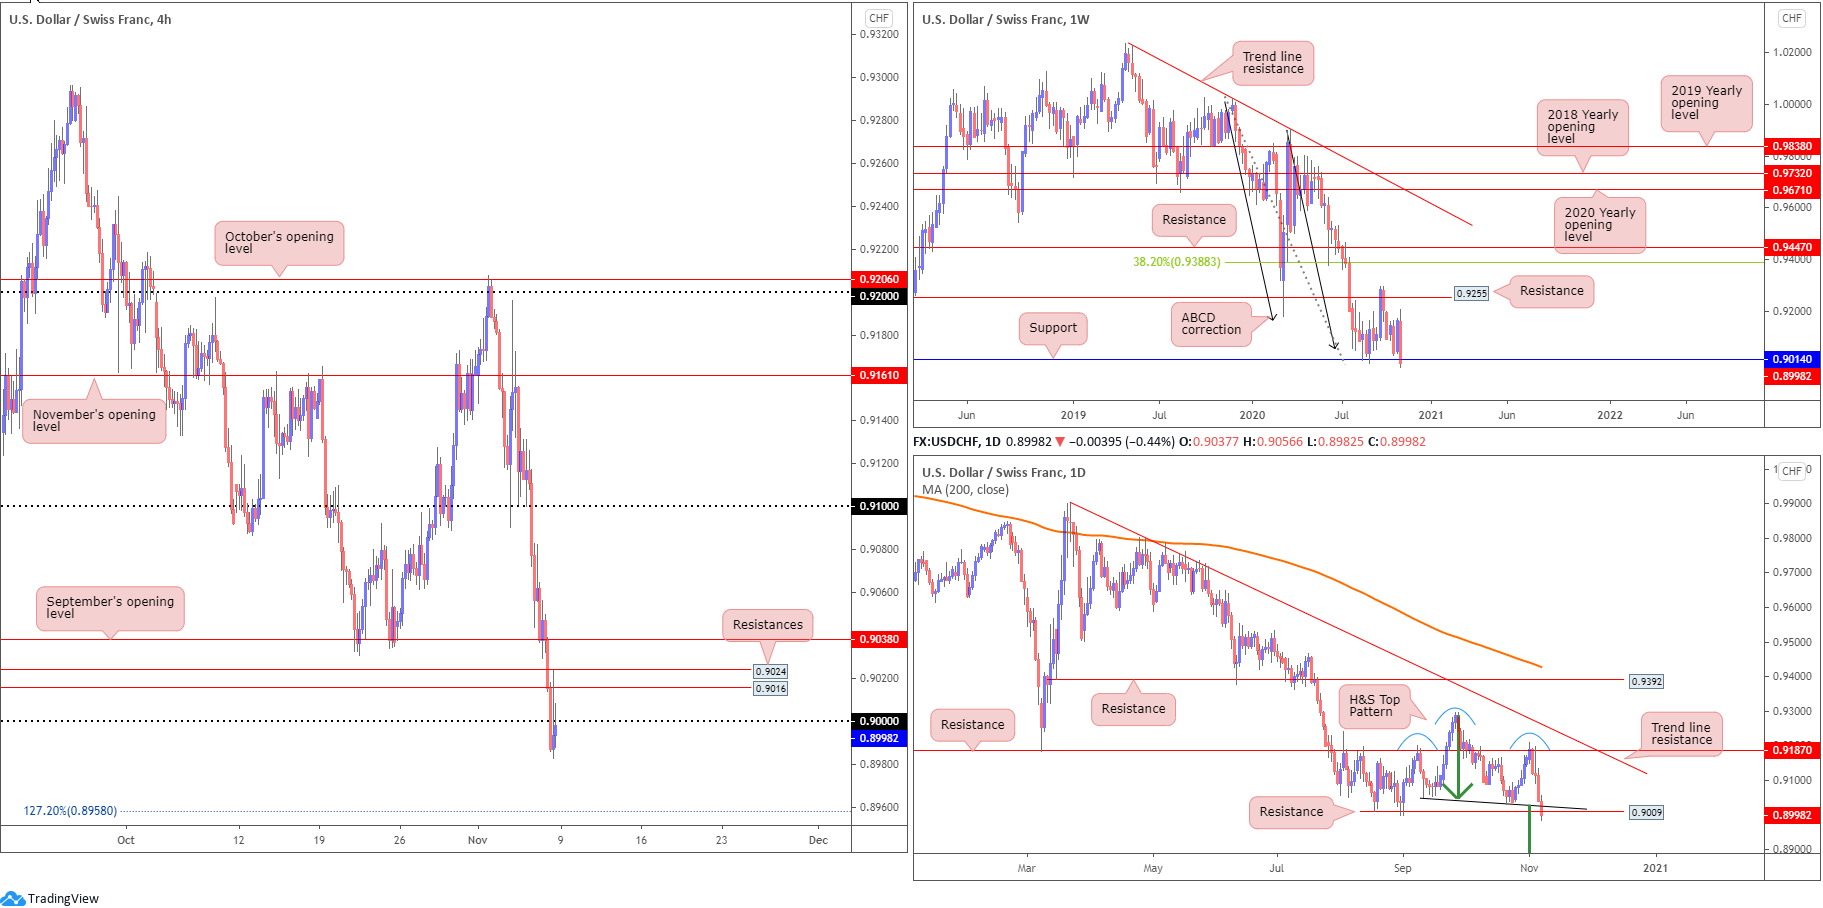
USD/CHF:
Weekly gain/loss: -1.82%
Weekly close: 0.8998
Weekly perspective:
A substantial bearish reversal candle introduced itself last week as USD/CHF slipped more than 160 pips and closed around 20 pips off session lows.
A support at 0.9014, a level dovetailing closely with ABCD support at 0.9051 (black arrows), is also in play on the weekly timeframe, though offers a fragile tone. Therefore, pencilling in Quasimodo support at 0.8692 might be an idea should sellers remain in the driving seat this week.
It is also worth reminding ourselves that EUR/USD recently rebounded from weekly support and demonstrates scope to climb higher. USD/CHF and EUR/USD hold a strong inverse correlation.
Daily perspective:
Thanks to four decisive bearish candles printing off resistance at 0.9187 last week, price action ran into, and mildly surpassed, a Quasimodo support at 0.9009, which could, as labelled on the chart, now serve as resistance.
Another interesting feature on the daily timeframe is the head and shoulder’s top pattern, with Friday cementing a close beneath its neckline, taken from the low 0.9048. According to the pattern’s rules, the take-profit target (green arrows) falls in around 0.8787.
H4 perspective:
Friday’s near-0.5% slide pulled H4 flow sub 0.90 after breaching neighbouring Quasimodo supports at 0.9024 and 0.9016 (now serving as resistances). Beneath the aforementioned levels, sellers appear free to stage an assault on the 127.2% Fibonacci projection point at 0.8958, followed by the 0.89 handle.
Areas of consideration:
- With support on the weekly timeframe at 0.9014 under pressure and daily price implying a continuation to the downside on the back of the H&S neckline and 0.9009 support break, this suggests H4 sellers could attempt to secure a position south of 0.90 in early trading.
- While 0.90 may hold as resistance, the possibility of a retest at 0.9024/0.9016 on the H4 is certainly there before sellers step in and make a show.
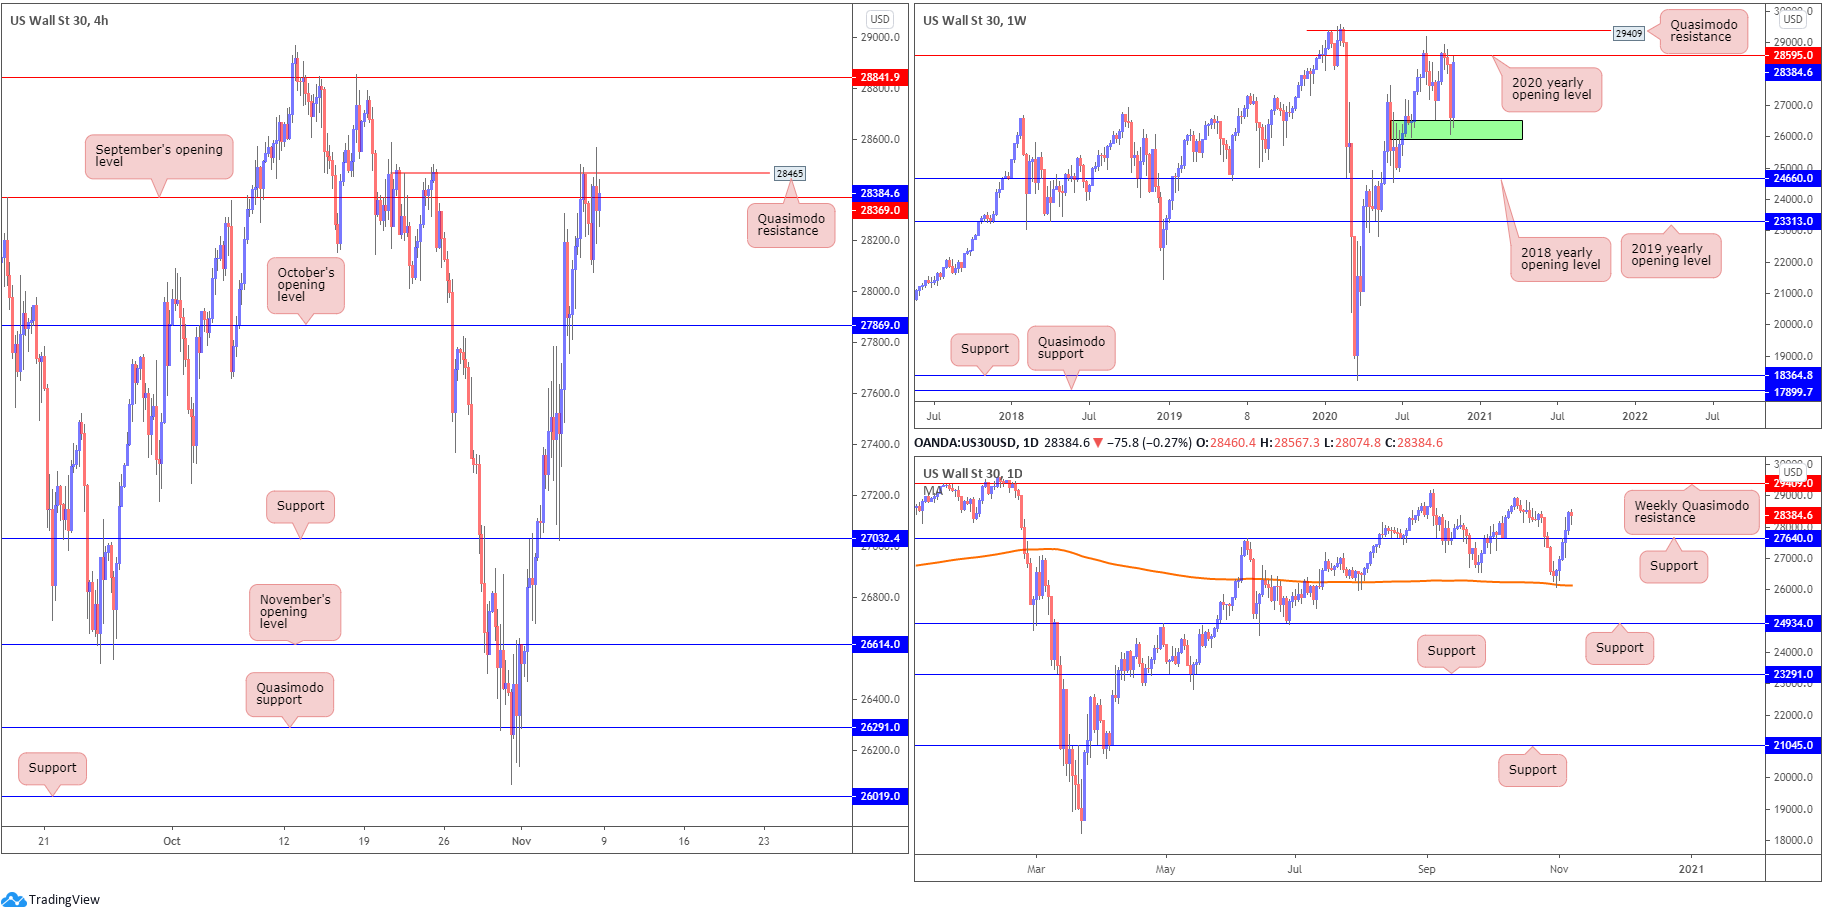
Dow Jones Industrial Average:
Weekly gain/loss: +6.65%
Weekly close: 28384
Weekly perspective:
The rebound from weekly demand at 25916-26523 (green) has been quite something, reclaiming all of the prior week’s losses and drawing the unit towards the 2020 yearly opening value at 28595.
This also firmly places Quasimodo resistance at 29409 in the crosshairs this week.
Daily perspective:
Together with the robust buying out of weekly demand, daily flow unseated resistance at 27640 (now acting support) in recent trading. This, technically, could have buyers shoot through tops around 28950 for weekly Quasimodo resistance at 29409 this week.
Before exploring higher levels, however, a retest of support at 27640 could be seen.
H4 perspective:
US equity benchmarks pencilled in their largest weekly increases since the month of April last week. The Dow Jones Industrial Average declined 66.78 points, or 0.24%, the S&P 500 ended flat while the Nasdaq traded higher by 4.30 points, or 0.04%.
Following a retest of October’s opening value at 27869, the second half of the week drew candle action into September’s opening value at 28369 and Quasimodo resistance at 28465. This area, despite a pop to highs at 28567 on Friday, remained in play going into the close.
Areas of consideration:
- Although H4 demonstrates resistance may develop off the Quasimodo formation at 28465 and September’s opening value at 28369, a spike to weekly resistance at 28595 may occur (the 2020 yearly opening value) before serious sellers make an appearance.
- Although the daily timeframe suggests further upside is a possibility, the fact we have H4 resistance and nearby weekly resistance to contend with might deter additional long positions this week.
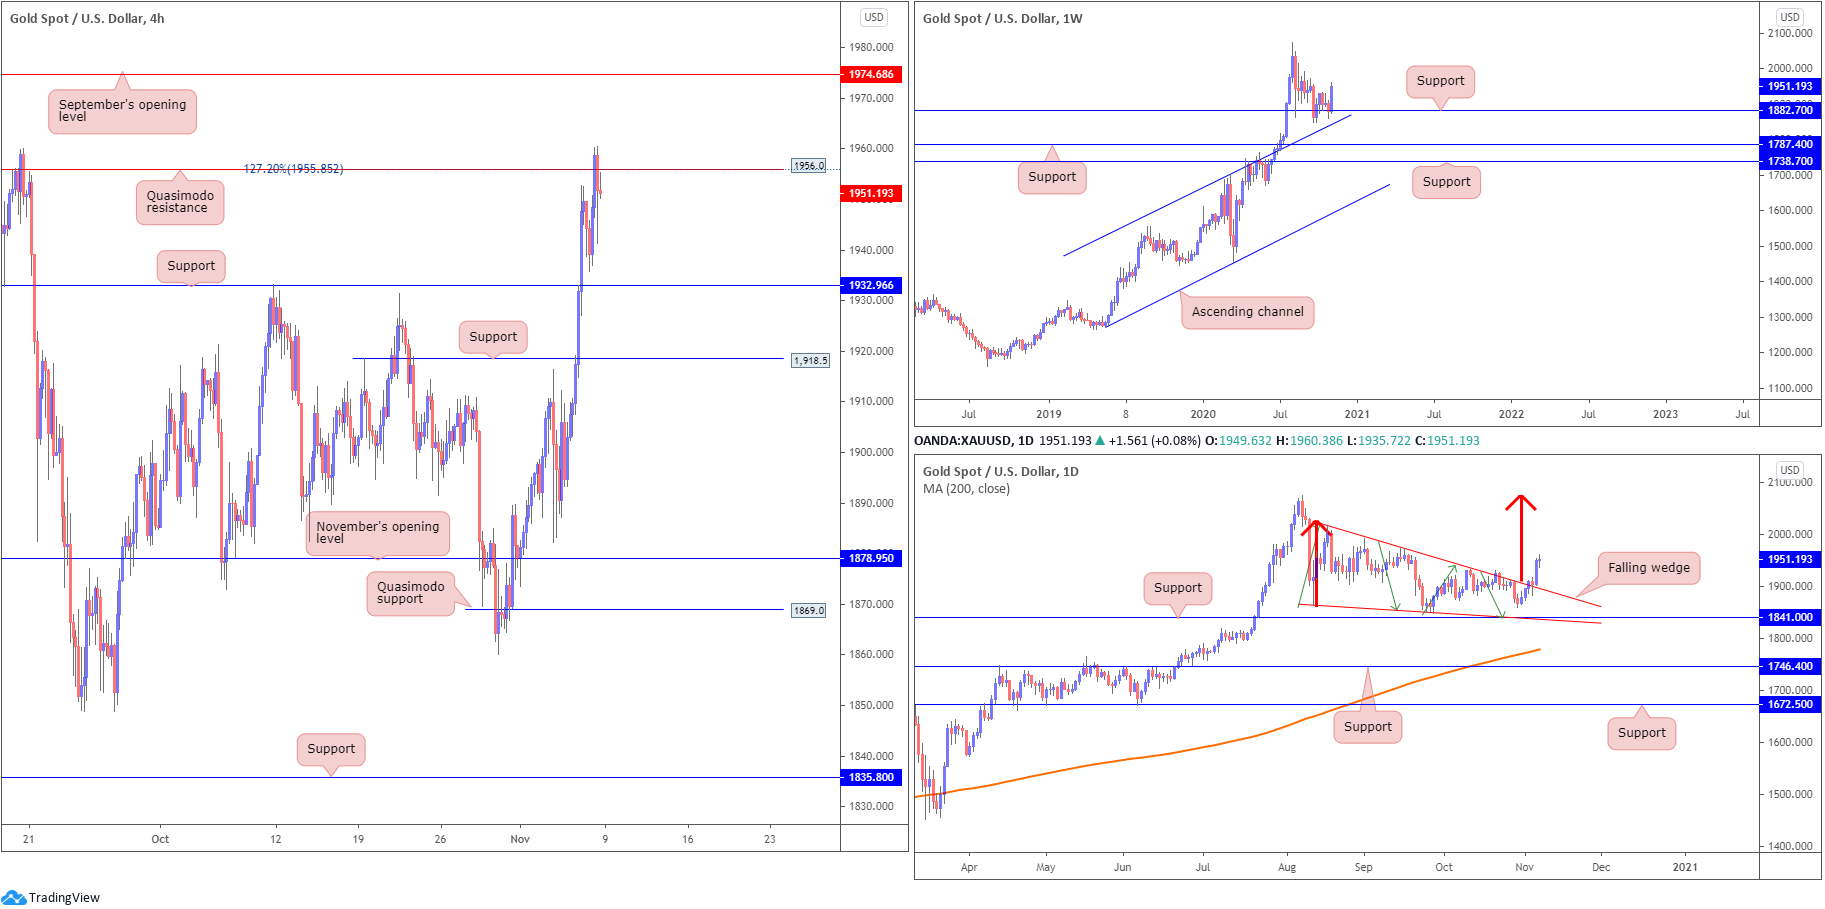
XAU/USD (GOLD):
Weekly gain/loss: +3.84%
Weekly close: $1,951
Weekly perspective:
XAU/USD buyers stepped forward in dominant fashion last week, rebounding from support at $1,882 and adding more than $70. The horizontal level is, as you can see, stationed just north of channel resistance-turned support, taken from the high $1,703.
Should another wave of buying emerge this week, long-term traders’ crosshairs are perhaps focussed on the all-time peak $2,075.
Daily perspective:
The daily timeframe has been in the process of creating a falling wedge pattern between $2,015 and $1,862 since mid-August (the lower boundary also lines up closely with support at $1,841).
Thursday’s 2.5% advance observed the precious metal extend above the upper edge of the falling wedge, enough to excite pattern traders who will now likely be eyeballing the falling wedge take-profit target (red arrows) at around all-time highs from $2,075. This, together with gold trending decisively higher since 2016 (although price has been trending higher much longer than this overall), may encourage further buying this week.
H4 perspective:
Thursday ran through resistance at $1,932 and Friday crossed swords with Quasimodo resistance at $1,956 and a 127.2% Fibonacci projection point at $1,955.
Although sellers have made somewhat of a stand from $1,956, the most sellers are likely to receive from here is a $1,932 retest.
Areas of consideration:
- Long term, the breakout above the daily falling wedge could spark additional bullish moves off weekly support ($1,882). This may have candles reach for the daily falling wedge take-profit target around $2,075 and then potentially move into unchartered territory.
- Assuming longer-term bulls make an appearance, a H4 retest at $1,932 could be movement that interests buyers, particularly if the retest forms in the shape of a bullish candlestick pattern. Alternatively, a H4 close north of $1,956 this week signals a continuation rally to September’s opening value at $1,974.
The accuracy, completeness and timeliness of the information contained on this site cannot be guaranteed. IC Markets does not warranty, guarantee or make any representations, or assume any liability regarding financial results based on the use of the information in the site.
News, views, opinions, recommendations and other information obtained from sources outside of www.icmarkets.com.au, used in this site are believed to be reliable, but we cannot guarantee their accuracy or completeness. All such information is subject to change at any time without notice. IC Markets assumes no responsibility for the content of any linked site.
The fact that such links may exist does not indicate approval or endorsement of any material contained on any linked site. IC Markets is not liable for any harm caused by the transmission, through accessing the services or information on this site, of a computer virus, or other computer code or programming device that might be used to access, delete, damage, disable, disrupt or otherwise impede in any manner, the operation of the site or of any user’s software, hardware, data or property


