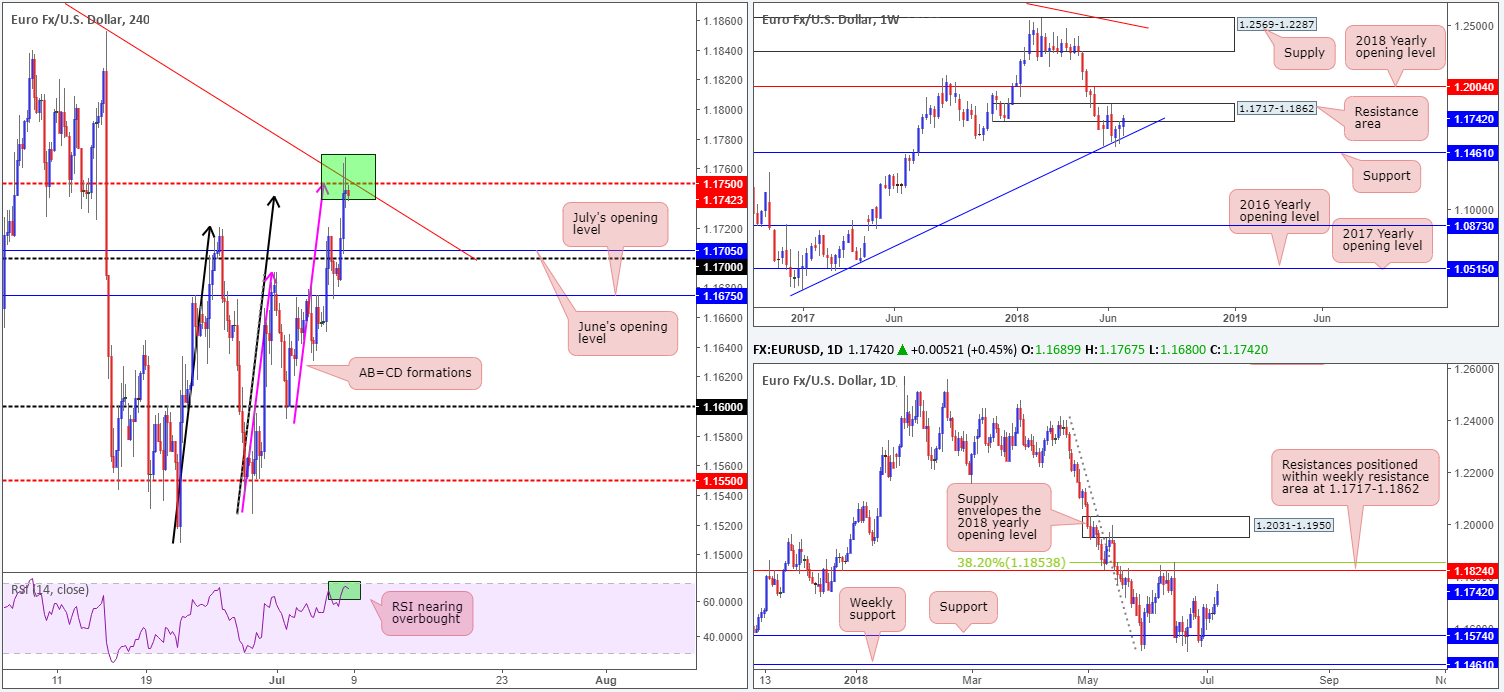
EUR/USD:
Weekly Gain/Loss: +0.51%
Weekly Closing price: 1.1742
Weekly perspective:
EUR/USD bulls continued to play offensively last week, extending gains off nearby trend line support (taken from the low 1.0340). Despite price concluding the week not too far off its highs, though, the resistance area parked at 1.1717-1.1862 remains in play. For this reason, traders could witness selling pressure enter the market over the course of this week.
Daily perspective:
After a clean break of the June 26 high 1.1720, buyers on this timeframe appear to have cleared the path north for an approach towards resistance plotted at 1.1824, shadowed closely by a 38.2% Fib resistance at 1.1853. As marked on the chart, these barriers are also situated within the walls of the aforementioned weekly resistance zone.
H4 perspective:
The impact of Friday’s US employment report sent price action skyward in reasonably strong fashion. According to the Bureau of Labor Statistics, the US economy added 213K jobs in June, beating forecasts of 195K. Not so smooth, however, was the unemployment rate and average hourly earnings, both reporting lower-than-expected numbers, ultimately weighing on the greenback and benefiting the euro. The USD was already struggling ahead of the release amid trade war tensions between US and China.
H4 price action, as you can see, though, began mildly paring gains into the close after striking the mid-level resistance at 1.1750. Supporting this resistance are the following structures:
- Trend line resistance taken from the high 1.1996.
- Two AB=CD bearish completion points (black and pink arrows).
- RSI indicator nearing its overbought value.
- Seen planted within the confines of the weekly resistance area mentioned above at 1.1717-1.1862.
Areas of consideration:
A short from 1.1750 on the H4 scale, in view of the surrounding confluence, is a high-probability trade, according to our reading. Technically, the stop-loss order is best placed above Friday’s high at around the 1.1770 mark, with the initial take-profit target set at the 1.17 handle (28-pip stop – 42 pips to the first target [at current price]).
Today’s data points: ECB President Draghi speaks.
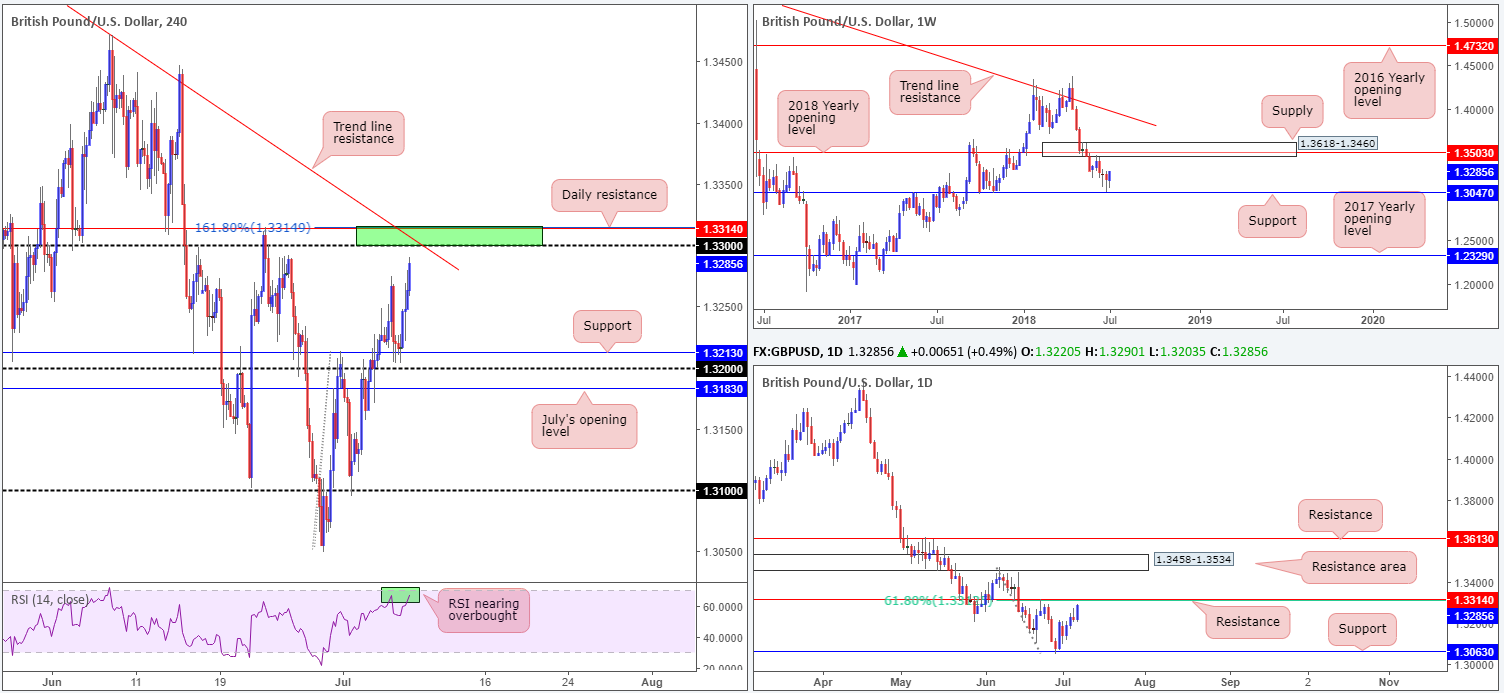
GBP/USD:
Weekly Gain/Loss: +0.59%
Weekly Closing price: 1.3285
Weekly perspective:
After grazing the outskirts of support baked in at 1.3047 two weeks ago, the GBP/USD eventually gained some ground over the course of last week. Consequent to this, traders on this timeframe likely have their crosshairs fixed on supply drawn from 1.3618-1.3460, which happens to fuse with the 2018 yearly opening level at 1.3503.
Daily perspective:
Before weekly buyers can lift the market higher, resistance on the daily timeframe at 1.3314 is likely to put up a fight. Since mid-Oct 2017, this level has provided strong support/resistance on numerous occasions so it is not a base one should overlook! Further adding to this level’s appeal, note the 61.8% Fib resistance value at 1.3312 also unites beautifully with this level.
H4 perspective:
Establishing support around the 1.3213 vicinity, buyers weighed in on Friday and breached Thursday’s high of 1.3274. Bolstered by a weak USD across the board amid concerns over trade between US and China and a somewhat disappointing US employment report, the H4 candles concluded the week just south of the 1.33 handle, followed closely by the daily resistance level mentioned above at 1.3314. Also worth noting on the H4 scale is the RSI indicator seen approaching its overbought value, along with the daily resistance level (marked on the H4 timeframe) seen aligning with a 161.8% Fib ext. point taken from the low 1.3049.
Areas of consideration:
While weekly action portends further upside this week, a pullback from the green H4 zone at 1.3315/1.33 is certainly a possibility. In a nutshell, this small H4 area holds the following confluence:
- 1.33 handle.
- 161.8% Fib ext. point at 1.3315.
- Trend line resistance drawn from the high 1.3608.
- Daily resistance at 1.3314.
- 61.8% daily Fib resistance value at 1.3312.
Although the expectation is for a bounce to be seen from 1.3315/1.33, given the area’s size a fakeout through the top edge of the zone is possible. As such, waiting for H4 price to confirm bearish intent is likely the safer way forward. A H4 full or near-full-bodied bearish candle printed from the green base would, in our view, be enough to pull prices lower. Stop-loss orders are best placed above the rejection candle’s wick, with the first take-profit target set around 1.3250, followed then by 1.32ish.
Today’s data points: MPC member Broadbent speaks.
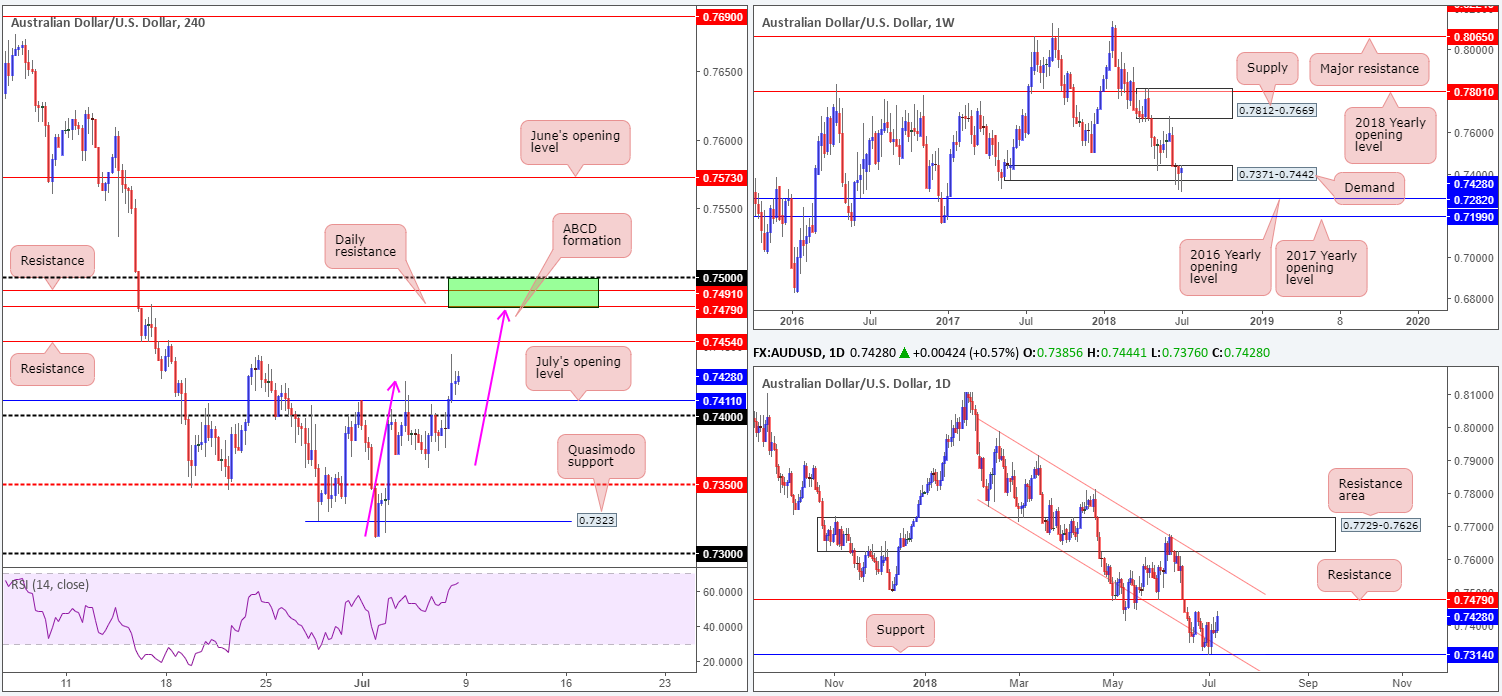
AUD/USD:
Weekly Gain/Loss: +0.34%
Weekly Closing price: 0.7428
Weekly perspective:
Despite dipping below demand at 0.7371-0.7442 for a third consecutive week in the shape of a bullish pin-bar formation, the area has somehow survived. Additional upside from this point may eventually lead to a retest of weekly supply priced in at 0.7812-0.7669, whereas a move to the downside has the 2016 yearly opening level at 0.7282 to target.
Daily perspective:
Support at 0.7314, alongside its closely associated channel support taken from the low 0.7758, has managed to remain firm. Continued buying from this region will see resistance at 0.7479 drift back into focus. Beyond here, the teams sees very little stopping the market from climbing to channel resistance penciled in from the high 0.7988.
H4 perspective:
The after effects of Friday’s US job’s report saw the commodity currency spike to highs of 0.7444, missing resistance at 0.7454 by a hair. Action was somewhat sedated following this, in spite of a near-test of June’s opening level as support seen at 0.7411, which is sited just north of the 0.74 handle.
Areas of consideration:
Longer term, it’s a struggle to get excited about buying this market with daily resistance seen nearby at 0.7479. In addition to this, the incessant breaking of weekly demand at 0.7371-0.7442 lends little confidence.
Intraday, what really jumps out at us is the green H4 zone marked between 0.75/0.7479 for possible shorts. Comprised of an ABCD (pink arrows) completion point, daily and H4 resistance levels and the 0.75 handle, this area has the ingredients to hold price lower, in our view.
Waiting for a H4 reversal candle to form (full or near-full-bodied) is advised before pulling the trigger, as this will likely help avoid being taken out on a fakeout through 0.75. As usual, stops are best placed above the rejection candle’s wick. In regard to take-profit levels, however, it’s difficult to pin-point an area without seeing the approach, but sufficed to say traders will likely be looking for the the H4 resistance at 0.7454 (support at that time) to be taken out before reducing risk to breakeven.
Today’s data points: Limited.
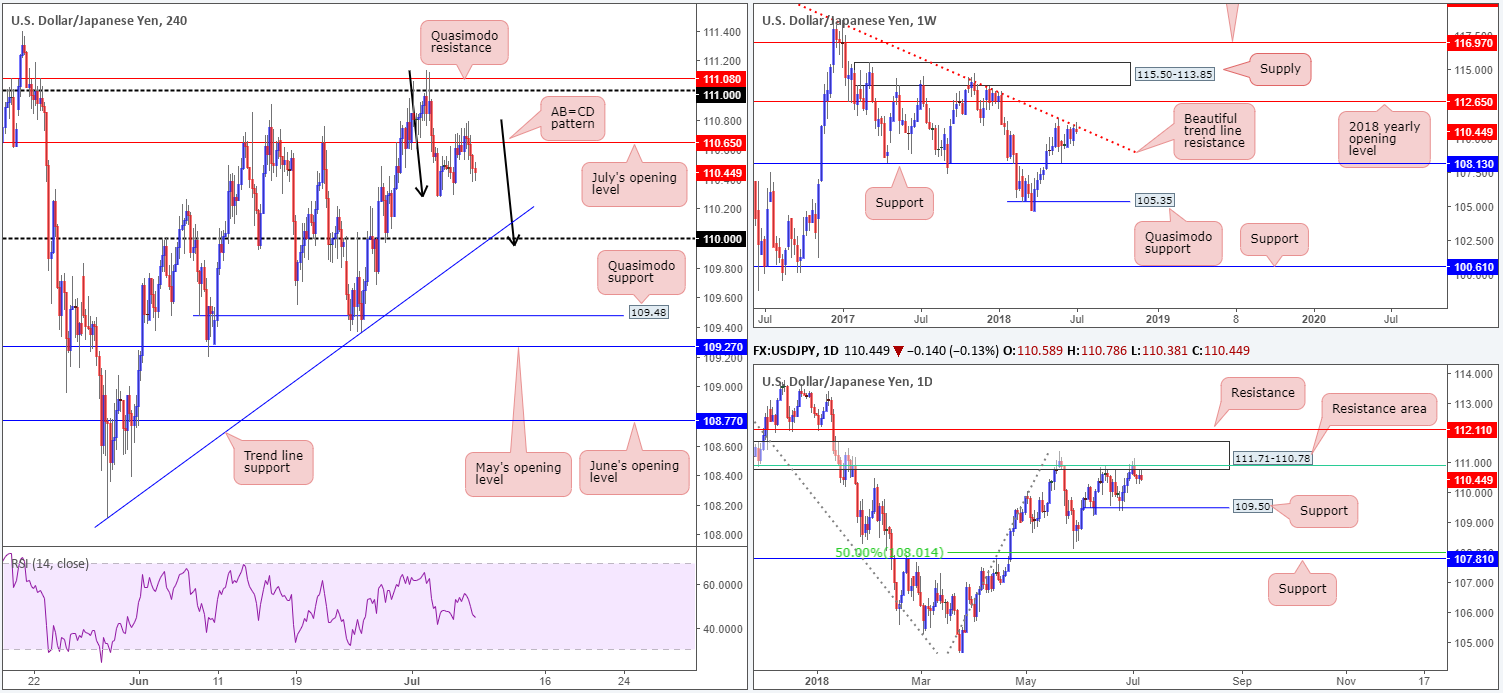
USD/JPY:
Weekly Gain/Loss: -0.19%
Weekly Closing price: 110.44
Weekly perspective:
Following a strong push north two weeks back, the unit engaged with a long-term trend line resistance taken from the high 123.57. Thus far, the sellers remain in the driving seat here and, in turn, could eventually lead to a test of weekly support coming in at 108.13. Also of interest on the weekly timeframe, particularly to candlestick enthusiasts, is the week ended forming a bearish pin-bar formation.
Daily perspective:
Bolstering the weekly trend line resistance is a daily resistance area seen at 111.71-110.78, which happens to house a 61.8% daily Fib resistance value at 110.91 (green line) within its limits. Note that the next downside target on the daily scale does not come into view until we reach the 109.50ish mark.
H4 perspective:
After spending the majority of Friday confined within a tight range around July’s opening level at 110.65, the pair came under fresh pressure on the back of the US employment report. The move lower brought to light a potential AB=CD formation that completes a few pips south of the 110 handle (black arrows), and nearby a trend line support etched from the low 108.12.
Areas of consideration:
All three timeframes suggest further selling could be on the cards this week.
With that being so, the team has noted to watch for H4 price to print a pullback to the upside (not to exceed July’s opening level) and chalk up a full or near-full-bodied bearish candle for a possible sell. Should this come to fruition, we’re confident this market has the gas to push at least for the 110 handle.
Today’s data points: BoJ Gov. Kuroda speaks.
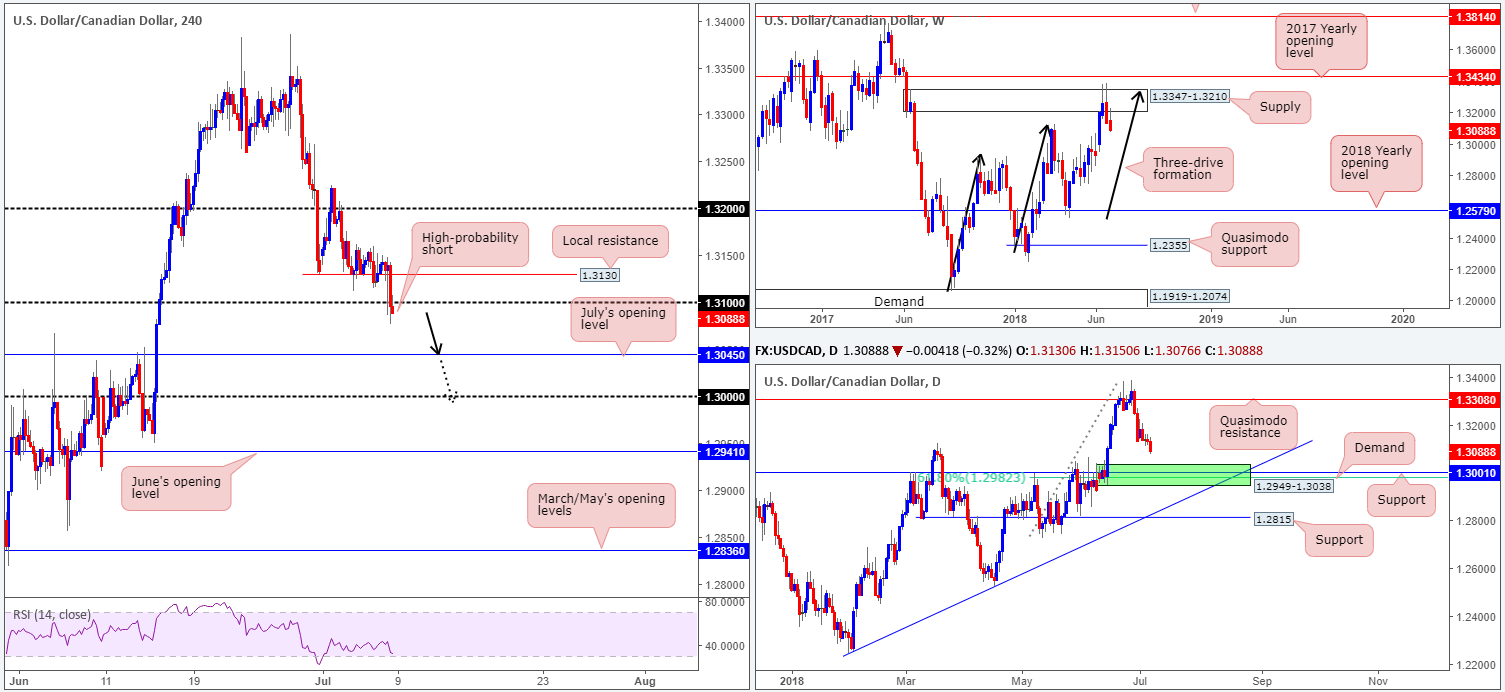
USD/CAD:
Weekly Gain/Loss: -0.37%
Weekly Closing price: 1.3088
Weekly perspective:
An aggressive bearish engulfing candle took shape two weeks back on this timeframe, which, as you can see, whipsawed through the top edge of a supply area at 1.3347-1.3210 and completed a three-drive approach (see black arrows). From a technical standpoint, this helped guide the USD/CAD lower last week. Areas of concern (support) are not really a problem on the weekly timeframe, in our opinion, until we reach the 2018 yearly opening level at 1.2579.
Daily perspective:
A closer look at price action, however, reveals strong support standing at 1.3001 (history dating back to Sept 2016), followed closely by a 61.8% Fib support value at 1.2982. On top of this, we can also see demand painted in green at 1.2949-1.3038 converging with these levels! Collectively, these areas are likely to hinder downside movement this week.
H4 perspective:
A mixed picture from both US and Canadian job’s data on Friday sent the USD immediately higher (seen clearer on the M30) off the 1.31 handle. The move, however, was a short-lived one as price action topped at 1.3147 before swiftly paring recent gains and ending the day printing a H4 close below 1.31.
According to the H4 scale, there’s little stopping the candles from extending losses today and testing July’s opening level based at 1.3045. A break beyond here will likely see the key figure 1.30 brought into play.
Areas of consideration:
As highlighted in last week’s reports, shorts in this market should only be considered on a H4 close beneath 1.31, targeting July’s opening level at 1.3045, followed then by 1.30 handle.
In light of Friday’s H4 close lower and retest that clearly airs a bearish tone, shorts off of Friday’s closing candle could be an option today (stops tucked above the candle’s rejection wick at 1.3108).
July’s opening level mentioned above at 1.3045 is considered the first port of call from here. A break of this level, nonetheless, will have us entering the jaws of the green daily demand highlighted above at 1.2949-1.3038. The ultimate target for shorts below 1.31, though, remains at the 1.30 handle.
Today’s data points: Limited.
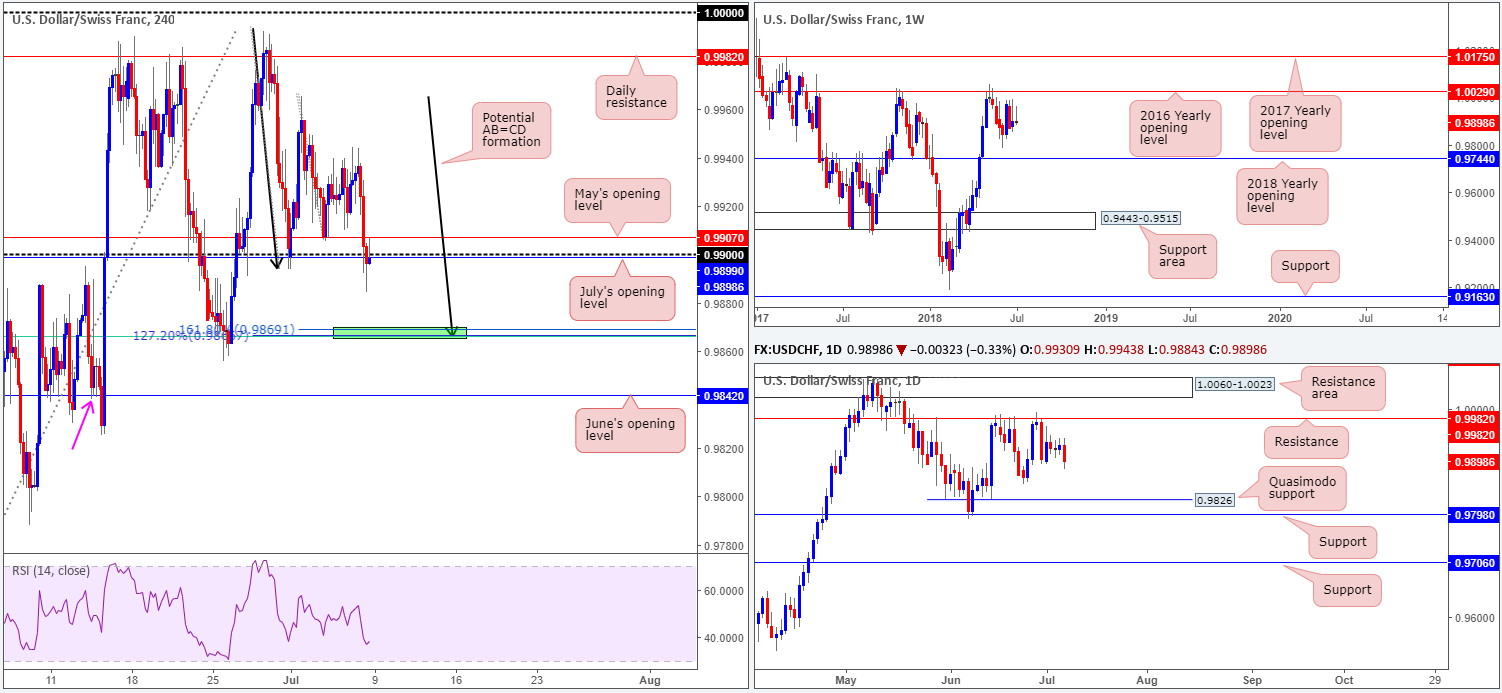
USD/CHF:
Weekly Gain/Loss: -0.08%
Weekly Closing price: 0.9898
Weekly perspective:
Over the past four weeks, the USD/CHF has been consolidating just south of the 2016 yearly opening level at 1.0029. Of interest on the weekly timeframe, however, was last week’s closing candle: a bearish pin-bar formation. Should this entice sellers into the market, the next downside target on the weekly scale falls in at the 2018 yearly opening level at 0.9744.
Daily perspective:
Resistance at 0.9982 continues to play a key role on the daily timeframe, holding price lower on two occasions in June. In terms of supportive structure, Friday’s decisive push lower places the focus on the Quasimodo support seen at 0.9826, shadowed closely by support at 0.9798.
H4 perspective:
The aftermath of Friday’s job’s report saw the USD/CHF plunge lower. Breaking through May’s opening level at 0.9907, and also the 0.99 handle, the pair concluded the day penciling in a bearish pin-bar formation at the underside of 0.99. Further downside from this point will see an AB=CD completion point come to life at around the 0.9868ish mark. We like this price area due to the tight combination of Fibonacci levels also present here:
- 61.8% Fib support at 0.9866.
- 127.2% Fib ext. point at 0.9866.
- 161.8% Fib ext. point at 0.9869.
Areas of consideration:
Intraday shorts at the underside of the 0.99 area are attractive today, given the limited support on the higher timeframes at the moment. Traders will, nonetheless, need to think about reducing risk to breakeven around 0.9868, due to the AB=CD completion which, in our view, has the minerals to force a retest of 0.99. Therefore, trade with caution.
A break beyond the AB=CD point, however, will force the needle to June’s opening level at 0.9842. This is special since it also represents a Quasimodo support as well, marked with a pink arrow.
Today’s data points: Limited.
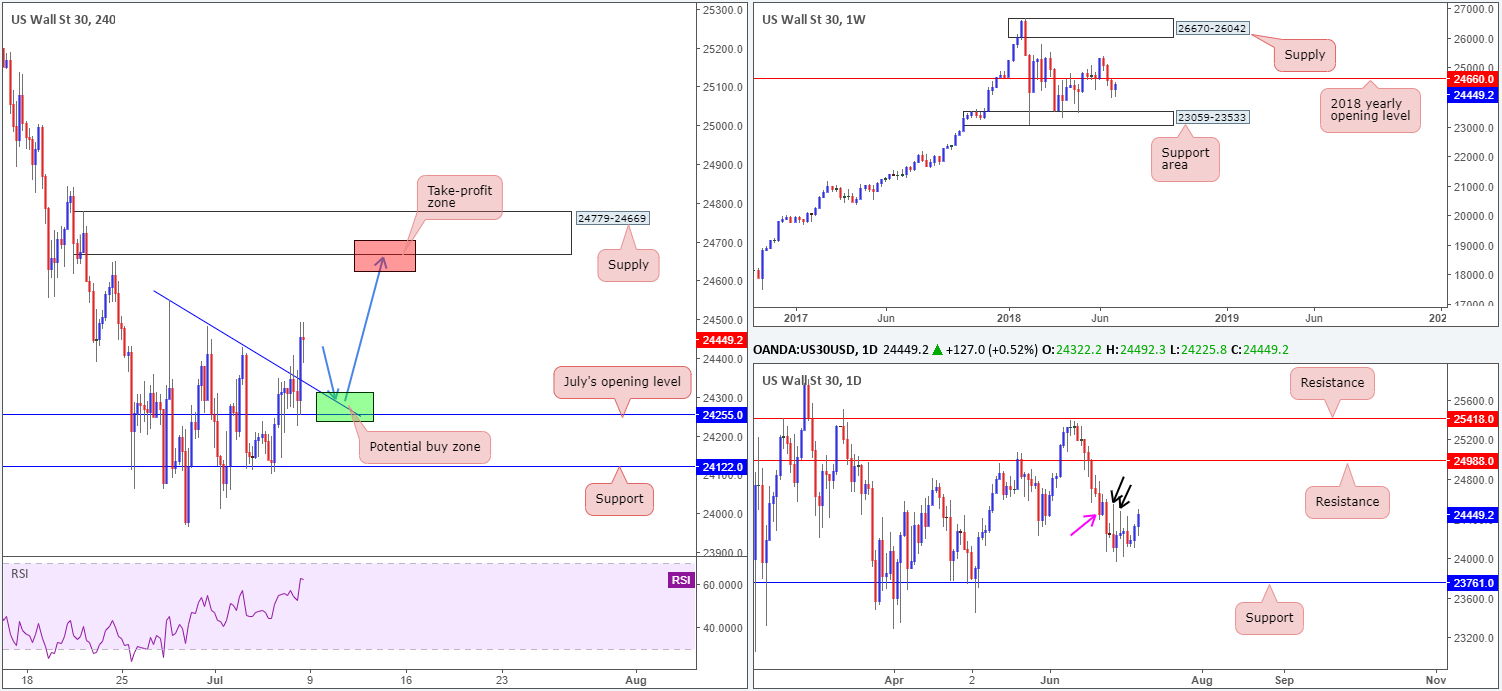
Dow Jones Industrial Average:
Weekly Gain/Loss: +0.74%
Weekly Closing price: 24449
Weekly perspective:
The index hit the brakes last week and reversed course, consequently breaking a three-week bearish phase. As is easily seen on the weekly timeframe, recent movement has positioned price action within striking distance of the 2018 yearly opening level at 24660. These yearly levels tend to offer a bounce, at the very least. So, don’t make the mistake of overlooking this barrier!
Daily perspective:
The story on the daily timeframe sees daily price position itself just ahead of supply coming in at 24649-24430 (marked with a pink arrow). Given this will be the third time back to this area (the first two are marked with black arrows), we feel there is weakness here and higher levels are likely on the cards. The next objective beyond the noted supply can be seen at resistance drawn from 24988.
H4 perspective:
Traders cheered Friday’s job’s report, following a to-the-point test of July’s opening level at 24255. The move higher broke through trend line resistance taken from the high 24549, reaching highs of 24492 on the day. Overhead, the team has noted the lack of active supply until we reach the 24779-24669. Therefore, further buying may be in store.
Areas of consideration:
With all three timeframes displaying potential to the upside, a retest of the recently broken H4 trend line and July’s opening level seen nearby at 24255 would be an ideal scenario to consider buying (blue arrows), targeting H4 supply mentioned above at 24779-24669 (positioned just north of the 2018 yearly opening level on the weekly timeframe).
Today’s data points: Limited.
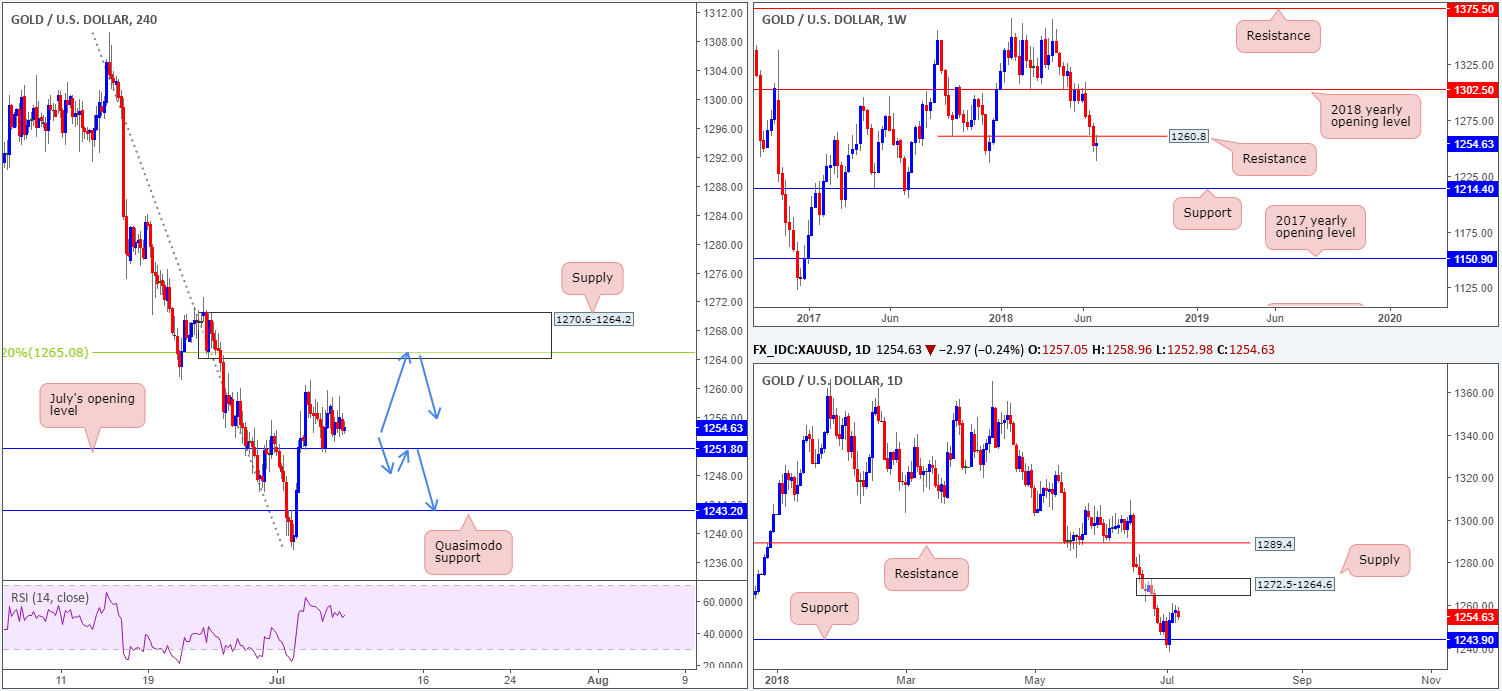
XAU/USD (Gold)
Weekly Gain/Loss: +0.18%
Weekly Closing price: 1254.6
Weekly perspective:
Although the yellow metal managed to eke out a modest gain last week, it wasn’t anything to write home about. Bullion tested the underside of a broken Quasimodo support at 1260.8 (now marked as resistance) and has so far held its ground. Additional selling from this level would place support at 1214.4 in the firing range this week.
Daily perspective:
A little lower on the curve, daily price established support around the 1243.9 mark in early trade last week, bringing the unit up to within touching distance of supply inked in at 1272.5-1264.6.
H4 perspective:
As is evident from the H4 timeframe, things have been particularly quiet since price broke above July’s opening level at 1251.8. Worth noting here is Thursday’s retest of July’s opening base as support, which although held firm, failed to produce much upside. Attempting to trade a second retest of this level – a third if you include the initial pullback after the break higher – is a chancy move, in our opinion, given the weekly picture. Overhead, however, it is still worth keeping eyes on supply at 1270.6-1264.2. What we like about this area is it houses a 38.2% Fib resistance value at 1265.0, and is encapsulated within daily supply at 1272.5-1264.6.
Areas of consideration:
According to our read, there is still a somewhat bearish vibe in this market right now. As such, the following scenarios are worth keeping eyeballs on today/early this week:
- Watch for H4 price to close beneath July’s opening level at 1251.8 and look to play the retest, targeting daily support at 1243.9/H4 Quasimodo support at 1243.2. Waiting for a H4 bearish candle (preferably full or near-full-bodied) to form to confirm the retest is an option.
- Potential shorting opportunities out of the H4 supply zone mentioned above at 1270.6-1264.2. In light of the confluence involved with this zone (see above in bold), trading this area without the need for additional candle confirmation is possible – stops placed above the top edge at 1270.6.