
Key risk events today:
Limited.
EUR/USD:
Weekly gain/loss: +0.41%
Weekly close: 1.1060
Weekly perspective:
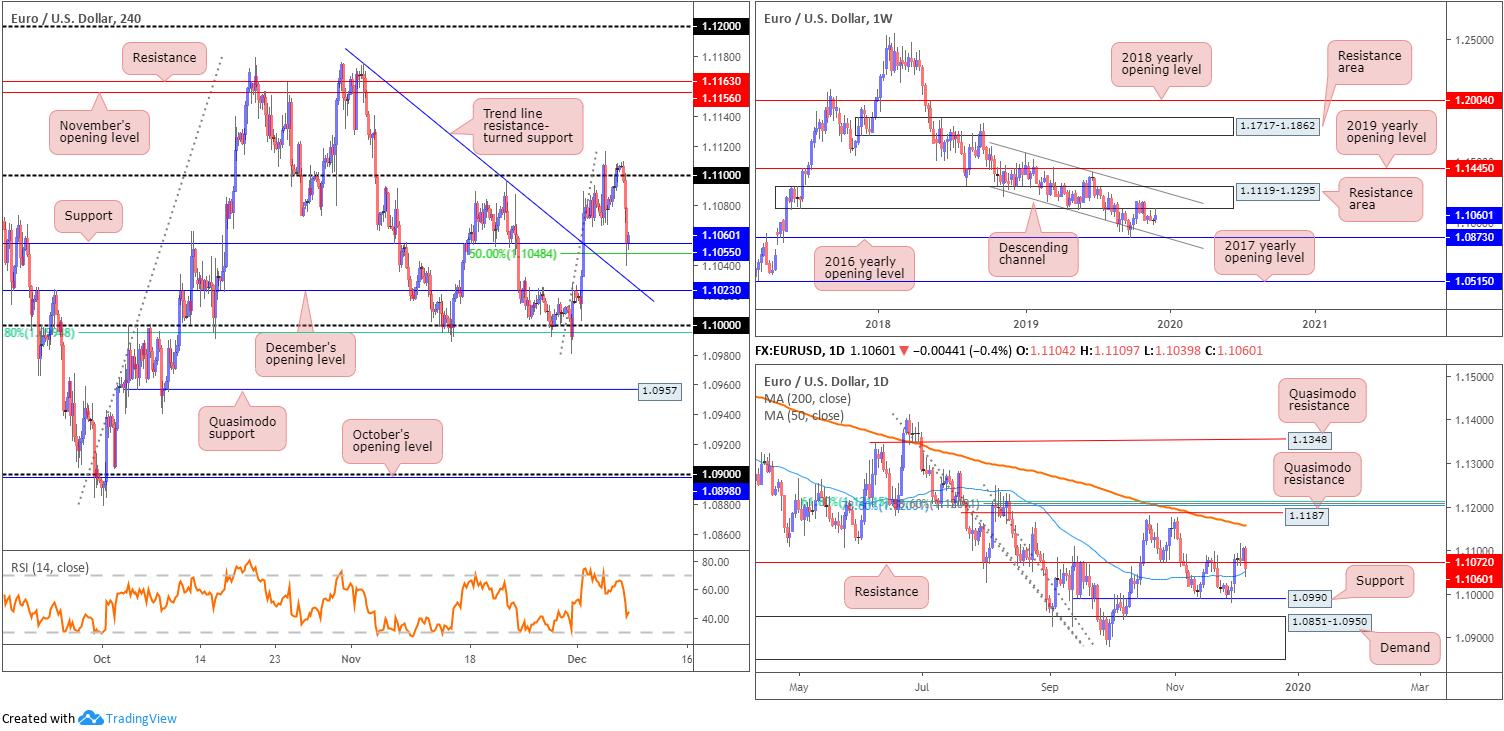
Since mid-October, long-standing resistance at 1.1119-1.1295 has capped upside. The beginning of November 2018 also saw the pair launch a descending channel, formed from a high set at 1.1569 and a low of 1.1109.
Further selling has the lower boundary of the descending channel to target, which happens to unite closely with the 2016 yearly opening level at 1.0873.
Concerning trend direction, the primary downtrend has been in motion since topping in early 2018 at 1.2555.
Daily perspective:
Mid-week trade witnessed support at 1.1072 reinforce price action, following a generous move higher at the start of the week. Although Thursday posted an inviting near-full-bodied bullish candle, buyers failed to respond as sellers strengthened their grip and reclaimed 1.1072 into the close.
The 50-day SMA (blue – 1.1051) offered mild support Friday, though should the line give way, support at 1.0990 lies in wait, closely shadowed by a muscular demand at 1.0851-1.0950.
H4 perspective:
Total non-farm payroll employment rose by 266,000 in November, and the unemployment rate was little changed at 3.5%, the US Bureau of Labour Statistics reported Friday. The labour force participation rate was little changed at 63.2% in November, and average hourly earnings ticked lower.
The after-affects of the recent employment data directed the buck higher, with the US dollar index, or DXY, reaching highs of 97.84. EUR/USD extended losses south of the 1.11 handle, drawing the candles towards support coming in at 1.1055, as well as the 50.0% retracement ratio at 1.1048. Note these H4 levels also benefit from converging with the 50-day SMA highlighted above on the daily timeframe. Beneath here, traders’ crosshairs are likely fixed on December’s opening value at 1.1023 that aligns closely with a trend line resistance-turned support, taken from the high 1.1173.
Areas of consideration:
Further upside off H4 support at 1.1055 is possible, though faces daily resistance set at 1.1072. H4 support at 1.1023 (December’s opening level) faces the same predicament. However, lower-timeframe intraday long entries off 1.1023 may still offer reasonable risk/reward, as the first upside target falls in at 1.1055.
The 1.10 handle on the H4 is also potentially of interest this week as support, given its alignment with a 61.8% Fibonacci retracement ratio at 1.0994 and daily support at 1.0990. Similarly, however, resistance is found close by at 1.1023.
GBP/USD:
Weekly gain/loss: +1.58%
Weekly close: 1.3131
Weekly perspective:
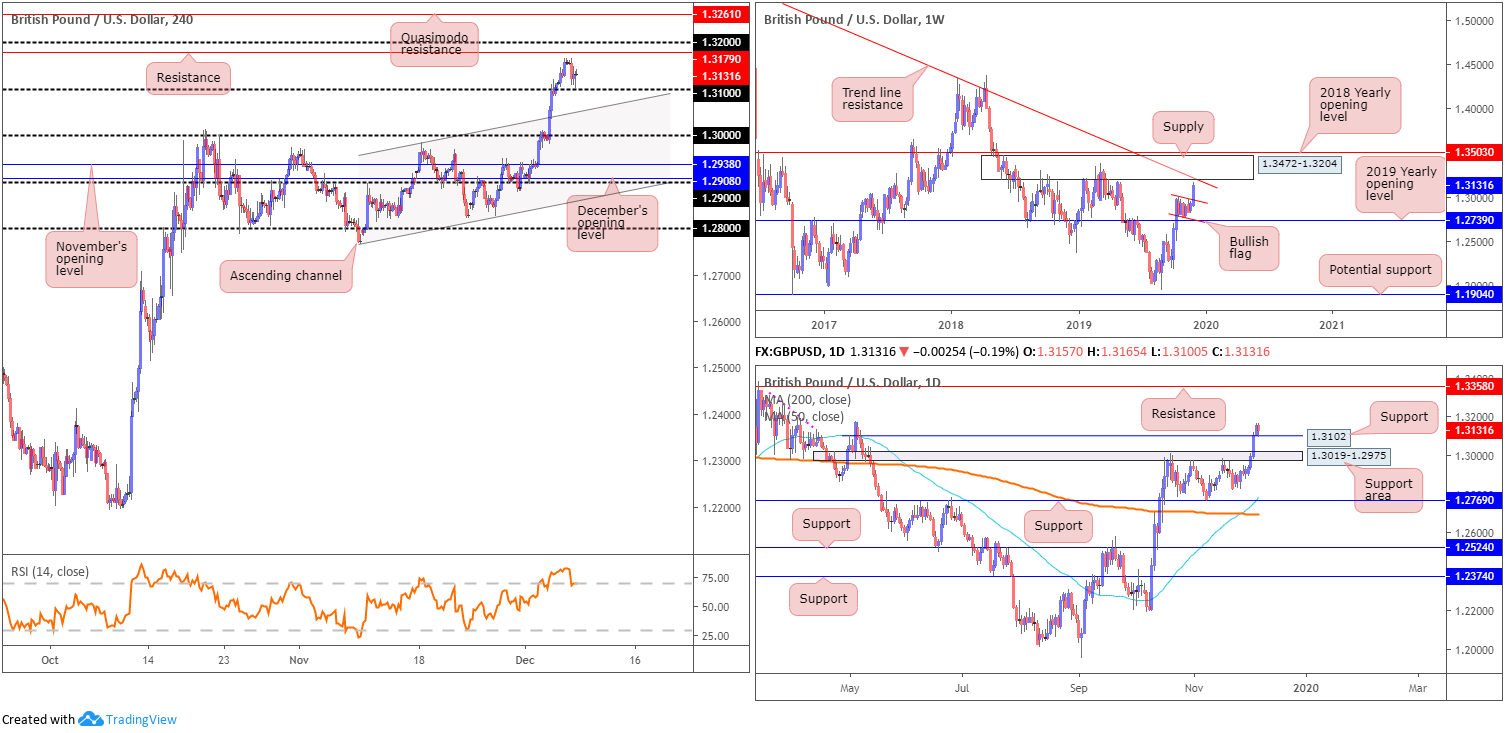
It was an upbeat week for sterling amid early-week impetus and sustained gains from the latest UK general election polls. Adding more than 200 points, weekly movement soared through the top edge of a bullish flag – formed just north of the 2019 yearly opening level 1.2739 – and landed a few points ahead of supply at 1.3472-1.3204, and long-term trend line resistance, etched from the high 1.5930.
Regarding the immediate trend, the market faces a downward trajectory from 1.4376, though a violation of the 1.3380 March 11 high shifts focus to the upside.
Daily perspective:
In view of GBP/USD bulls enhancing their position, the resistance area at 1.3019-1.2975 yielded ground, as did Quasimodo resistance at 1.3102 (both now acting supports). Interestingly, Friday’s action retested 1.3102 and formed a mild end-of-week correction. Continued bidding from this point has resistance at 1.3358 in sight. Note limited supply is seen on this timeframe between 1.3102/1.3358. The pink line plotted to the left of price denotes what appears to be consumed supply.
H4 perspective:
GBP/USD swiftly recovered NFP-induced losses late Friday, establishing support off the 1.31 handle in the shape of a H4 hammer pattern (considered a bullish signal at troughs). What’s also notable from a technical perspective is 1.31 blends with daily support underlined above at 1.3102.
Indicator-based traders witnessed the relative strength index (RSI) score a value of 82.30 last week, though concluded the session a touch beneath 70.00.
Resistance drawn from 1.3179, positioned close by the round number 1.32, may offer a ceiling this week. A break, nevertheless, exhibits scope for an approach towards Quasimodo resistance at 1.3261.
Areas of consideration:
The retest at 1.31 by way of a H4 hammer candlestick signal, coupled with daily support in motion at 1.3102 and weekly price displaying room to approach 1.3204 (the underside of weekly supply), highlights a buyers’ market today/early week.
An entry at current price is an option, with a protective stop-loss order plotted below 1.31. The initial upside target falls in at 1.3179, with 1.32 likely to uncover healthy selling, in view of its connection to weekly supply.
AUD/USD:
Weekly gain/loss: +1.18%
Weekly close: 0.6839
Weekly perspective:
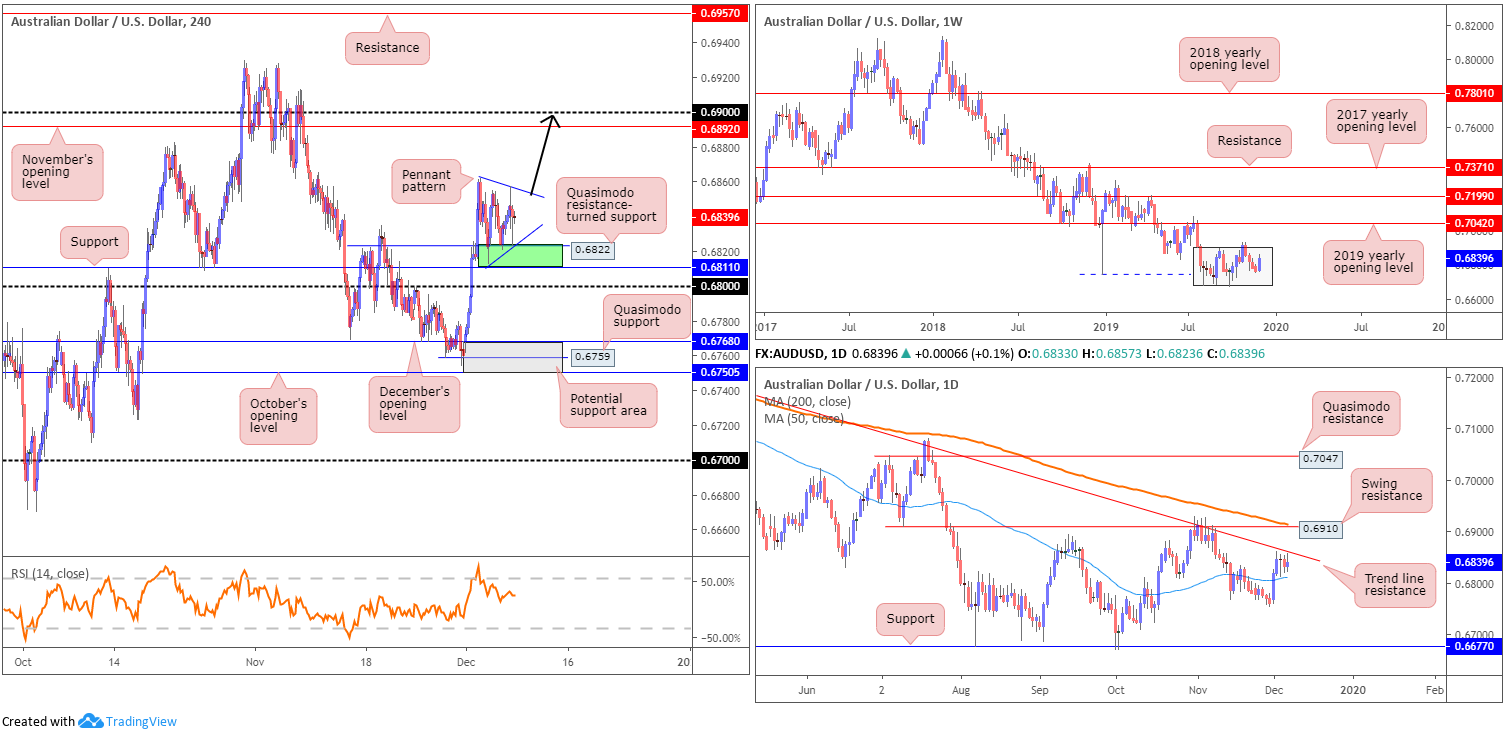
The Australian dollar firmed against the greenback in recent trading, reaching highs of 0.6862 and snapping a four-week losing streak.
Despite recent upside, the unit remains within the walls of its current range between 0.6894/0.6677 (light grey).
The primary downtrend, visible from this timeframe, has also been in play since early 2018.
Daily perspective:
Aside from Monday’s vigorous push north, which overthrew the 50-day SMA (blue – 0.6812), AUD/USD remained somewhat docile last week. This could have something to do with a nearby long-term trend line resistance, extended from the high 0.7393.
A break of the aforementioned trend line exposes swing resistance at 0.6910, merging closely with the 200-day SMA (orange – 0.6914). A violation of the said 50-day SMA this week, however, highlights the 0.6754 November 29 low, and notable support coming in at 0.6677.
H4 perspective:
Since Tuesday, H4 price has been busy carving out a pennant formation, formed from a high of 0.6862 and a low at 0.6813. Additional supportive structure is visible between 0.6811/0.6822 (green). Typically considered a continuation pattern, a breakout north of the current pennant may lead to an approach towards November’s opening level at 0.6892 and the 0.69 handle, followed by daily swing resistance at 0.6910. This area also marks the upper boundary of the weekly range at 0.6894, therefore traders can likely expect a pullback to occur here.
Areas of consideration:
The H4 pennant formation is possibly on the watchlists for many traders this week. A H4 close north of this pattern will draw in buyers, entering at the close of the candle. Conservative buyers, nonetheless, may opt to wait and see if the unit retests the broken flag as support before pulling the trigger. This allows for a tighter stop-loss order and increased risk/reward.
USD/JPY:
Weekly gain/loss: -0.85%
Weekly close: 108.55
Weekly perspective:
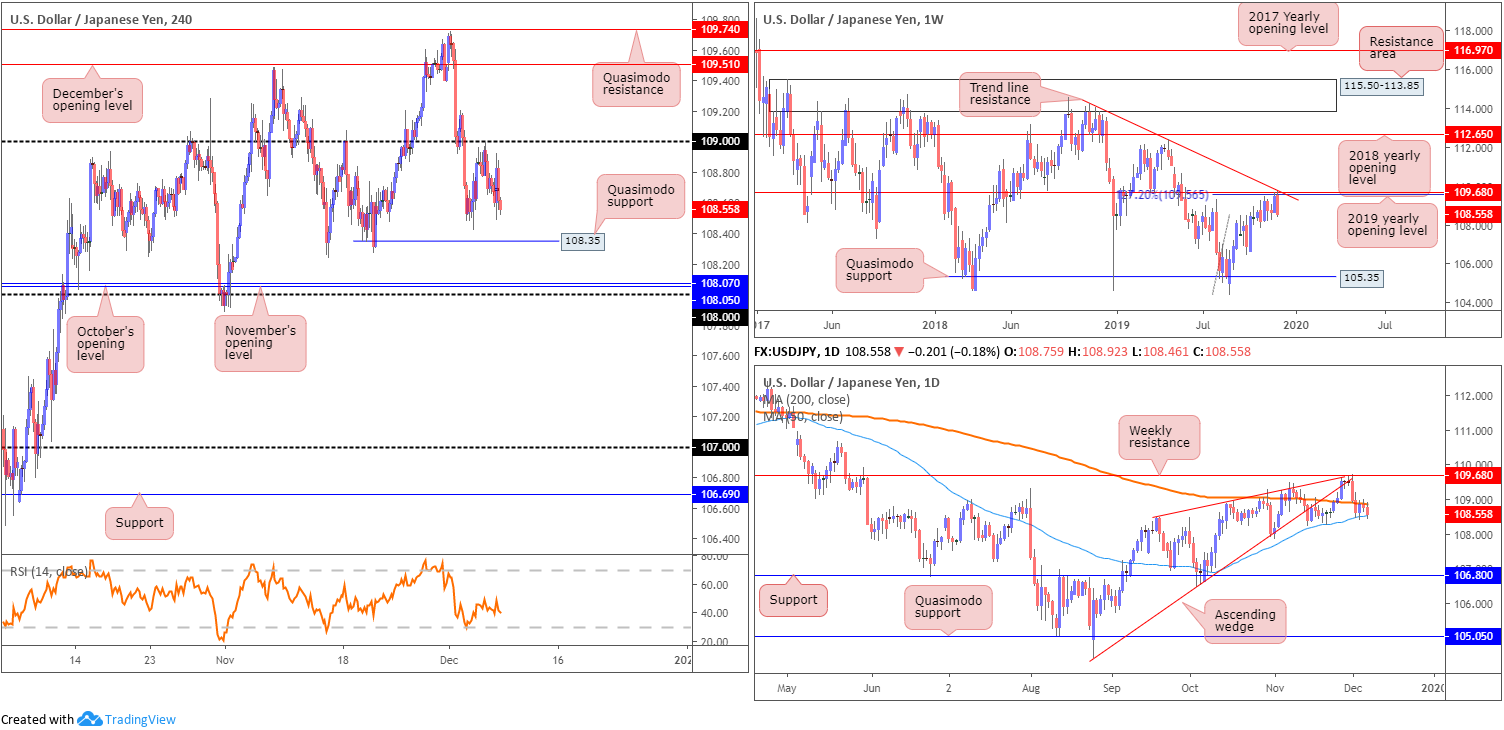
Shaped by way of a clear-cut bearish engulfing pattern, last week spun lower from resistance based on a 127.2% Fibonacci ext. point at 109.56 (taken from the low 104.44), resistance formed at 109.68, the 2019 yearly opening level and trend line resistance, extended from the high 114.23.
Aside from the 106.48 September 30 swing low, limited support is evident on the weekly timeframe until shaking hands with Quasimodo support at 105.35.
In regards to the market’s primary trend, the pair has been entrenched within a range since March 2017, spanning 115.50/105.35.
Daily perspective:
Following the strong move lower from the aforementioned weekly resistances, trade penetrated the 200-day SMA (orange – 108.85) and remains capped beneath this value. Support is seen close by in the form of the 50-day SMA (blue – 108.52).
Areas outside of this range can be seen around weekly resistance mentioned above at 109.68, and daily support coming in from 106.80.
H4 perspective:
The US dollar responded in healthy fashion against the Japanese yen, following Friday’s upbeat non-farm payrolls data. The move, nevertheless, was somewhat short lived, topping south of 109 at 108.92 and retreating to pre-announcement levels into the close.
USD/JPY flow remains steady, holding south of the 109 handle. Further selling from current price has Quasimodo support at 108.35 to target, closely shadowed by the 108 handle and November and October’s opening levels at 108.05 and 108.07, respectively. A move through 109, on the other hand, has December’s opening level in view at 109.51, as well as Quasimodo resistance at 109.74.
Areas of consideration:
Although weekly price suggests further losses could be on the cards, entering short in this market while daily price is in a phase of consolidation between the two said SMAs is likely to deter many traders. Once, or indeed if, a daily close south of the 50-day SMA occurs, technical selling will likely weigh on market movement. This could potentially be actionable this week.
H4 traders, however, may opt to wait until 108 gives way, as limited support is evident south of this barrier until shaking hands with 107. This also leaves ample room to reduce risk to breakeven and collect favourable risk/reward.
USD/CAD:
Weekly gain/loss: -0.19%
Weekly close: 1.3248
Weekly perspective:
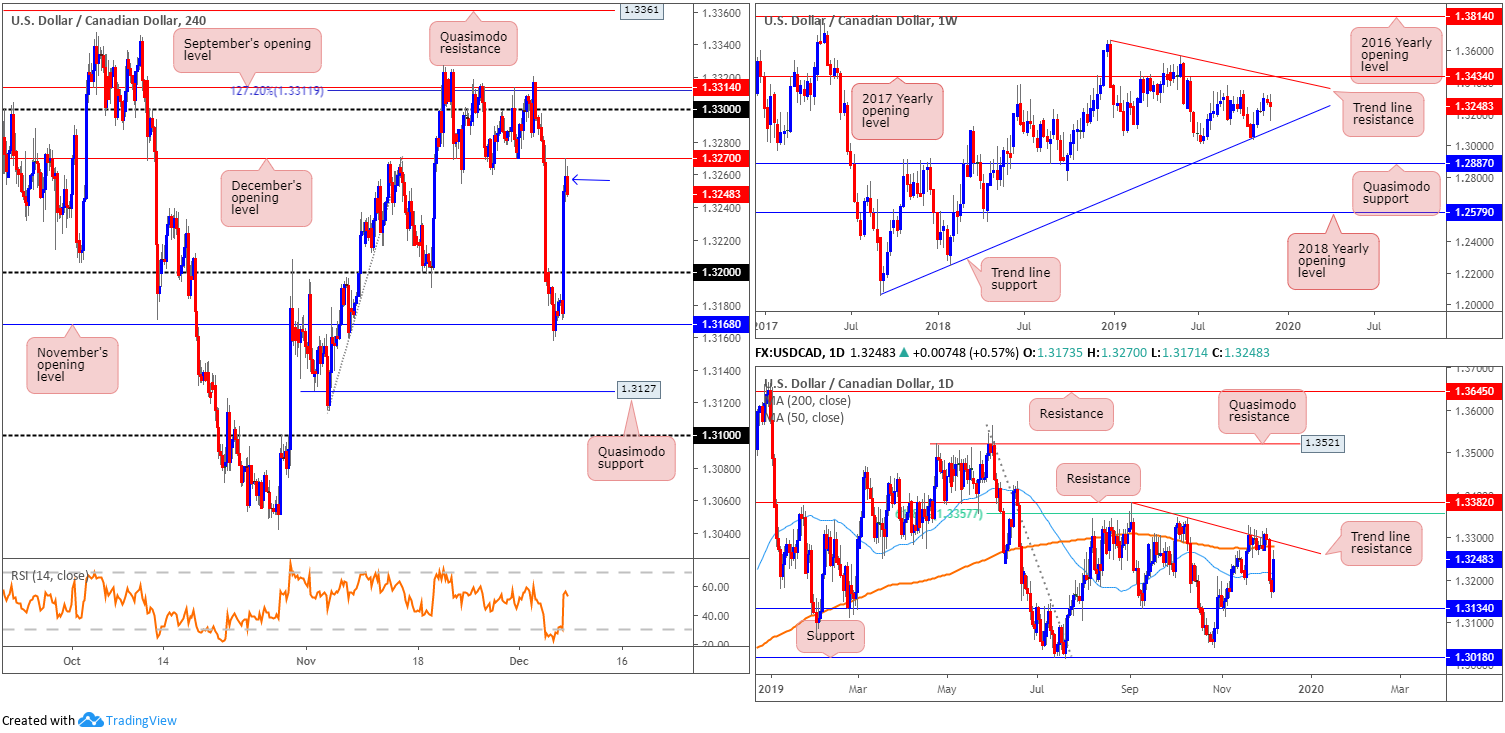
The key technical observation on the weekly timeframe consists of a trend line support, extended from the low 1.2061, tops around 1.3342, the 2017 yearly opening level at 1.3434 and a trend line resistance, taken from the peak at 1.3661. Overall, the immediate trend faces north since bottoming in September 2017, though this move could also be considered a deep pullback in a larger downtrend from the 1.4689 peak in early January 2016.
Daily perspective:
A closer reading of the daily timeframe has the unit stationed below a local trend line resistance, extended from the high 1.3382. Interestingly, the 200-day SMA (orange – 1.3278) is also seen converging closely with the descending line. A few points south of price, we have the 50-SMA (blue – 1.3215) that may offer support this week, closely followed by another layer of support at 1.3134.
At the same time, a break north could lead to an approach towards a 61.8% Fibonacci retracement value at 1.3357, followed by resistance at 1.3382.
H4 perspective:
Stellar US employment data, along with weak oil prices and dismal Canadian job’s figure, sparked a healthy wave of buying Friday. Forcefully overthrowing the 1.32 handle, the day added more than 70 points and tested the underside of December’s opening level at 1.3270.
Although H4 structure exhibits scope to press lower until reaching 1.32, daily price has the 50-day SMA circling around 1.3215.
Areas of consideration:
Based on the to-the-point reaction off December’s opening level at 1.3270 which formed a reasonably notable H4 bearish candle (blue arrow), short sellers will likely be attempting to sell this market today. While the trade may very well reach the 50-day SMA, the threat of a fakeout above 1.3270 to the 200-day SMA may just be too chancy for some, particularly seeing as it converges with daily trend line resistance.
USD/CHF:
Weekly gain/loss: -0.97%
Weekly close: 0.9898
Weekly perspective:
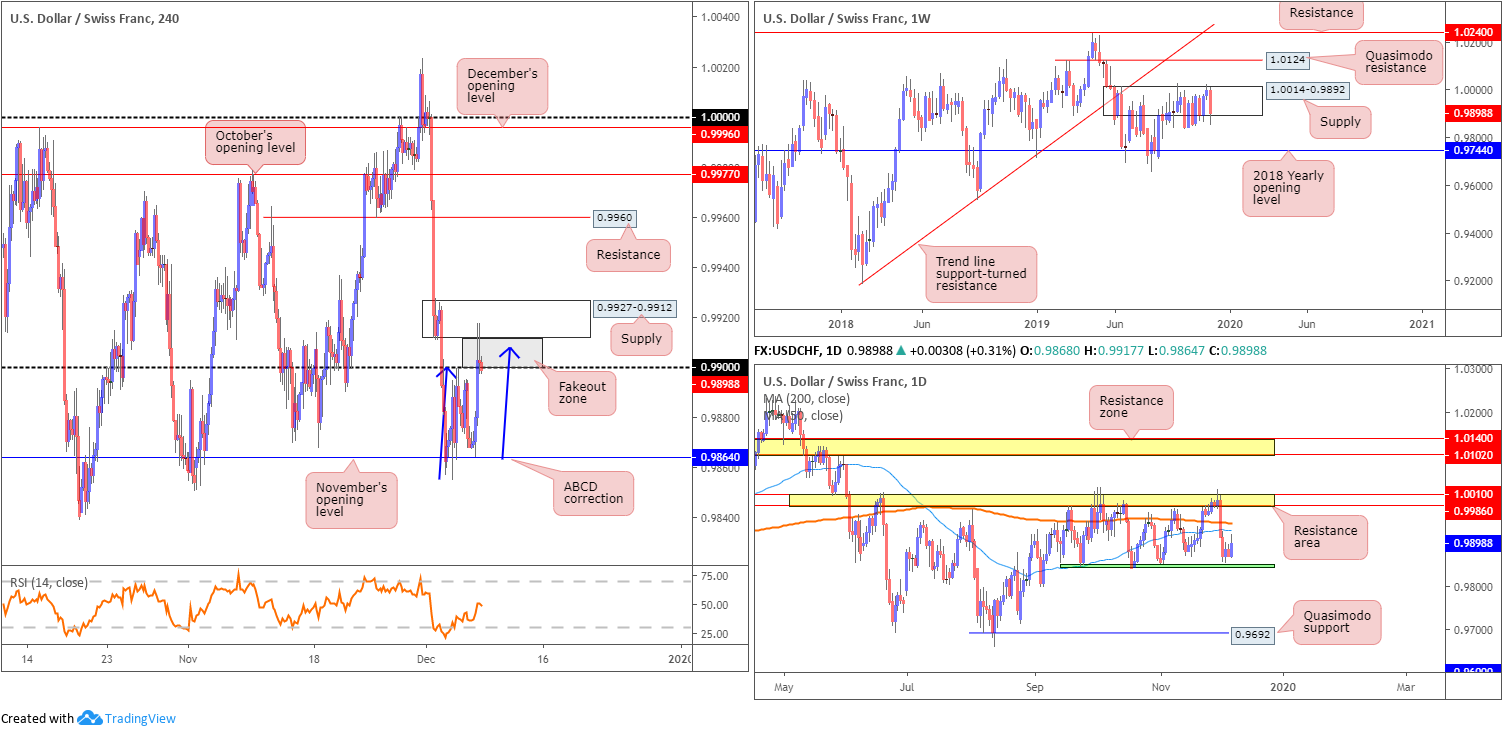
Although yielding nearly 100 points on the week, USD/CHF longer-term flow remains consolidating within the walls of a supply zone at 1.0014-0.9892.
A move higher from here has Quasimodo resistance at 1.0124 in sight, followed by resistance at 1.0240 and trend line support-turned resistance, extended from the low 0.9187. To the downside, nevertheless, the 2018 yearly opening level awaits at 0.9744.
According to the primary trend, price also reflects a slightly bullish tone.
Daily perspective:
Since mid-September, daily price has been busy carving out a consolidation between support around the 0.9845ish region (green) and a resistance area at 1.0010/0.9986. Last week saw the unit settle nearby the lower end of the said range, with Friday gathering traction and reaching a session high of 0.9917.
H4 perspective:
Better-than-expected US employment data prompted a run through orders at 0.99 into fresh supply coming in at 0.9927-0.9912.
Traders who read Friday’s technical briefing may recall the following piece:
A H4 fakeout zone is present between the round number 0.99 and H4 supply at 0.9927-0.9912. It is common knowledge stop-loss orders congregate around psychological levels. Therefore, a break through 0.99 will trip buy stops from not only sellers attempting to fade 0.99, but also those attempting to catch the breakout. This provides liquidity for bigger players to sell into from the noted supply and bring price lower. As such, the current supply area remains a worthy contender for any technician’s watchlist.
Areas of consideration:
Well done to any readers who managed to take advantage of the reaction out of H4 supply at 0.9927-0.9912.
Friday concluded marginally south of 0.99, which could prompt a continuation to the downside today, targeting November’s opening level at 0.9864. What also occurred, and likely added to the move from supply, was the completion of a H4 ABCD drive (blue arrows) at 0.9908.
Beyond 0.9864, traders will likely have their crosshairs fixed on the lower edge of the daily range at 0.9845 as the next support target.
Dow Jones Industrial Average:
Weekly gain/loss: -0.17%
Weekly close: 28026
Weekly perspective:
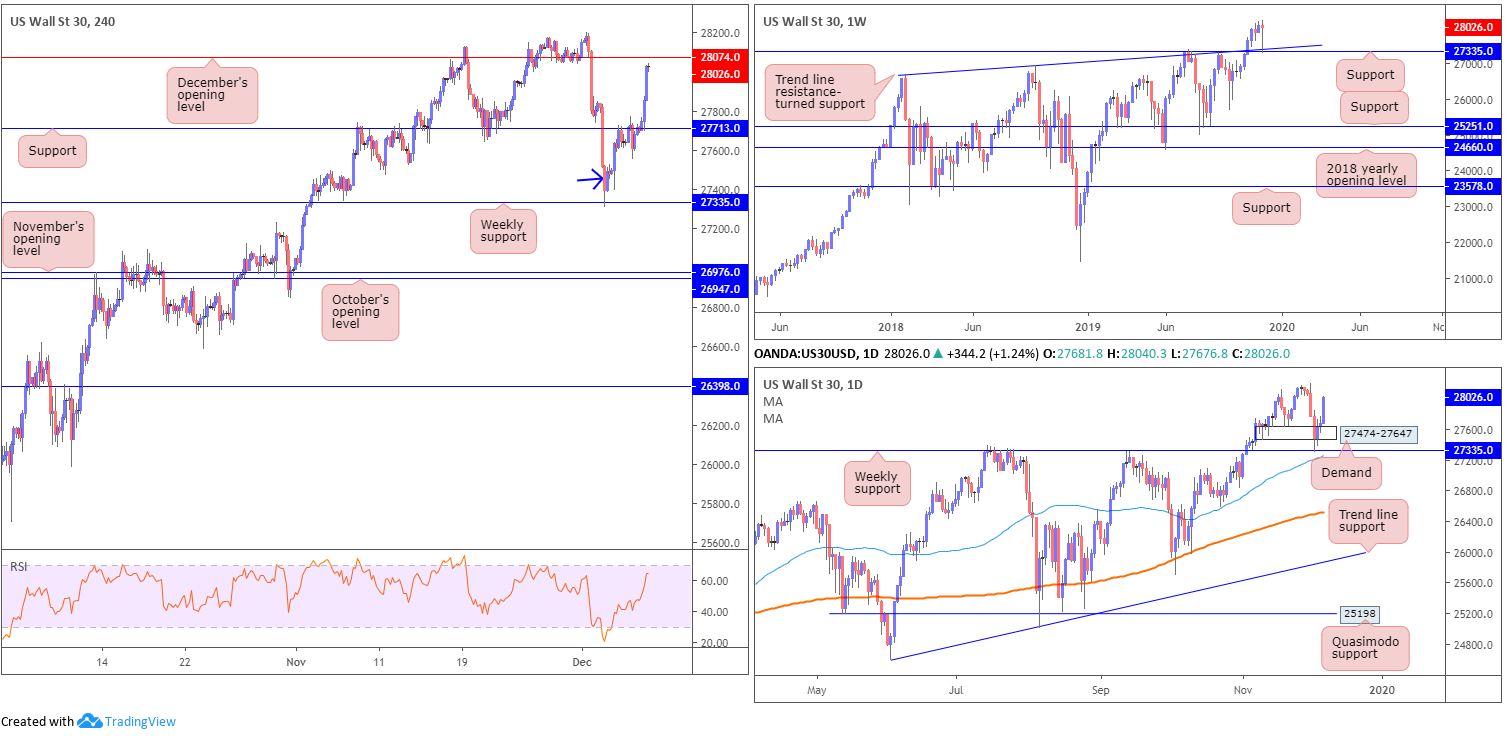
Despite wrapping up the week in negative terrain, traders are left with a strong weekly hammer candlestick formation (considered a strong buy signal at troughs), formed at the retest of support drawn from 27335, along with trend line support etched from the high 26670.
Daily perspective:
Lower on the curve, daily demand at 27474-27647 suffered a raw whipsaw in recent movement, consequently tripping sell stops. As you can see, price action drove through orders at the said demand to collect weekly buyers at the noted support level, and lifted higher mid-week onwards.
H4 perspective:
US equities recovered from a minor slide Friday, as investors cheered strong non-farm payrolls data. The Dow Jones Industrial Average added 337.27 points, or 1.22%; the S&P 500 advanced 28.48 points, or 0.91% and the tech-heavy Nasdaq 100 added 88.97 points, or 1.07%.
Traders who read some of the recent technical reports may recall H4 price forming an inside candlestick formation (blue arrow) last Tuesday, based off weekly support mentioned above at 27335.
Areas of consideration:
Well done to any readers who managed to jump aboard the H4 inside candlestick pattern. Traders likely reduced risk to breakeven around H4 resistance at 27713 (now acting support), and are perhaps looking to liquidate a portion of their position at December’s opening level drawn from 28074 today/early week.
A break of 28074 confirms a likely attack at all-time highs 28199, which, for traders still long this market, would be a welcomed sight no doubt.
XAU/USD (GOLD):
Weekly gain/loss: -0.24%
Weekly close: 1460.0
Weekly perspective:
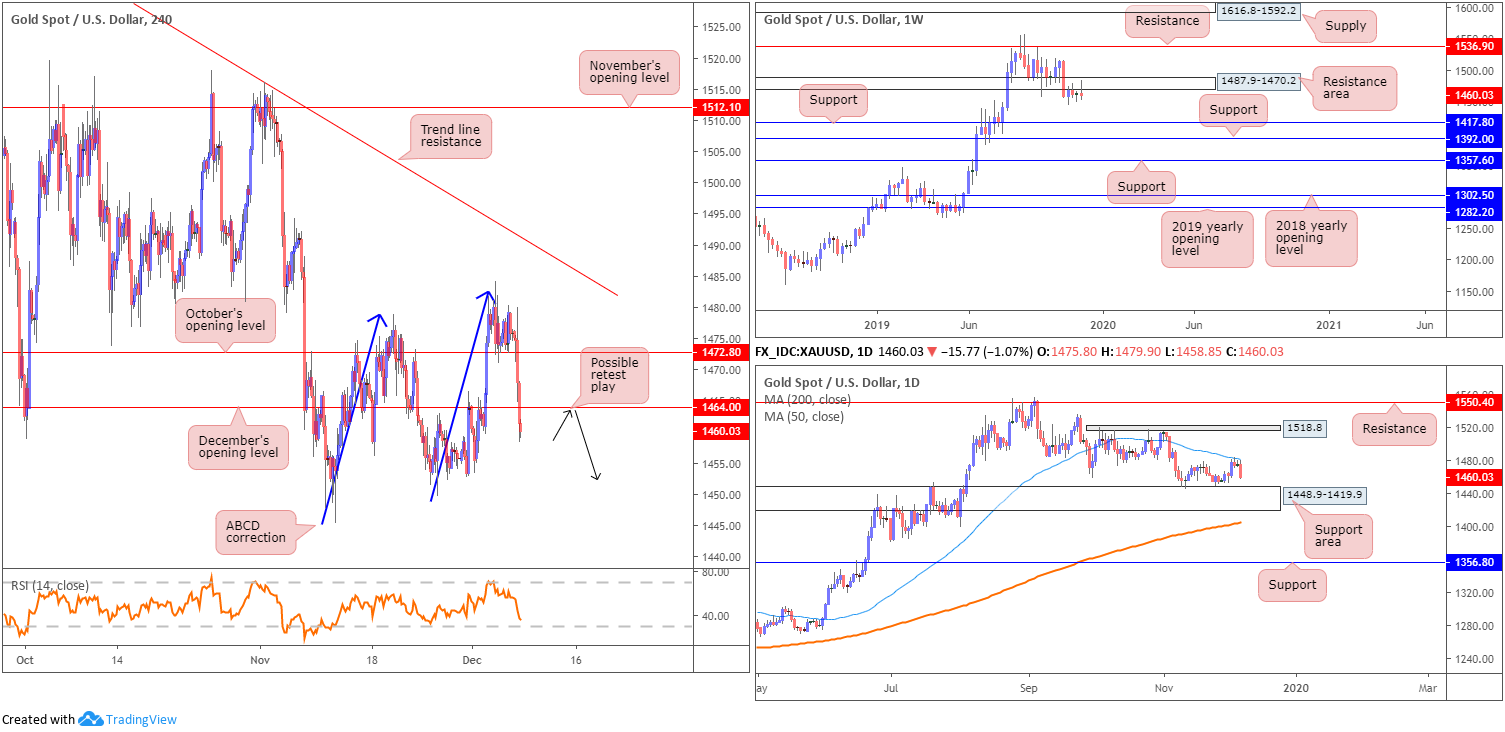
After scoring a fresh weekly high at 1484.1, XAU/USD spot rotated southbound and finished the week marginally in negative terrain. As evident from the weekly timeframe, price action maintains a position south of the resistance area at 1487.9-1470.2. Further rejection off the underside of this base potentially sets the long-term stage for a move towards two layers of support at 1392.0 and 1417.8, whereas a break north could approach resistance at 1536.9.
Overall, the primary trend has faced a northerly trajectory since bottoming in early December 2015.
Daily perspective:
Daily movement reveals price tested the underside of a 50-day SMA (blue – 1481.4) mid-week and explored lower ground Friday. This follows a rebound from nearby support area coming in at 1448.9-1419.9, which may hinder further downside this week.
Should buyers overthrow the said SMA, tops sited around the 1518.8 point are in view.
H4 perspective:
The impact of Friday’s upbeat non-farm payrolls data guided the price of gold strongly lower against its US counterpart. Collectively, price tunnelled through October and November’s opening level at 1472.8 and 1464.0, respectively, and clocked a session low at 1458.8. Interestingly, Wednesday’s peak 1484.1 not only crossed swords with the 50-day SMA mentioned above on the daily timeframe, H4 price completed a nice-looking ABCD (blue arrows) correction at 1482.7.
Areas of consideration:
With room to navigate lower ground on the weekly timeframe, and daily price showing a small pocket of free movement to the support area at 1448.9-1419.9, a H4 retest at the underside of December’s opening level at 1464.0 could be seen today/early week.
An ideal scenario would be for H4 price to retest 1464.0 and produce a bearish candlestick configuration. This not only helps identify seller intent, it also provides traders entry and risk levels to use.
The accuracy, completeness and timeliness of the information contained on this site cannot be guaranteed. IC Markets does not warranty, guarantee or make any representations, or assume any liability regarding financial results based on the use of the information in the site.
News, views, opinions, recommendations and other information obtained from sources outside of www.icmarkets.com.au, used in this site are believed to be reliable, but we cannot guarantee their accuracy or completeness. All such information is subject to change at any time without notice. IC Markets assumes no responsibility for the content of any linked site.
The fact that such links may exist does not indicate approval or endorsement of any material contained on any linked site. IC Markets is not liable for any harm caused by the transmission, through accessing the services or information on this site, of a computer virus, or other computer code or programming device that might be used to access, delete, damage, disable, disrupt or otherwise impede in any manner, the operation of the site or of any user’s software, hardware, data or property.


