
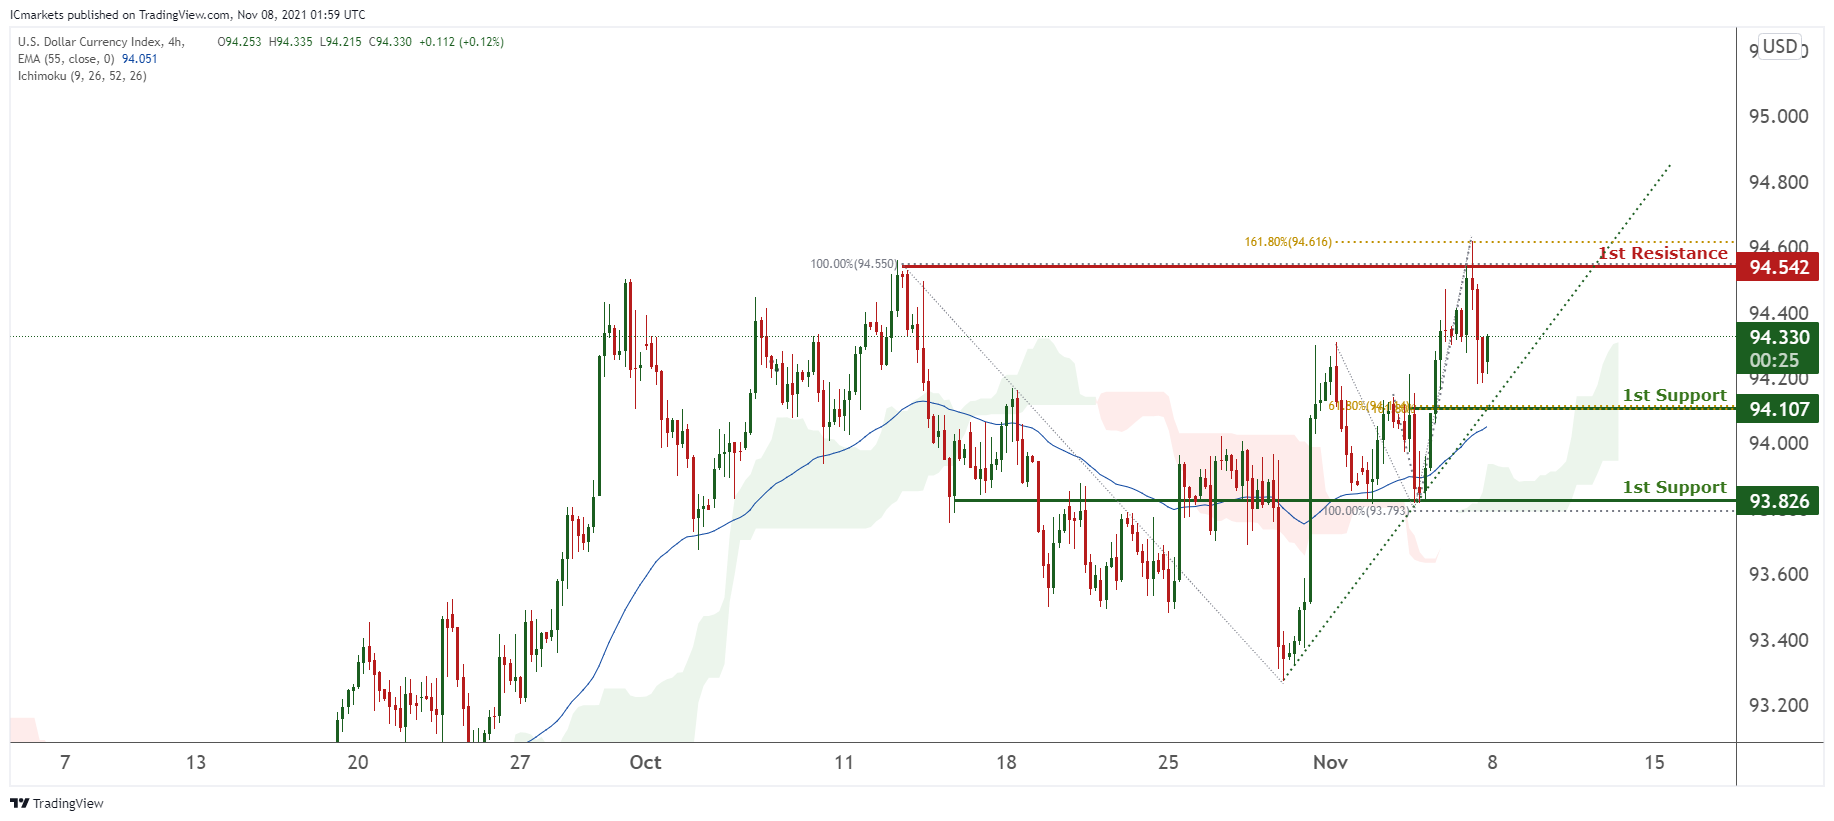
DXY:
On the H4 timeframe, prices are on a bullish momentum. Prices to test our 1st support at 94.107 in line with 61.8% Fibonacci retracement and bullish trendline and bounce towards our 1st resistance at 94.542. Technical indicators are showing bullish momentum. Alternatively, if prices breaks 1st support, it may dip towards our 2nd support at 93.826 in line with 100% Fibonacci retracement.
Areas of consideration:
● H4 time frame, 1st resistance at 94.542
● H4 time frame, 1st support at 94.107
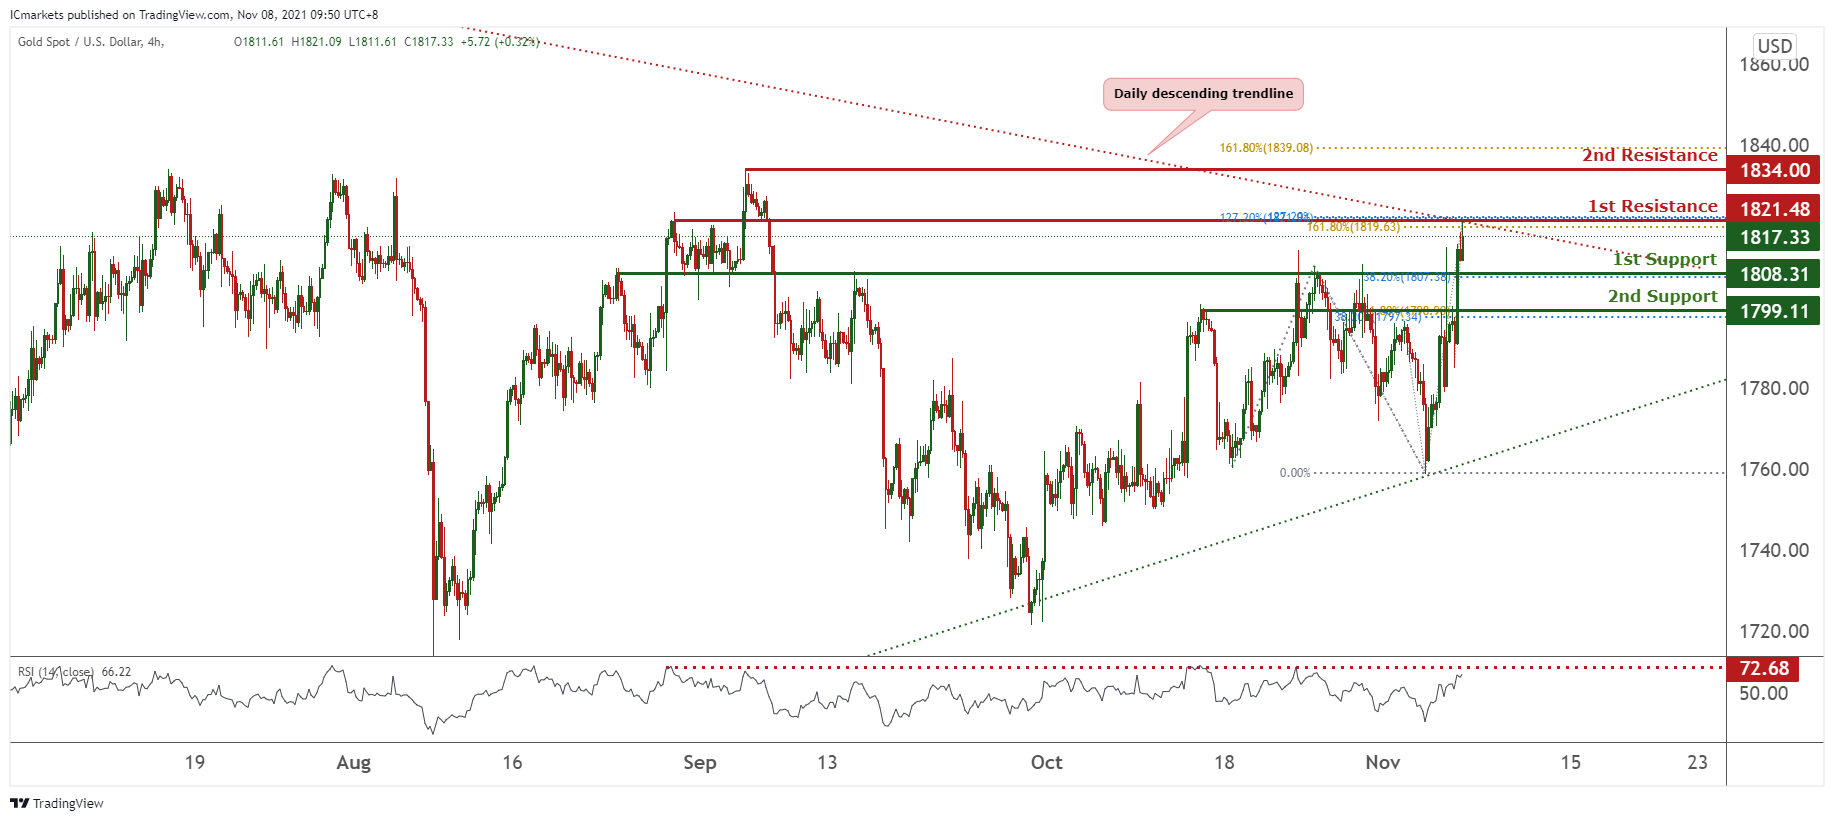
XAU/USD (GOLD):
On the H4 chart, prices are abiding to a daily triangle. We see potential for prices to dip from our 1st resistance at 1821.48 in line with 161.8% and 127.2% Fibonacci extension towards our 1st support at 1808.31 in line with 38.2% Fibonacci retracement. Technical indicators are showing bearish momentum. Alternatively, if prices surpasses our 1st resistance, it may climb higher towards our 2nd resistance at 1834 in line with 161.8% Fibonacci extension.
Areas of consideration:
● 4h 1st support at 1808.31
● 4h 1st resistance at 1821.48
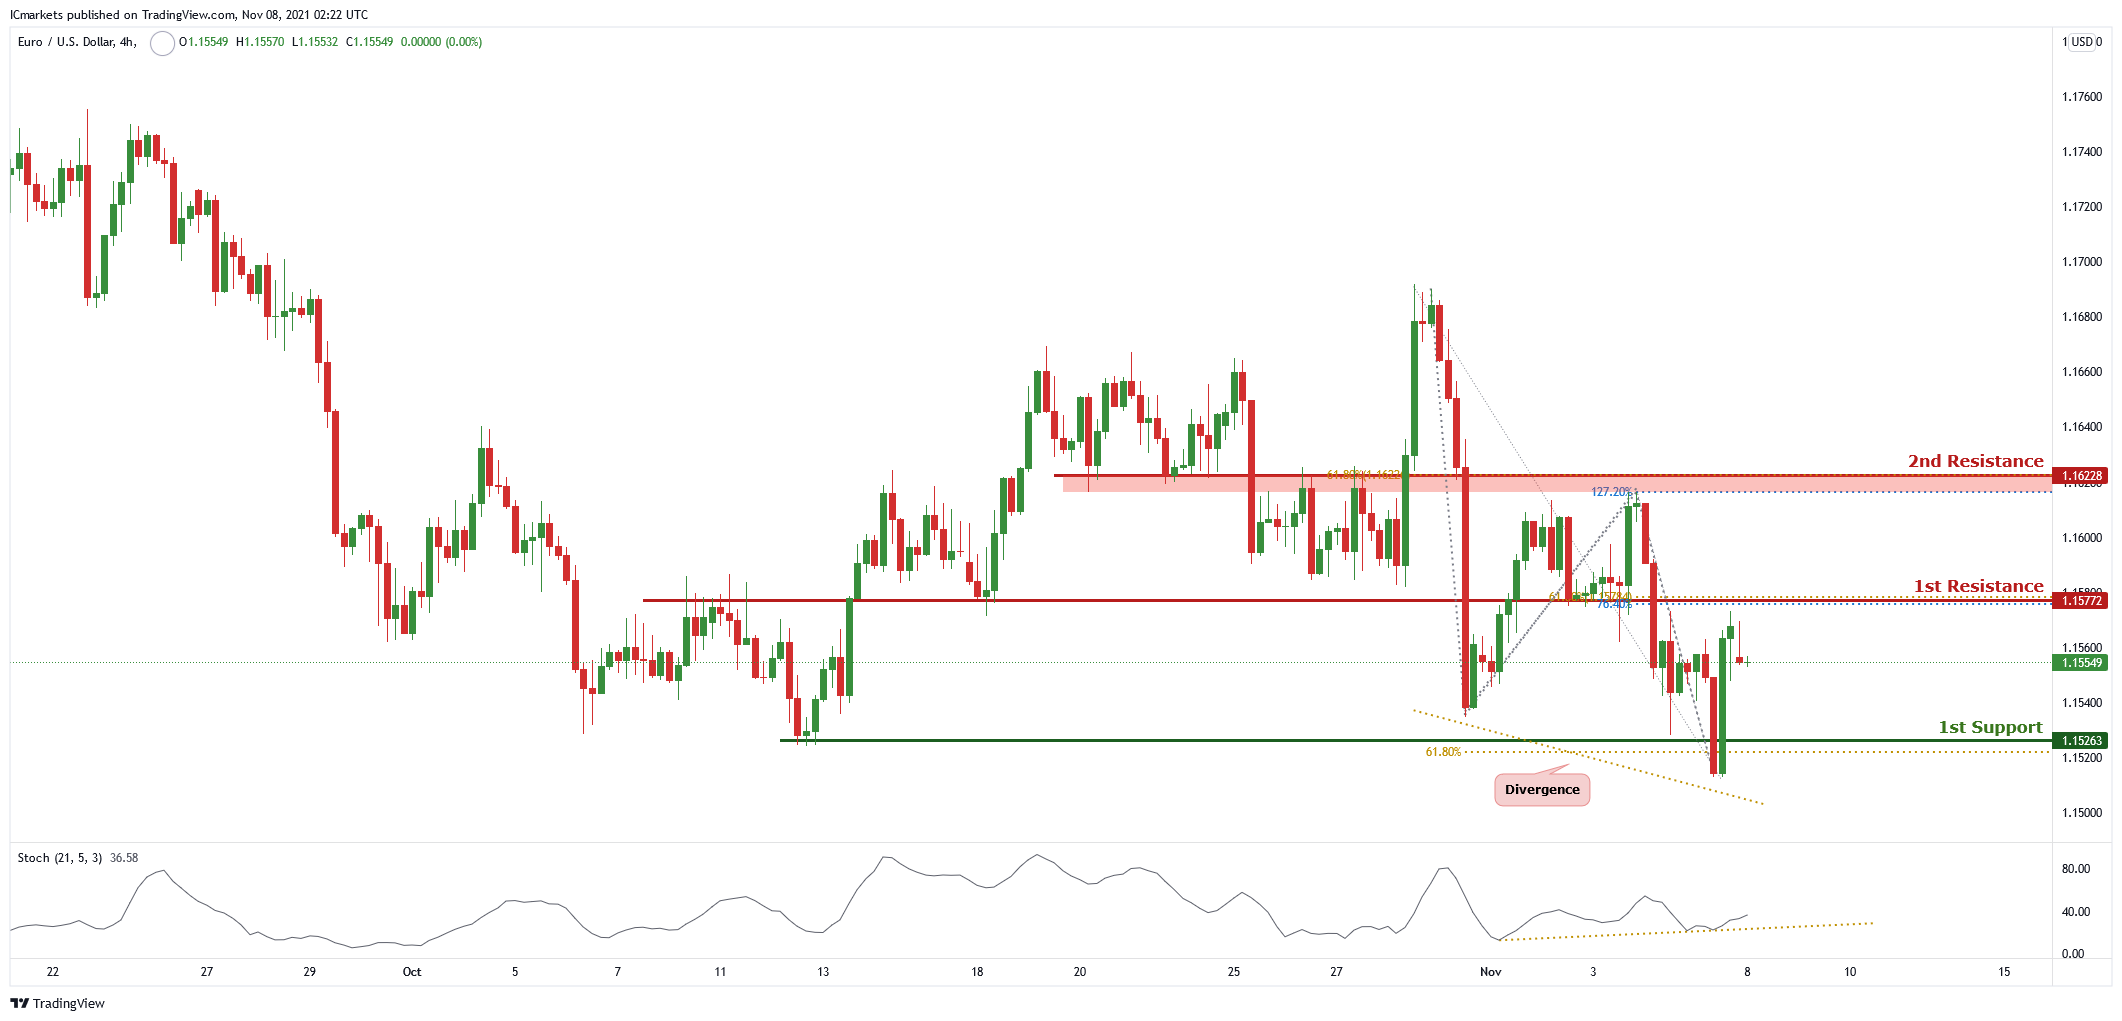
EUR/USD:
On the H4 chart price is near the first resistance level of 1.15772 which is also 61.8% Fibonacci retracement and 78.6% Fibonacci projection. Price can potentially go to the 2nd resistance which is also 127.2% Fibonacci projection and 61.8% Retracement. Our bullish bias is supported by the RSI indicator which shows a divergence. Alternatively, price can also dip to the first support level of 1.15263 which is also 61.8% Fibonacci projection.
Areas of consideration:
H4 first support – 1.15263
H4 first resistance – 1.15772
H4 second resistance – 1.16228
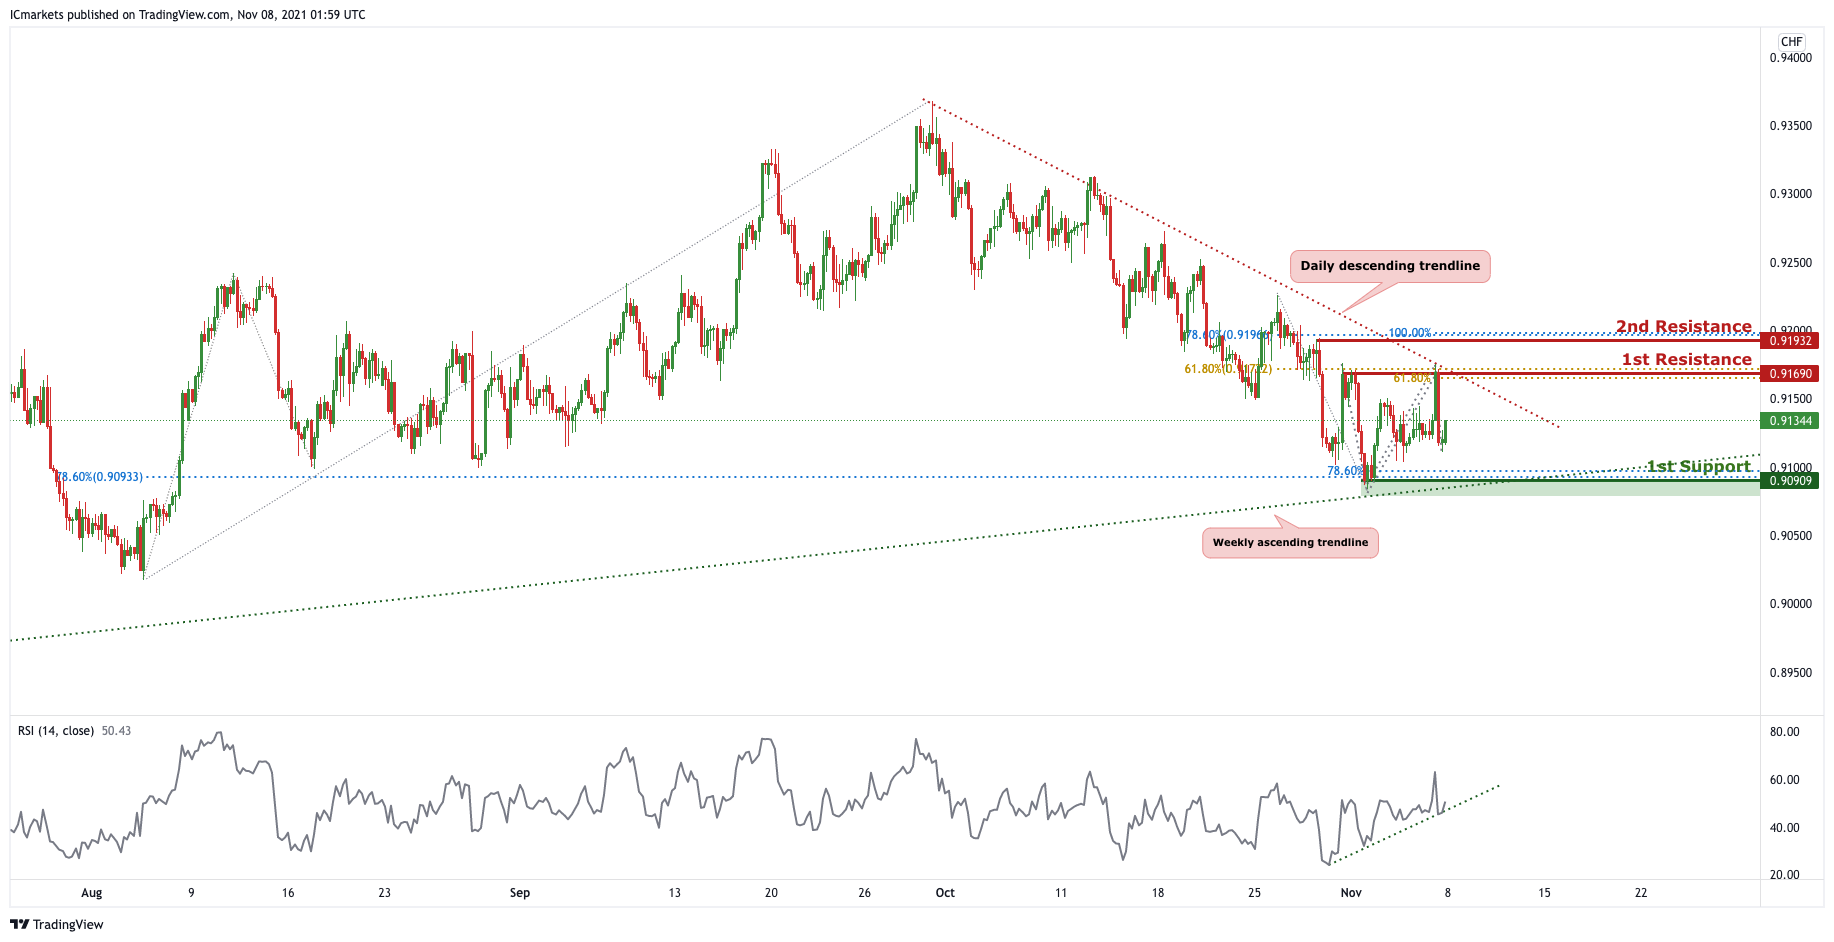
USD/CHF:
On the H4 timeframe, price is now abiding to a descending trendline resistance, signifying bearish momentum. We can now expect price to make a drop from the 1st resistance in line with 61.8% Fibonacci retracement and 61.8 % Fibonacci projection towards the 1st Support in line with 78.6% Fibonacci projection and 78.6% Fibonacci retracement. Price is currently in the middle of the descending trendline resistance and ascending trendline support, hence traders should wait for the price to swing higher or lower before entering into the trade.
Areas of consideration:
● Watch 1st Support at 0.90909
● Watch 1st Resistance at 0.91690
GBP/USD:
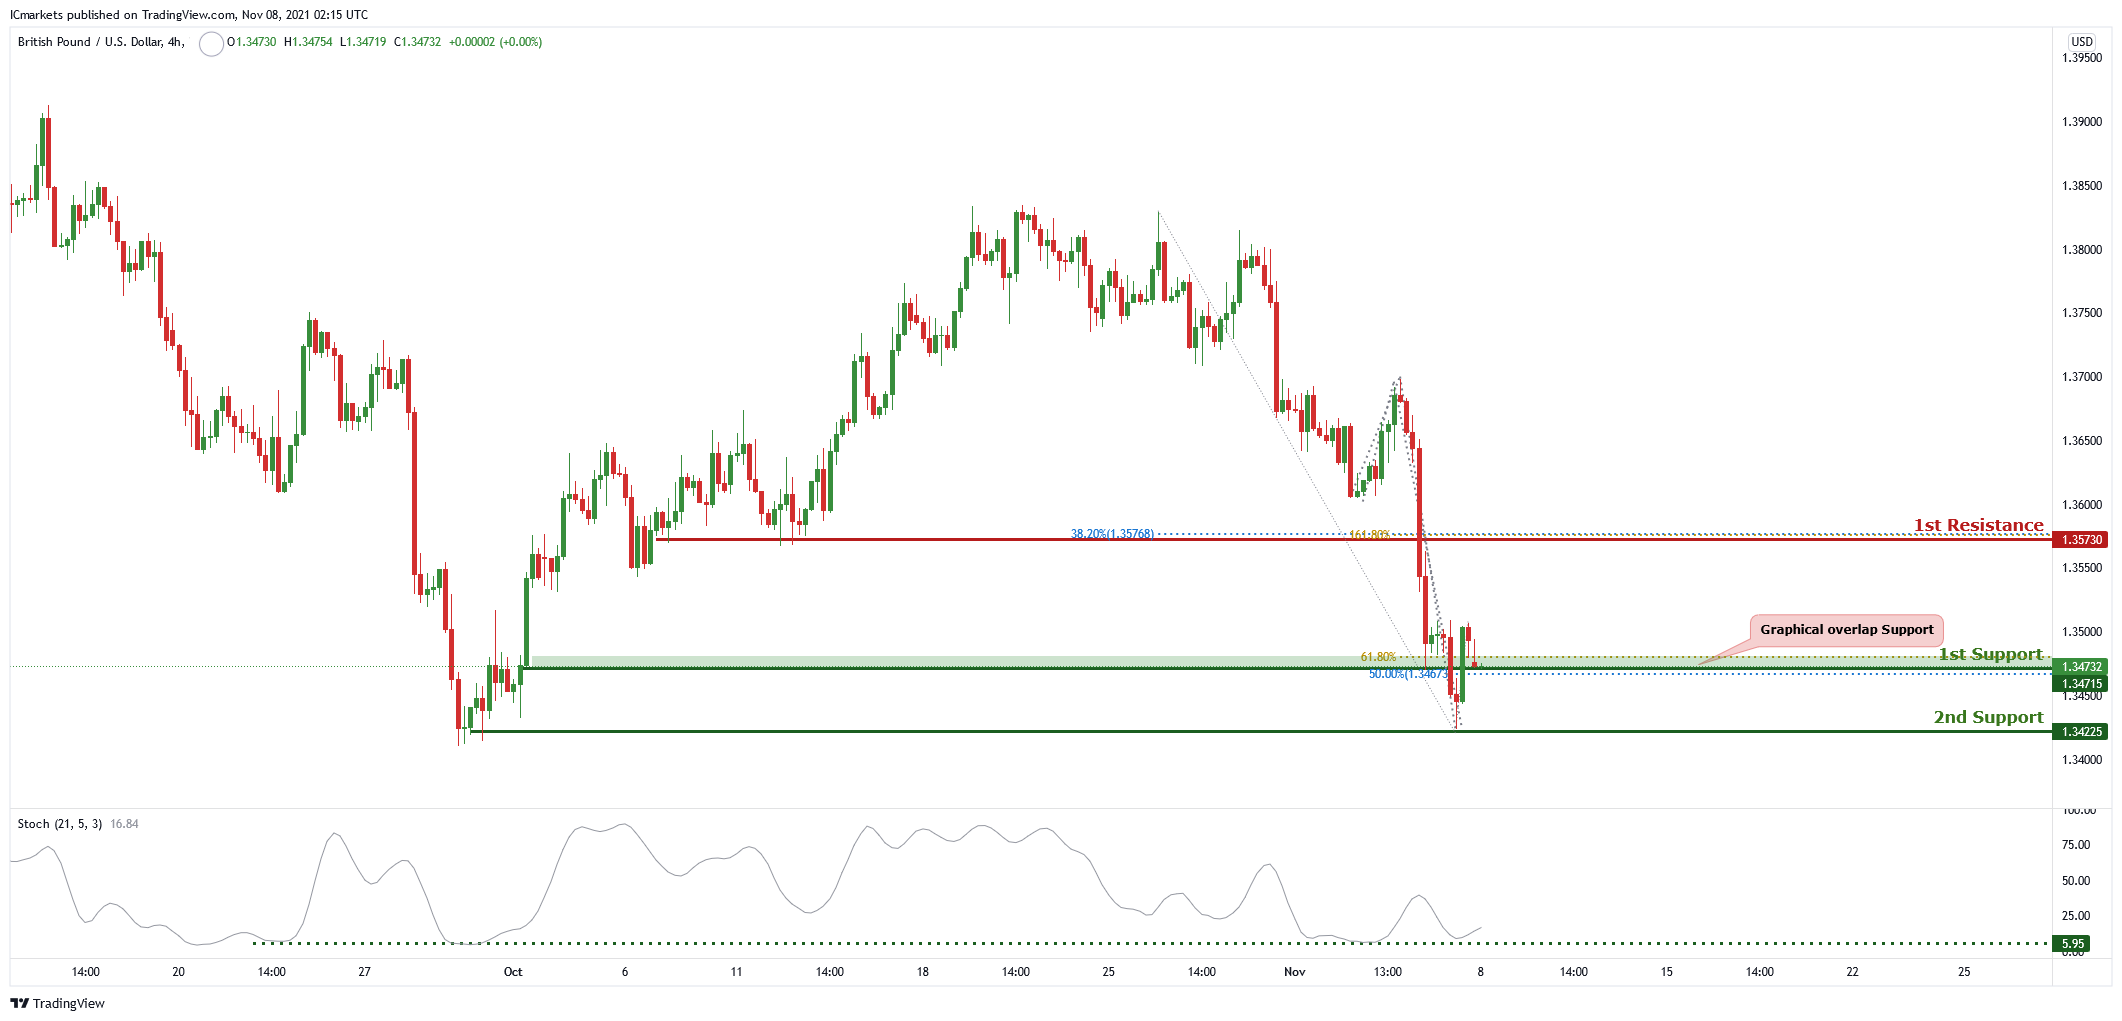
On the H4 chart, price is near the first support level of 1.34715 which is also 61.8% Fibonacci projection and 50% Fibonacci retracement. It is also at the graphical overlap support level. Price can then potentially reach the first resistance level of 1.35730 which is also 38.2% Fibonacci retracement and 61.8% Fibonacci projection . Our bullish bias is supported by the stochastic indicator as it is near the support level. Alternatively if price were to break the first support level, it can potentially dip to the 2nd support which is the graphical swing low level.
Arena of consideration :
- H4 first resistance – 1.35730
- H4 first support – 1.34715
- H4 second support – 1.34225
USD/JPY:
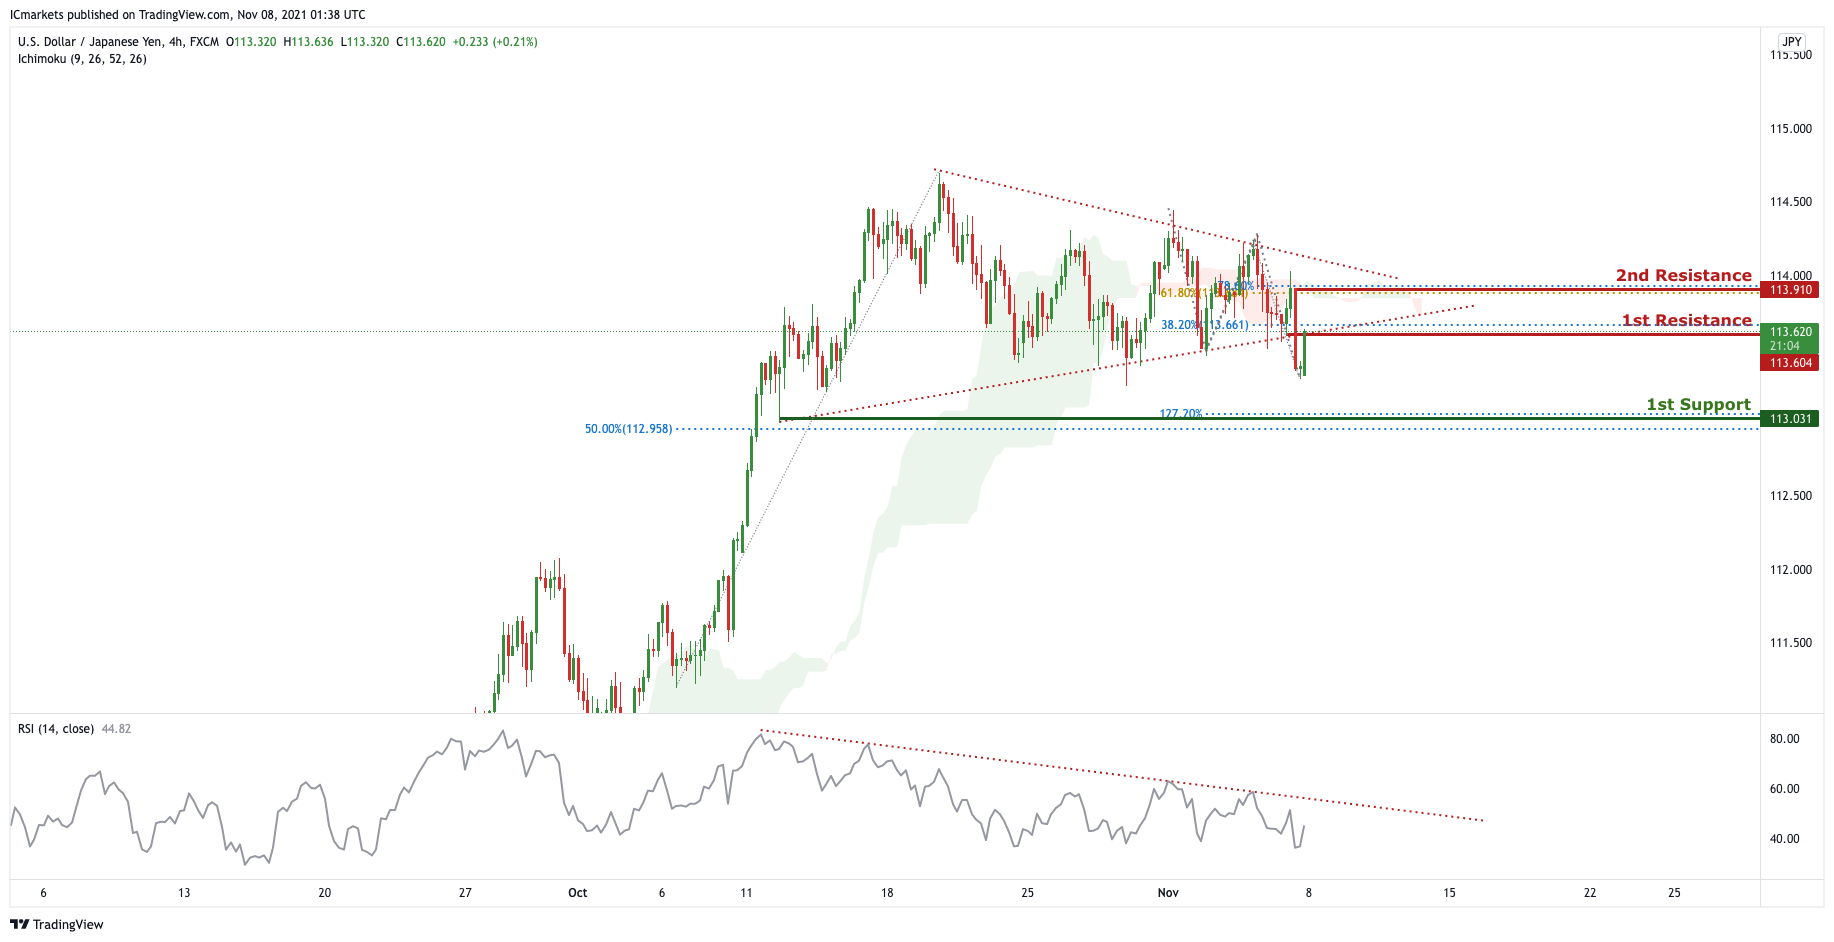
On the H4 timeframe, price broke downwards from the triangle pattern, signifying a bearish momentum. We can expect price to drop from 1st Resistance in line with 38.2% Fibonacci retracement and ascending trendline support turn resistance towards 1st Support level in line with 50% Fibonacci retracement and 127.2% Fibonacci projection. Our bearish bias is further supported by the RSI indicator where it is abiding to the descending trendline resistance.
Areas of consideration:
● H4 1st resistance level 113.604
● H4 1st support level 113.031
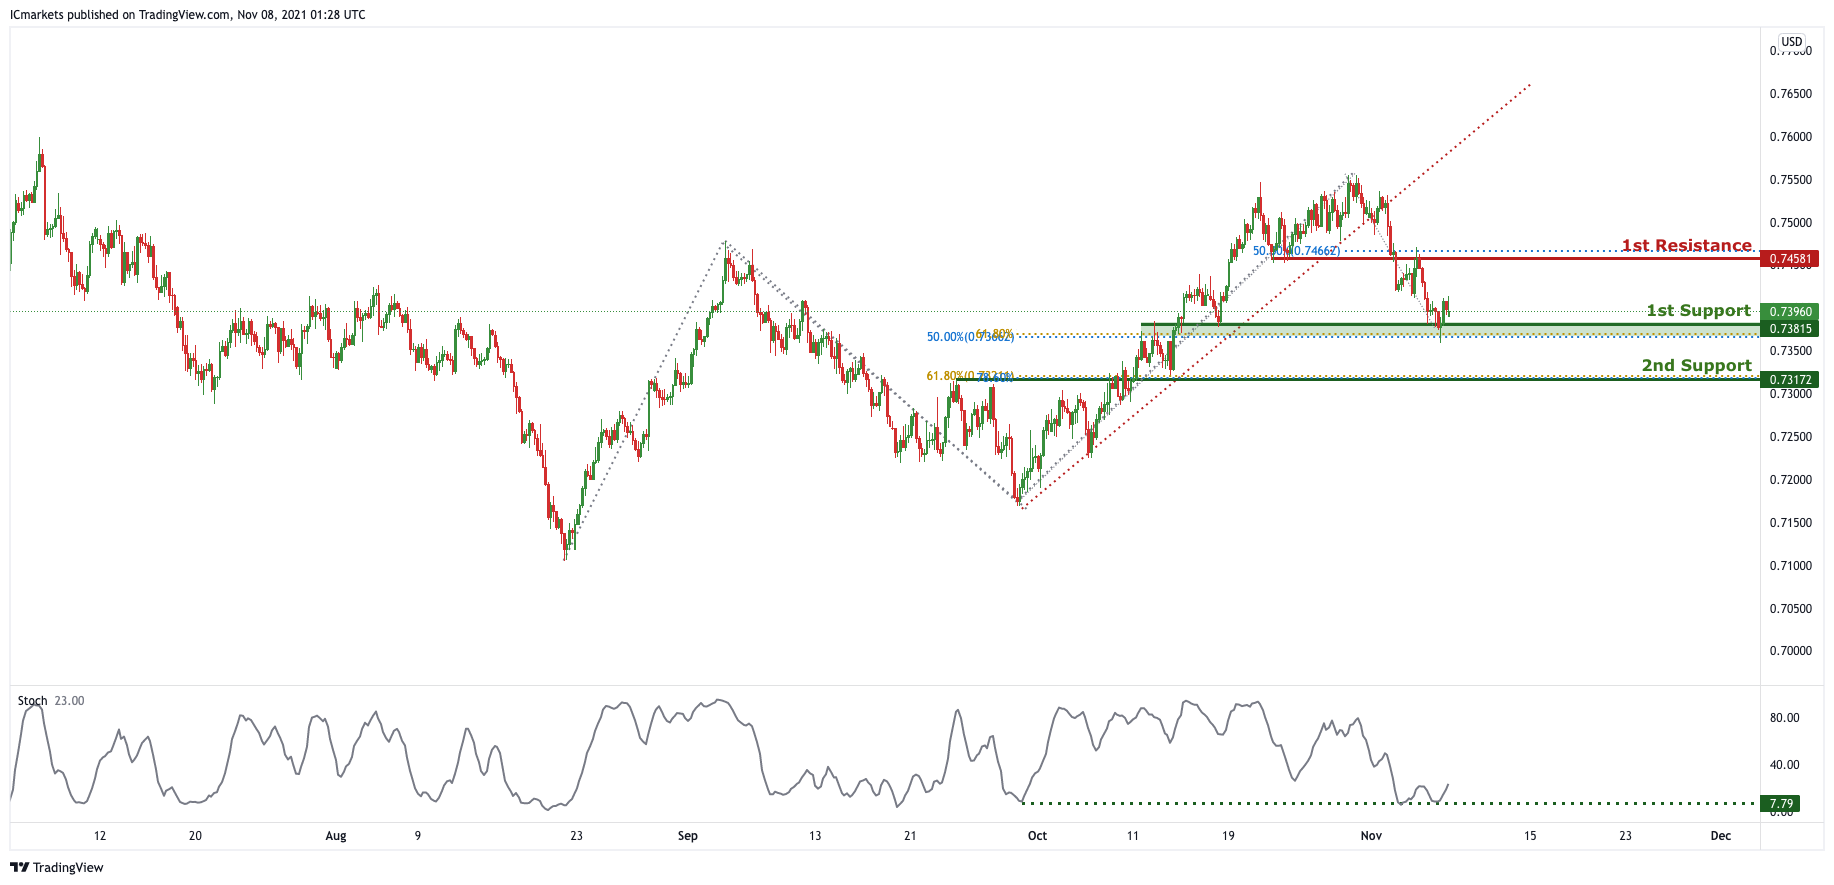
AUD/USD:
On the H4, we can see that price broke past the ascending trendline support, signifying a bearish trend momentum. We can expect price to make a short-term bullish bounce from the 1st Support in line with the 50% Fibonacci retracement and 61.8% Fibonacci projection towards the 1st Resistance in line with 50% Fibonacci retracement. Our short-term bullish support is further supported by a stochastic indicator where the %K line is at the support level.
Areas of consideration:
● H4 1st resistance level 0.74581
● H4 1st support level 0.73815
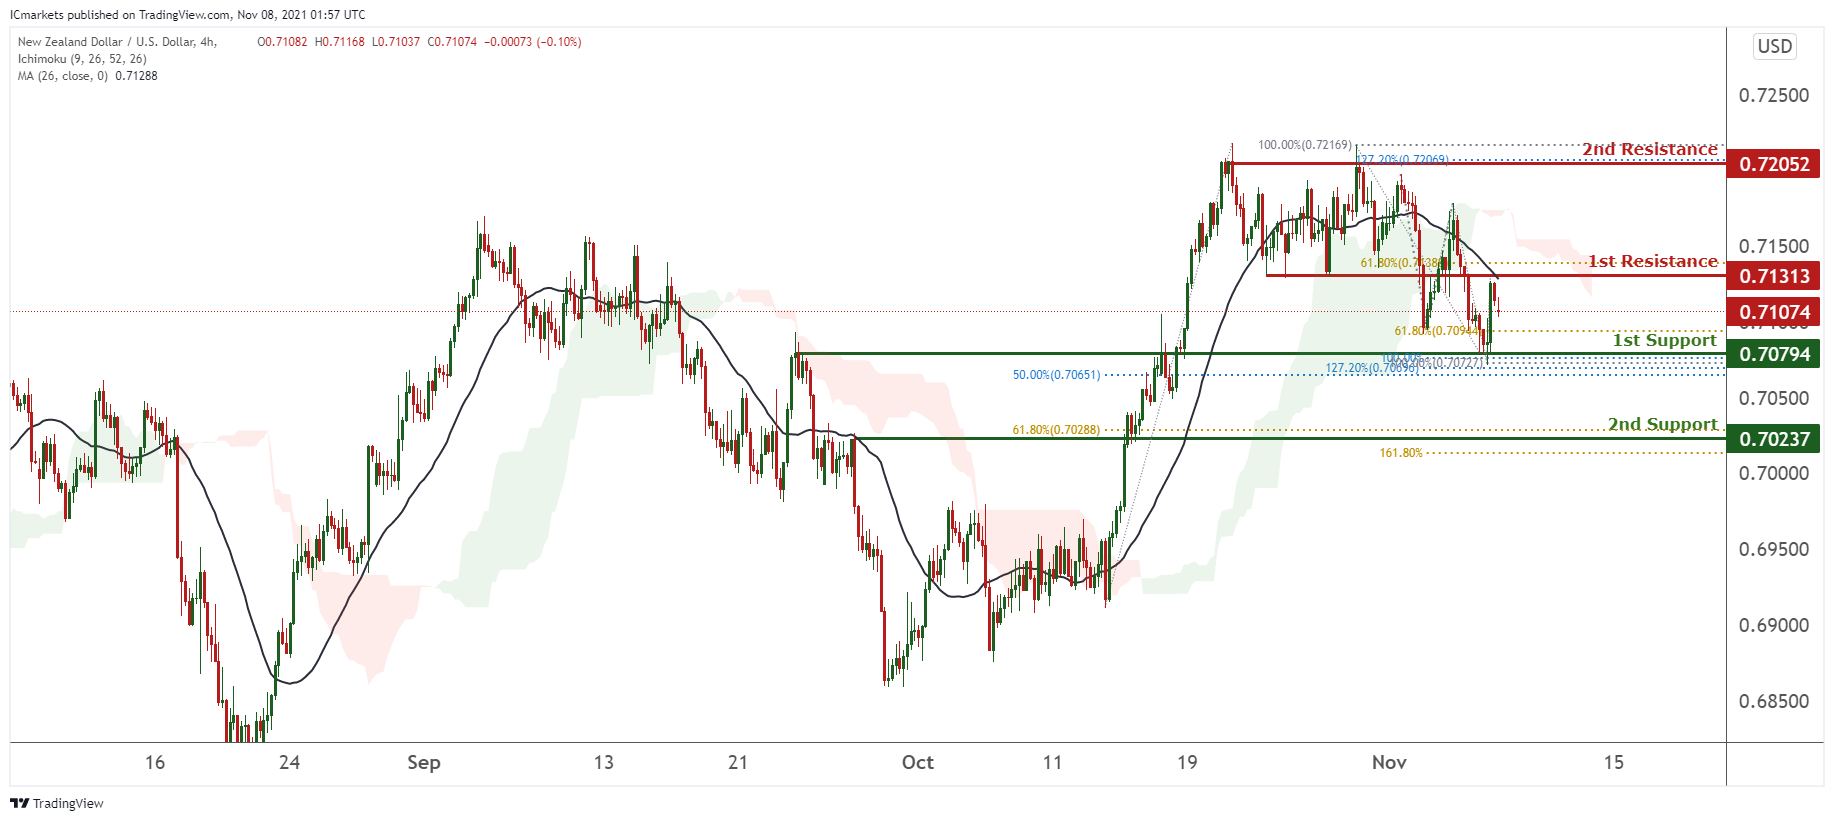
NZD/USD:
On the H4 timeframe, prices have recently tested our 1st resistance at 0.71313 which is in line with 61.8% Fibonacci retracement and has the potential to retest our 1st support which is an area of Fibonacci confluences. Technical indicators are showing bearish momentum. If prices breaks our 1st support at 0.70794, it has the potential to dip to our 2nd support at 0.70237 in line with 61.8% and 161% Fibonacci extension.
Areas of consideration:
● H4 time frame, 1st resistance at 0.72052
● H4 time frame, 1st support at 0.70794
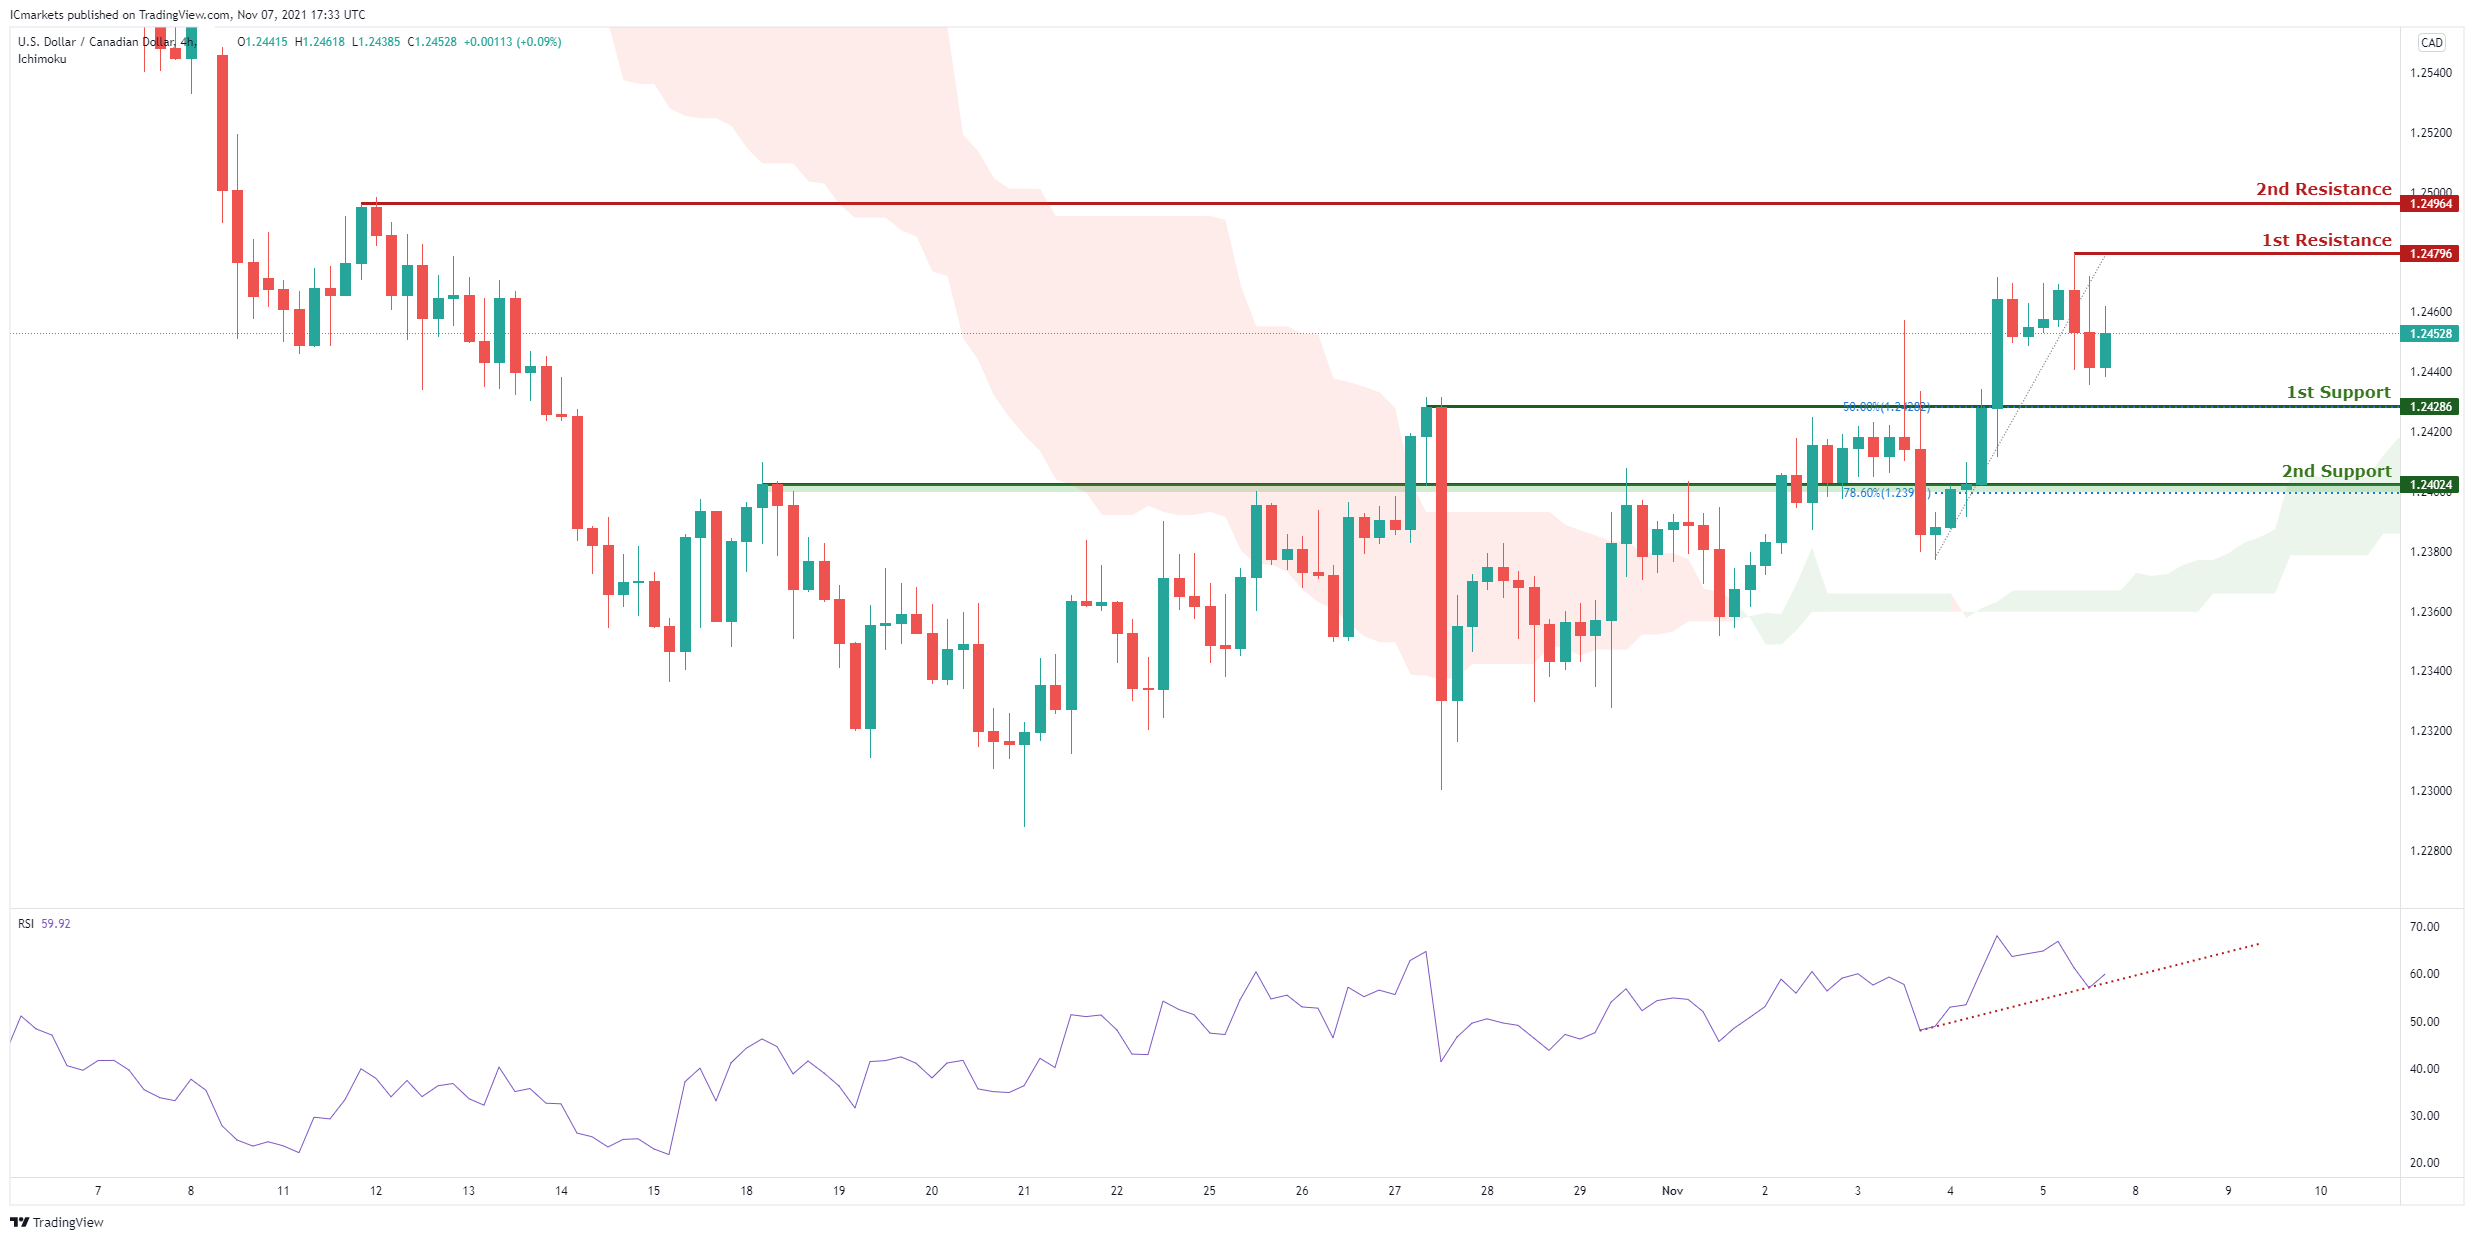
USD/CAD:
On the H4, with price bouncing off the support on the RSI indicator and price moving above the ichimoku cloud, we have a bullish bias that price will rise from 1st support at 1.24286 in line with the 50% Fibonacci retracement levels and the horizontal overlap support to 1st resistance at 1.24796 in line with the graphical swing high resistance and possibly even to 2nd resistance at 1.24964 in line with the graphical swing high from 12th of October. Alternatively, we may see price break 1st support structure and head for 2nd support at 1.24024 in line with the 78.6% Fibonacci retracement level and horizontal overlap support.
Areas of consideration:
● H4 time frame, support at 1.24286
● H4 time frame, resistance at 1.24796
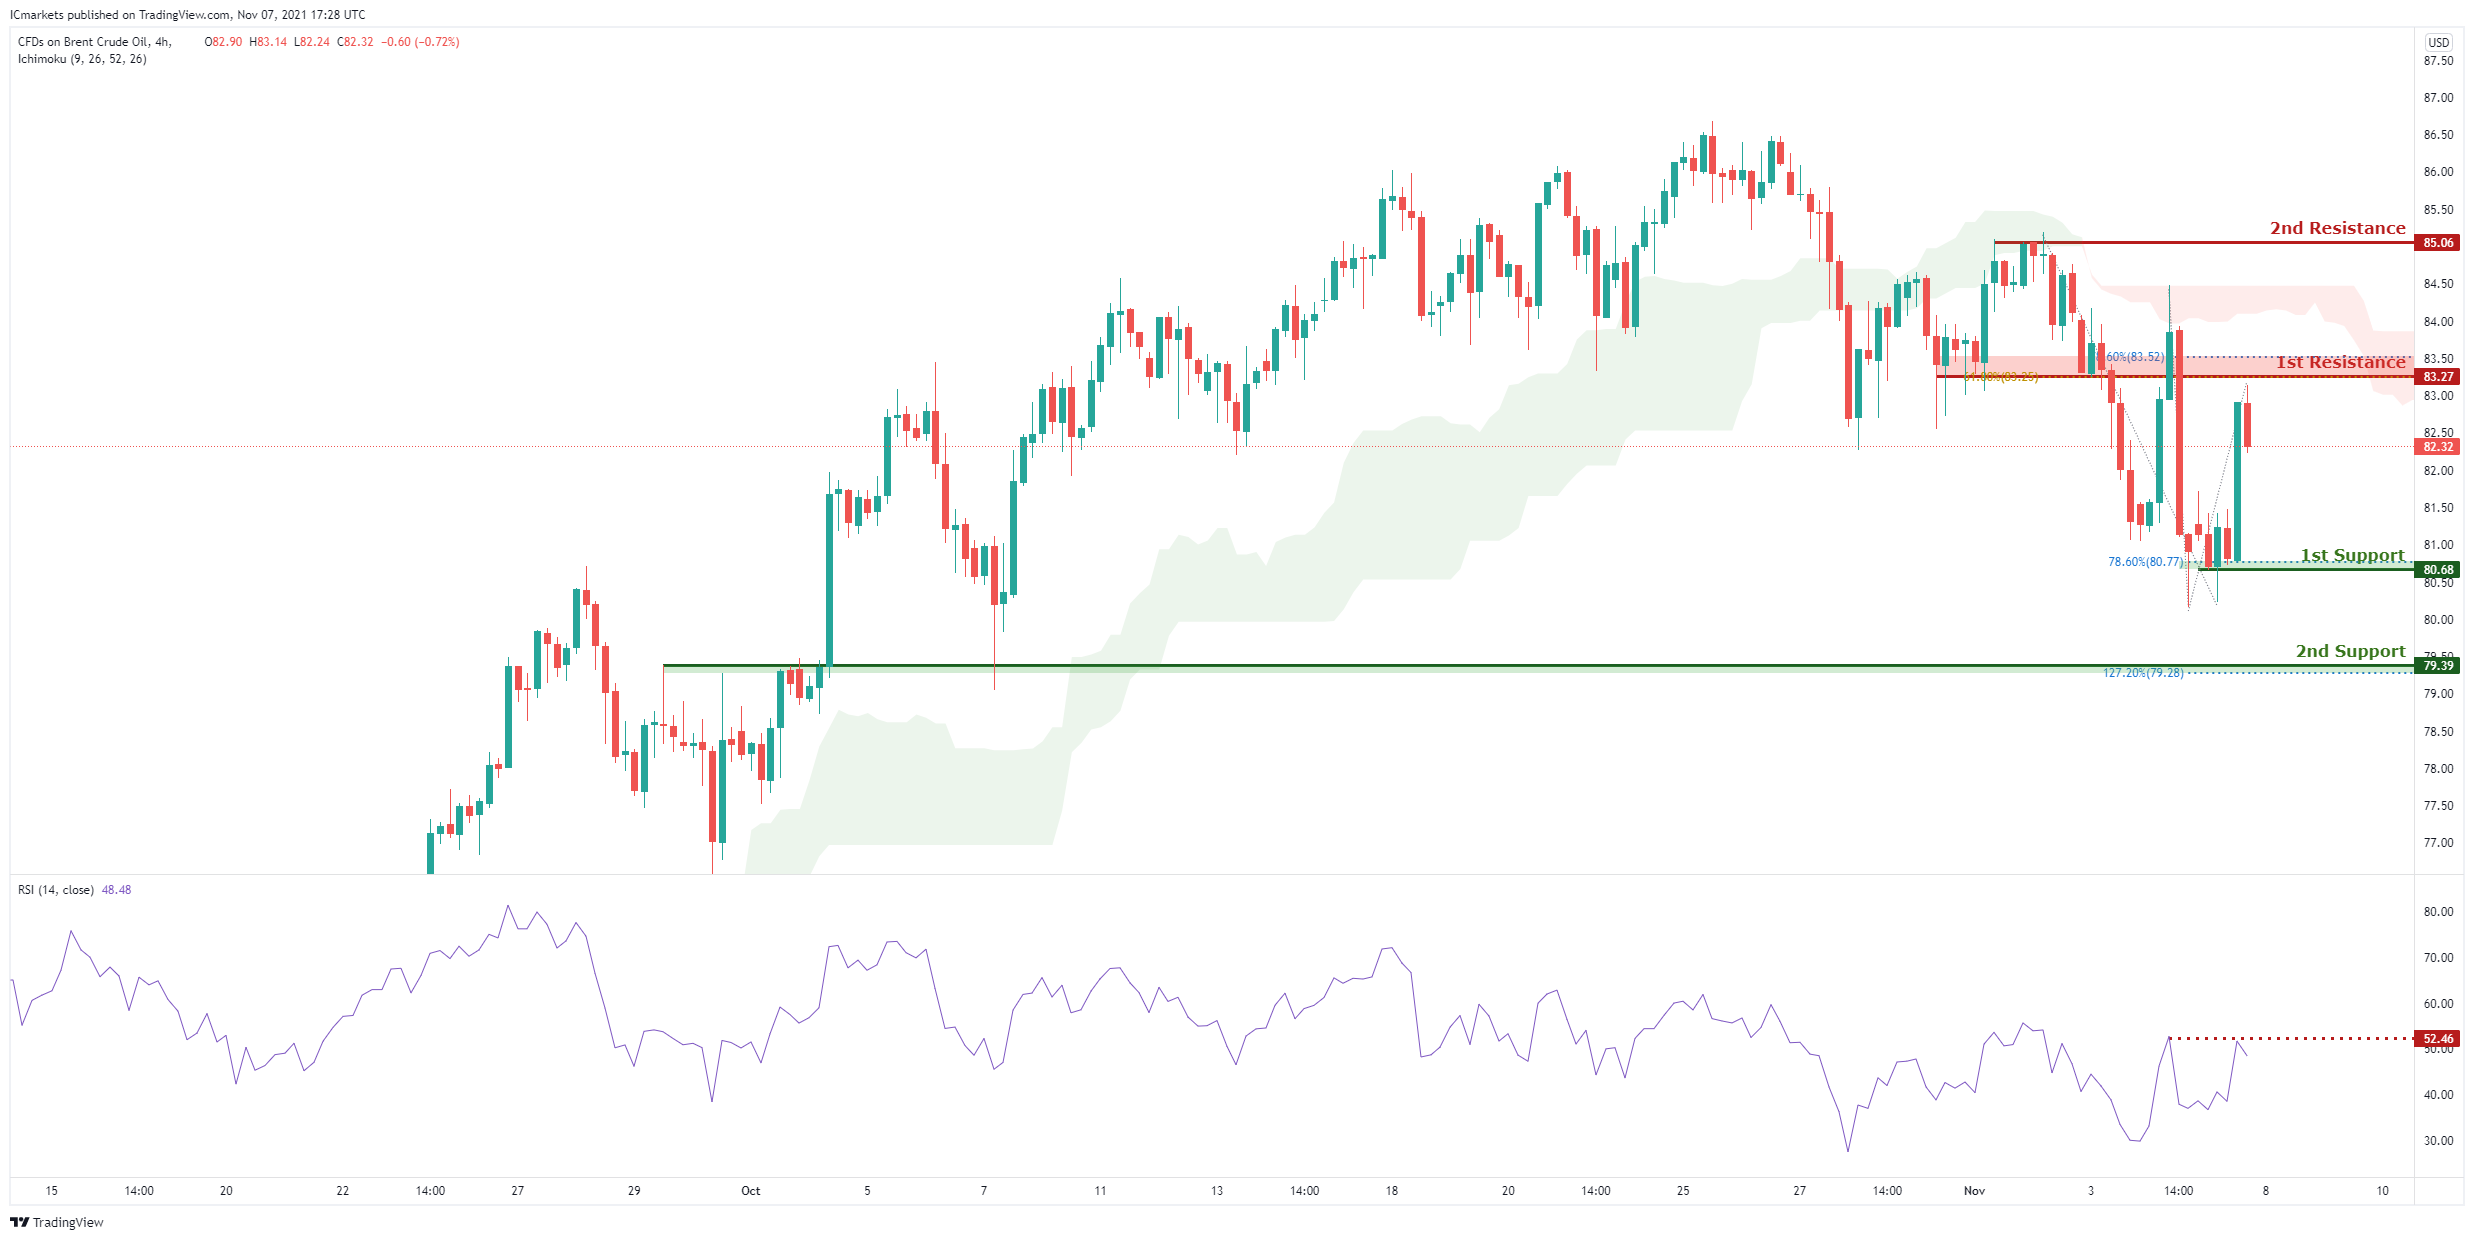
OIL:
On the H4 timeframe,with price moving below the ichimoku cloud and bouncing off the RSI resistance level, we are expecting a bearish continuation from our 1st resistance at 83.27 in line with the 78.6% and 61.8% Fibonacci retracement level to 1st support at 80.68 in line with our horizontal swing low support and 78.6% Fibonacci retracement level and possibly our 2nd support at 79.39 in line with our 127.2% Fibonacci extension levels. Alternatively, price may break 1st resistance structure and head for 2nd resistance at 85.06 which is in line with our swing high resistance.
Areas of consideration:
● H4 time frame, 1st resistance of 83.27
● H4 time frame, 1st support of 80.68
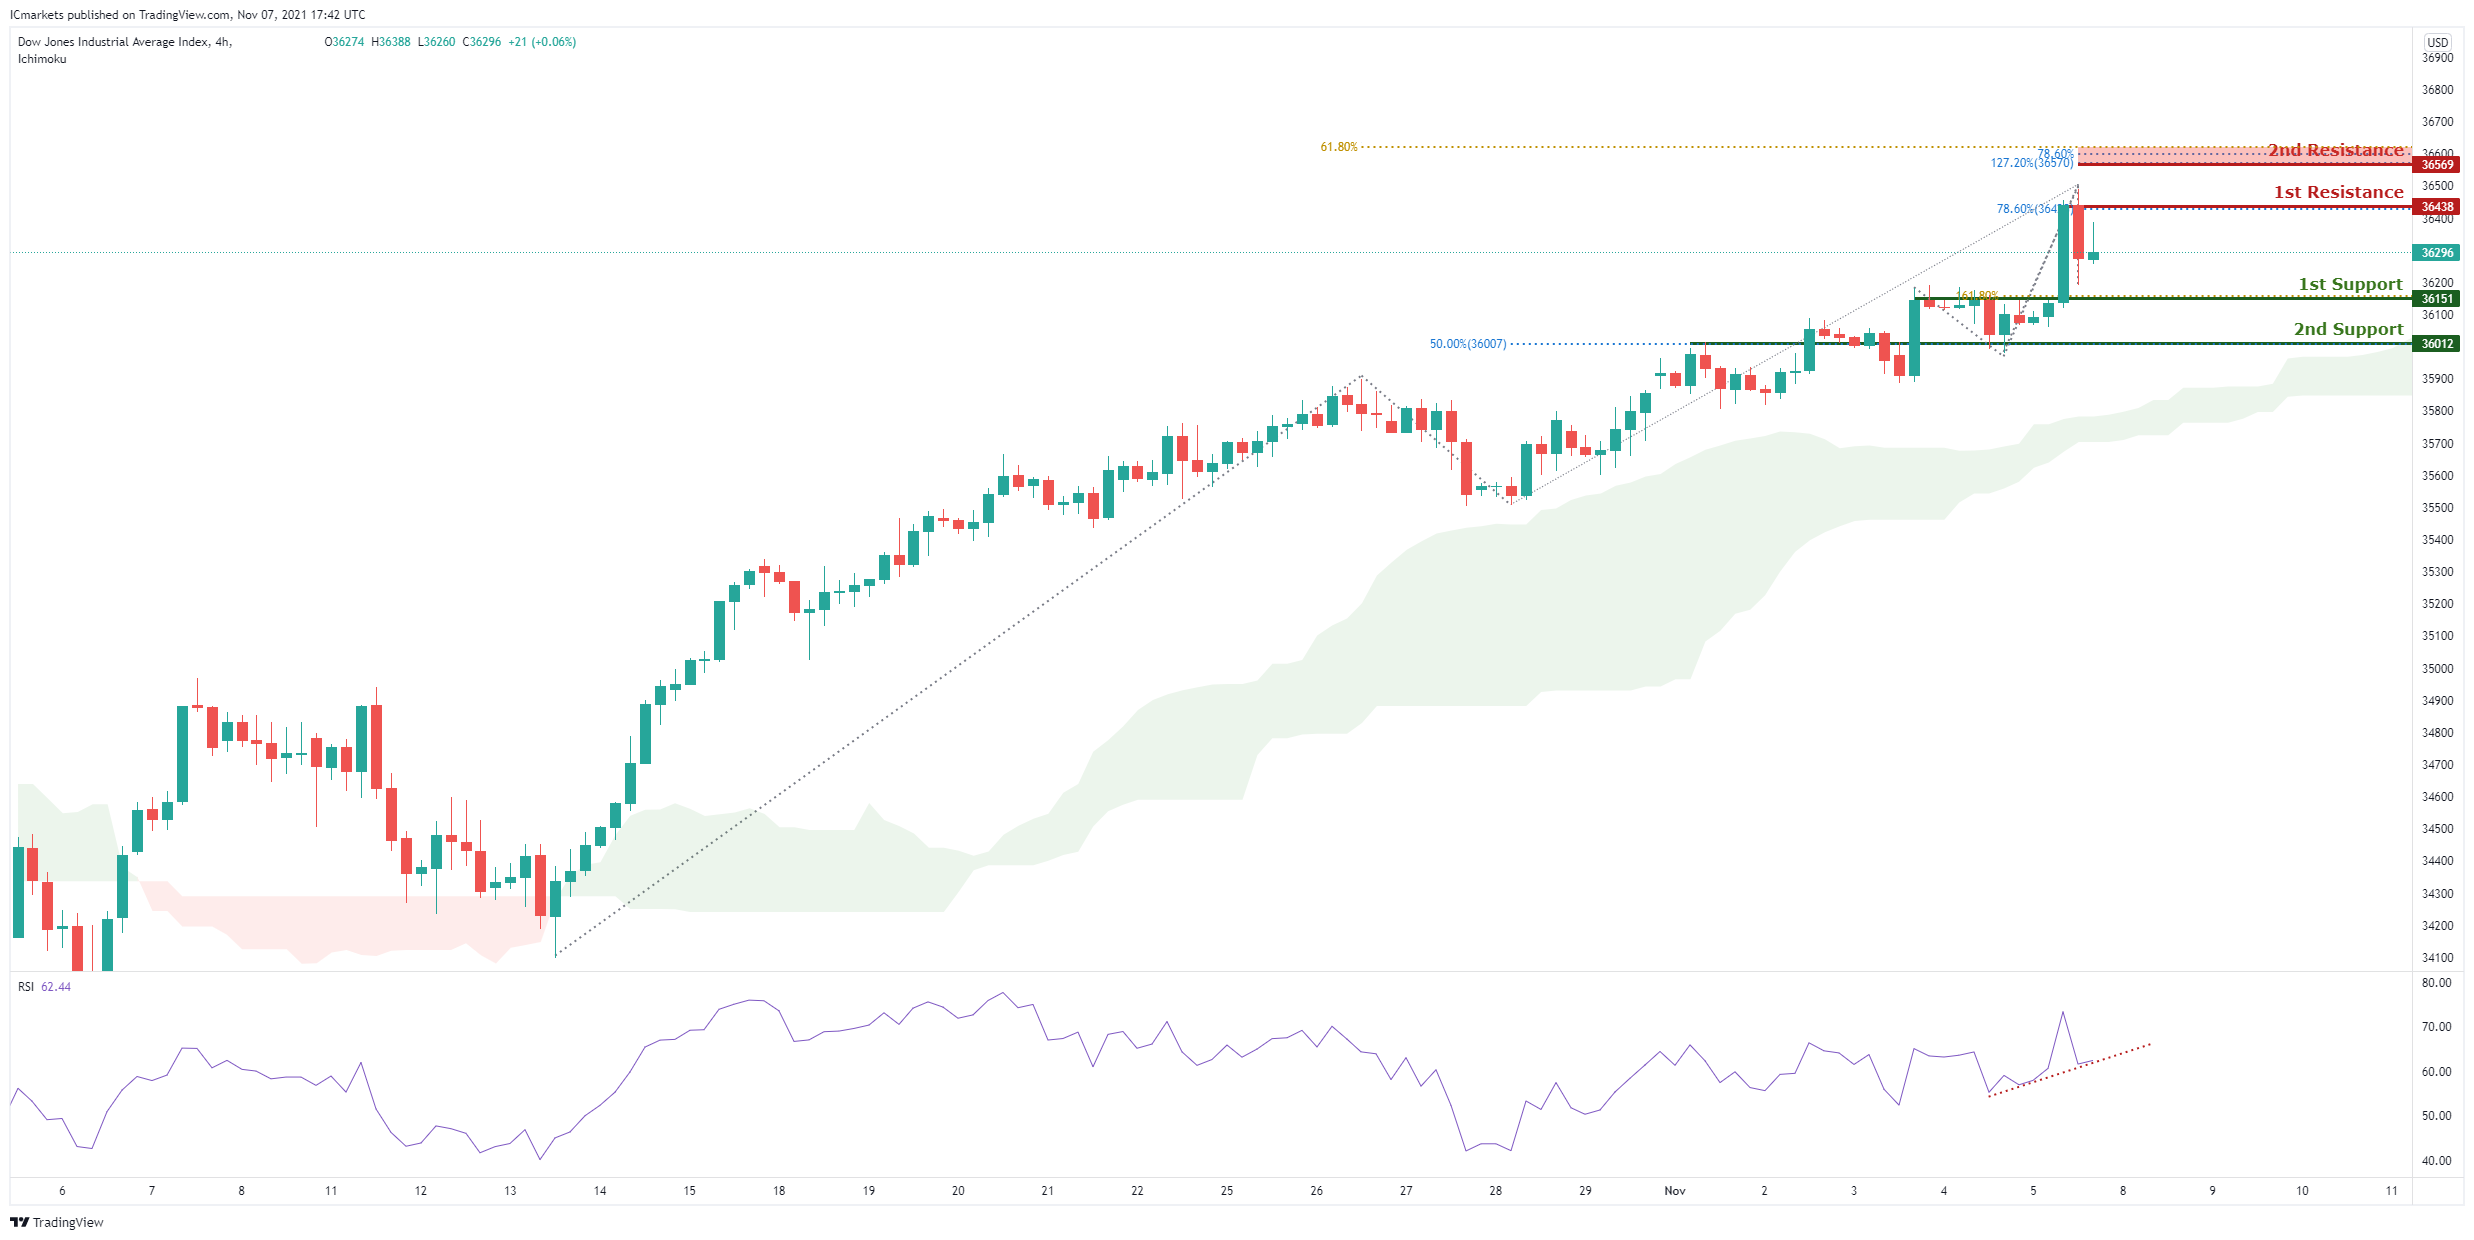
Dow Jones Industrial Average:
On the H4, with price moving above our ichimoku cloud, in an upwards trend and bouncing off our support on the RSi indicator, we are biased that price will rise from out 1st support at 36151 in line with the 161.8% Fibonacci extension level to 1st resistance at 36438 in line with two 78.6% Fibonacci retracement level and possibly even rise to 2nd resistance at 36569 in line with the 61.8% Fibonacci extension and 127.2% Fibonacci extension level. Alternatively, we may see price break 1st support and head for 2nd support at 36012 in line with 50% Fibonacci retracement and graphical swing low.
Areas of consideration:
● 4H resistance at 36438
● 4H support at 36151
The accuracy, completeness and timeliness of the information contained on this site cannot be guaranteed. IC Markets does not warranty, guarantee or make any representations, or assume any liability regarding financial results based on the use of the information in the site.
News, views, opinions, recommendations and other information obtained from sources outside of www.icmarkets.com.au, used in this site are believed to be reliable, but we cannot guarantee their accuracy or completeness. All such information is subject to change at any time without notice. IC Markets assumes no responsibility for the content of any linked site.
The fact that such links may exist does not indicate approval or endorsement of any material contained on any linked site. IC Markets is not liable for any harm caused by the transmission, through accessing the services or information on this site, of a computer virus, or other computer code or programming device that might be used to access, delete, damage, disable, disrupt or otherwise impede in any manner, the operation of the site or of any user’s software, hardware, data or property.


