Key risk events today:
German Industrial Production m/m; ECB President Lagarde Speaks.
(Previous analysis as well as outside sources – italics).
EUR/USD:
Weekly gain/loss: +1.69%
Weekly close: 1.1289
Weekly perspective:
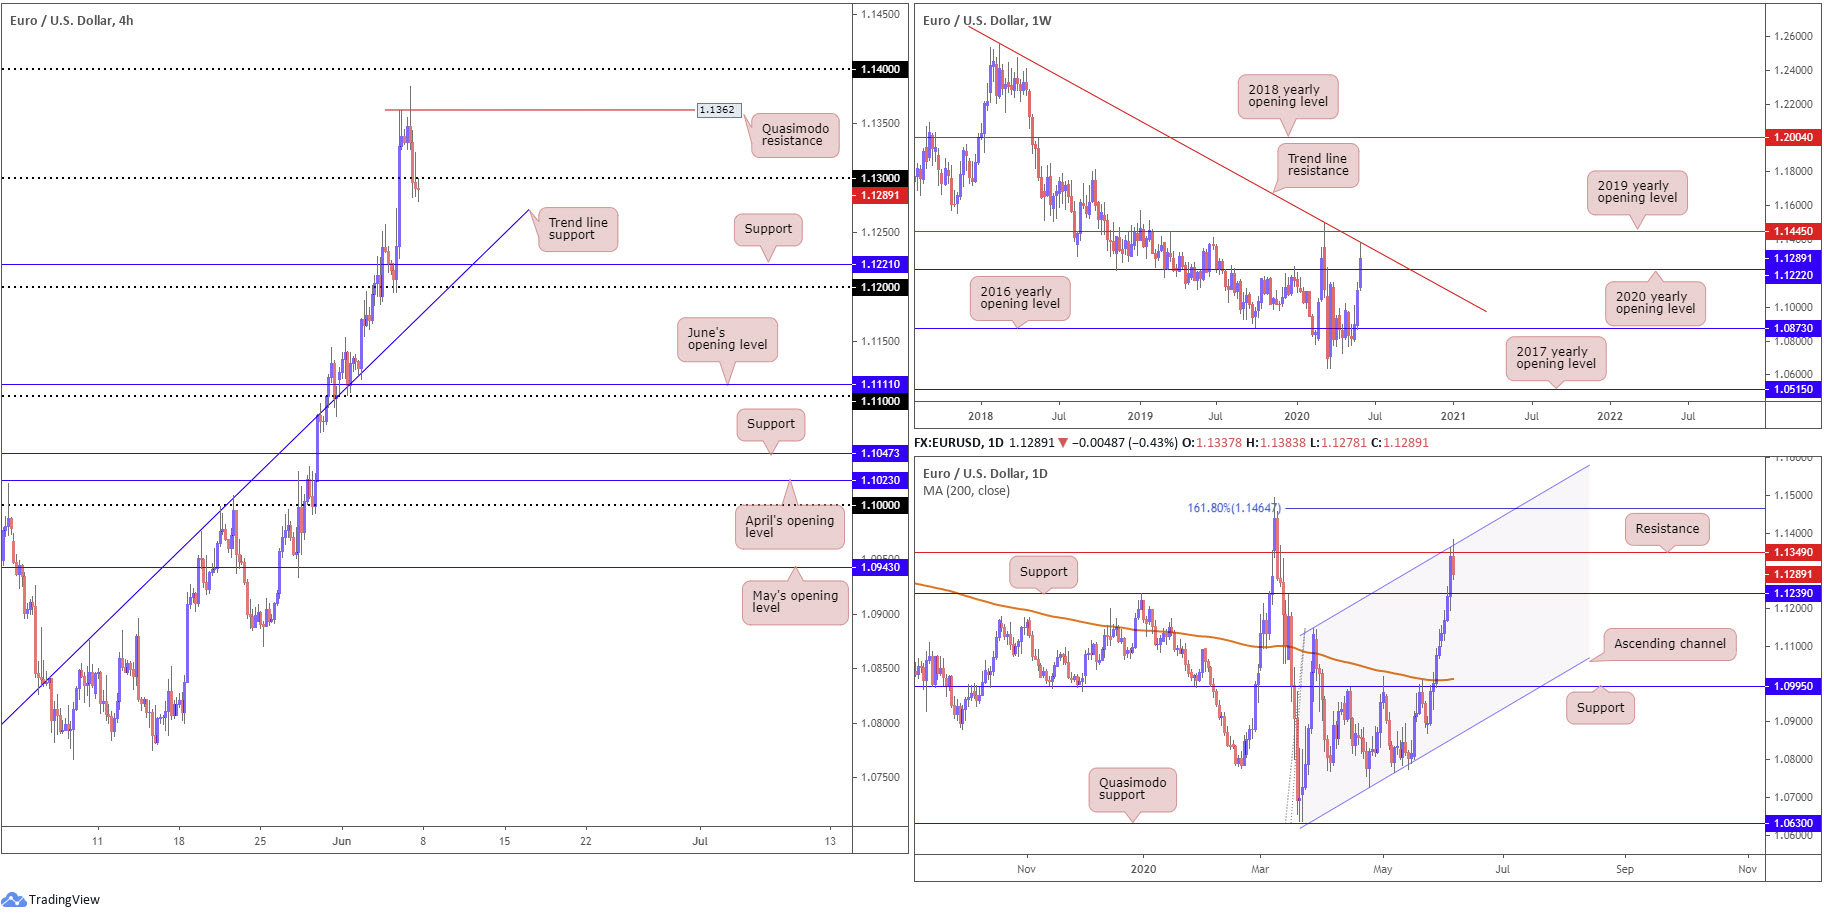
Over the course of last week, EUR/USD extended recovery gains north of the 2020 yearly opening level at 1.1222, consequently grappling with trend line resistance into the close, a level extended from highs at 1.2555.
This may lure price lower this week, perhaps reconnecting with 1.1222. Further upside, on the other hand, could have the unit cross swords with the 2019 yearly opening level at 1.1445.
With respect to the long-term trend, the pair has remained under pressure since topping in early February 2018.
Daily perspective:
The daily timeframe, meanwhile, pivoted lower from resistance at 1.1349 Friday after eight days of impressive gains. Price action traders may have also noted the converging channel resistance, extended from the high 1.1147.
Like the weekly timeframe, therefore, a push lower could be on the cards this week, though daily flow indicates support may materialise at 1.1239. In the event 1.1349 gives way, nevertheless, a 161.8% Fibonacci extension point at 1.1464 may make an appearance.
H4 perspective:
Total non-farm payroll employment rose by 2.5 million in May, and the unemployment rate declined to 13.3%, the US Bureau of Labour Statistics reported Friday. Job’s numbers were considerably healthier than market consensus, which expected an 8 million decline in payrolls.
Leaving the 1.14 base unopposed, data guided EUR/USD to lower levels, attacking protective stop-loss orders under the 1.13 psychological band. This, like higher-timeframe structure, promotes a bearish tone this week, targeting H4 support at 1.1221 (prior Quasimodo resistance), closely followed by the 1.12 handle and trend line support, taken from the low 1.0727.
Areas of consideration:
Technical structure on all three timeframes suggest sellers have the upper hand, at least until we reach 1.1239: daily support.
As a result, traders may seek bearish strategies under 1.13 early week, targeting 1.1239, followed by the 2020 yearly opening level on the weekly timeframe at 1.1222 and then 1.12 on the H4. Conservative traders, however, may want H4 price action to print a bearish candlestick pattern off the underside of 1.13 before pulling the trigger.
GBP/USD:
Weekly gain/loss: +2.58%
Weekly close: 1.2663
Weekly perspective:
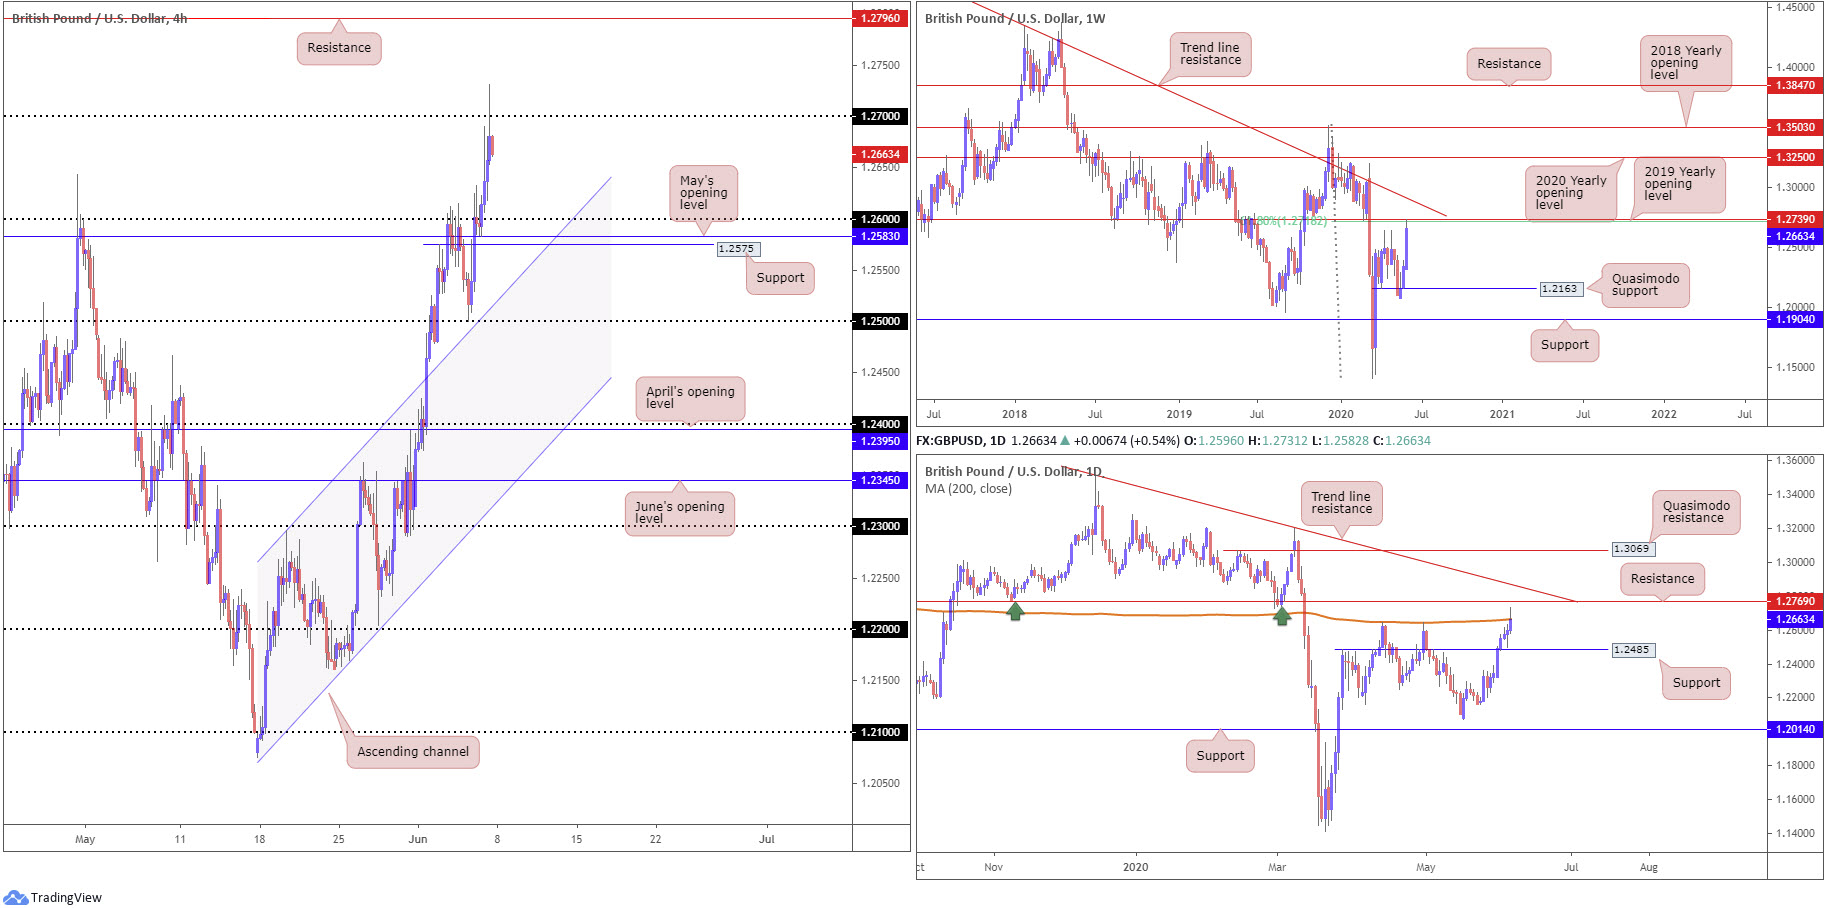
Up more than two-and-a-half-percent on the week, underpinned on the back of USD softness, sterling shook hands with a 61.8% Fibonacci retracement ratio at 1.2718, situated a few pips south of the 2019 yearly opening level at 1.2739.
Combined, this is impressive resistance. However, prudent traders will want to note trend line resistance, extended from the high 1.5930, in the event we spin off into another phase of buying this week. A rejection from current resistance, nevertheless, has plenty of room to manoeuvre until reaching Quasimodo support at 1.2163.
Daily perspective:
The 200-day SMA (orange – 1.2665) elbowed its way into the spotlight at the tail end of the week, floating underneath resistance plotted at 1.2769 and trend line resistance, taken from the high 1.3514.
Price engulfing the said SMA is a possibility this week, but resistance at 1.2769, owing to its history, could put a lid on gains. Initial downside support from either resistance resides at 1.2485.
H4 perspective:
Impressive US employment figures Friday aided the greenback, snapping an eight-day bearish phase off lows at 96.44 (DXY). US hours witnessed an enthusiastic attempt at cracking 1.27 on GBP/USD, likely targeting resistance at 1.2796 (prior Quasimodo support), though, as you can see, fell short at highs of 1.2731.
Starved of support on the H4 timeframe until hitting the 1.26 handle, moves lower could be in the offing this week. Note 1.26 aligns closely with May’s opening level at 1.2583, support at 1.2575 and channel resistance-turned support, etched from the high 1.2296.
Areas of consideration:
Weekly resistance making an appearance between 1.2718/1.2739, daily price connecting with its 200-day SMA and H4 price producing a fakeout through 1.27 certainly places a question mark on further buying, at least in early week.
On account of the above, sellers may strengthen their grip and take aim at 1.26. Consequently, bearish setups below 1.27 are an option.
AUD/USD:
Weekly gain/loss: +4.54%
Weekly close: 0.6967
Weekly perspective:
The Australian dollar finished the week strongly against its US counterpart, recording upside of more than 4.5% and registering its third consecutive weekly gain.
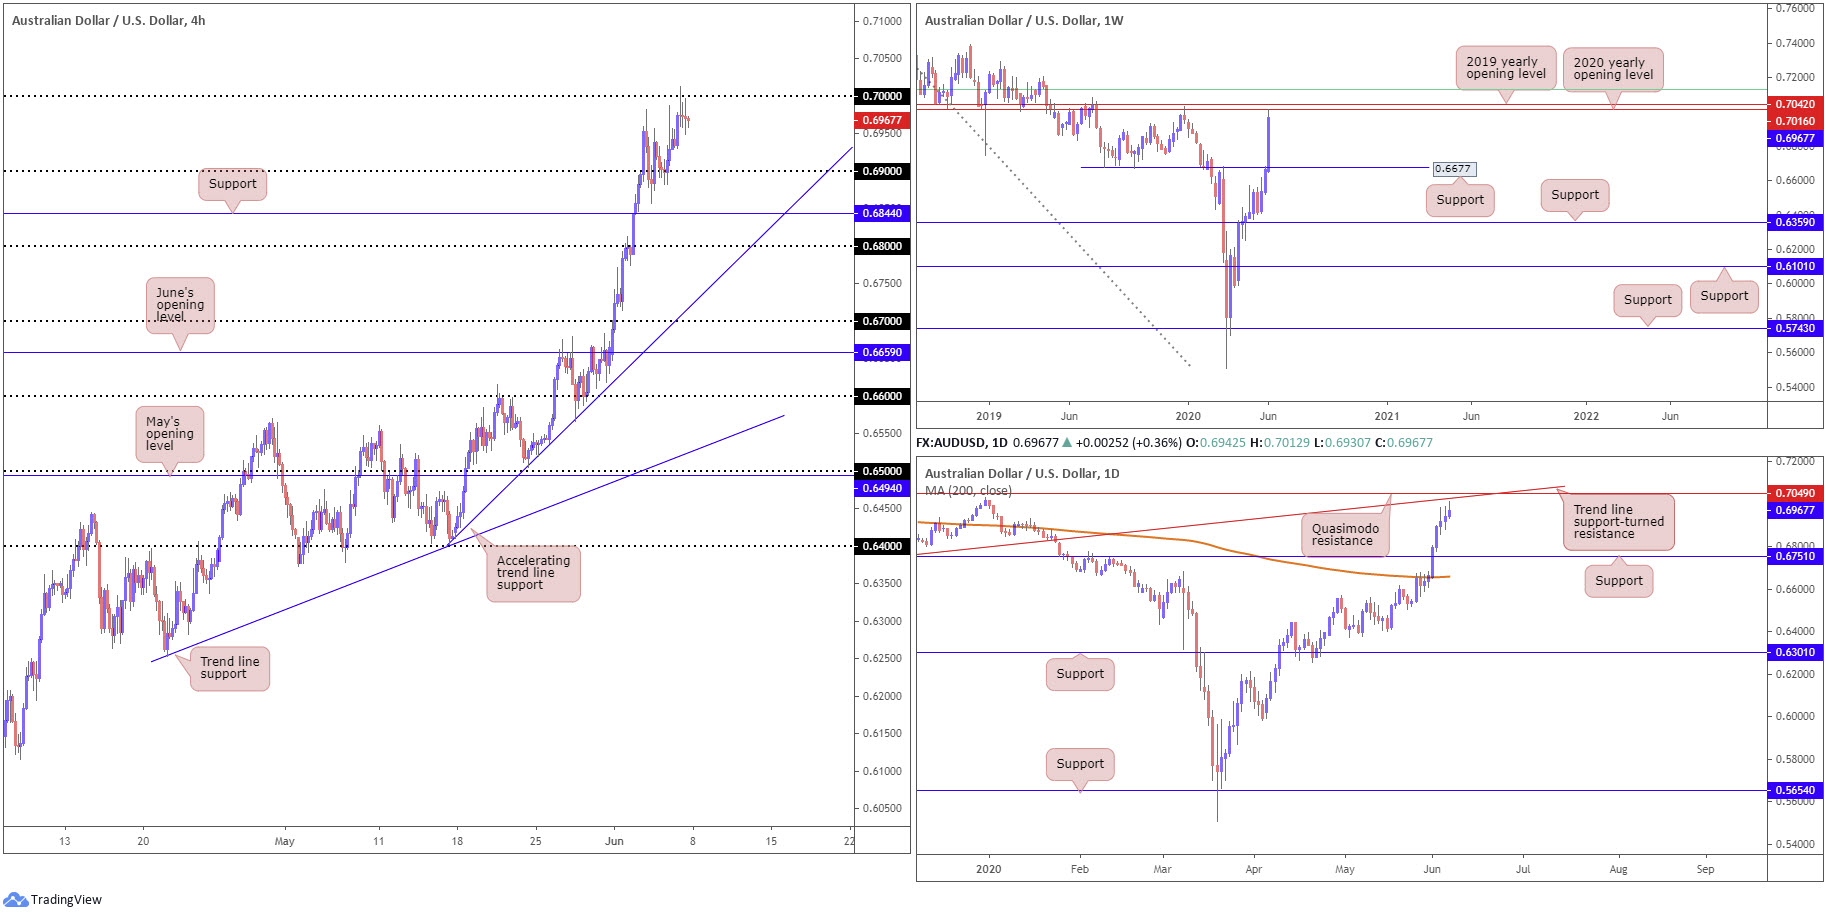
After brushing aside resistance at 0.6677 (now a serving support), focus shifted to the 2020 yearly opening level at 0.7016 and 2019 yearly opening level at 0.7042, both key levels to keep eyeballs on this week for selling pressure.
Additionally, traders are urged to pencil in the 61.8% Fibonacci retracement ratio at 0.7128 (green) should we explore higher levels this week.
Daily perspective:
With reference to the daily timeframe, we can see momentum slowed considerably over the past couple of days with candle bodies shrinking ahead of trend line support-turned resistance, taken from the low 0.6670, and a Quasimodo resistance seen nearby at 0.7049. This suggests buyers may be beginning to take a back seat here, potentially challenging the seven-day bull run.
We can also see the 200-day SMA (orange – 0.6658) is toying with the idea of flattening after trending lower since April 2018.
H4 perspective:
Friday saw the H4 candles fist bump the key figure 0.70 heading into Europe.
Technically, 0.70 is an interesting port of resistance, not only due to the number holding at the tail end of the week, but also because of its close relationship with higher-timeframe structure. Above 0.70, we have the 2020 yearly opening level at 0.7016 on the weekly timeframe, along with the 2019 yearly opening level at 0.7042. Also appealing is daily structure: trend line resistance (0.6670) and Quasimodo resistance at 0.7049.
Areas of consideration:
0.70, although a widely watched figure, has yet to entice much in the way of bearish candlestick action on the H4 timeframe. A bearish candle pattern formed from this region, coupled with higher-timeframe structure clouding the round number, will likely be sufficient to bring in 0.69 this week.
Alternatively, we could see more of an aggressive fakeout develop above 0.70 before serious sellers step in, consequently tripping buy-stops and filling more higher-timeframe sellers (weekly traders have likely already begun shorting ahead of the yearly opening levels).
USD/JPY:
Weekly gain/loss: +1.66%
Weekly close: 109.56
Weekly perspective:
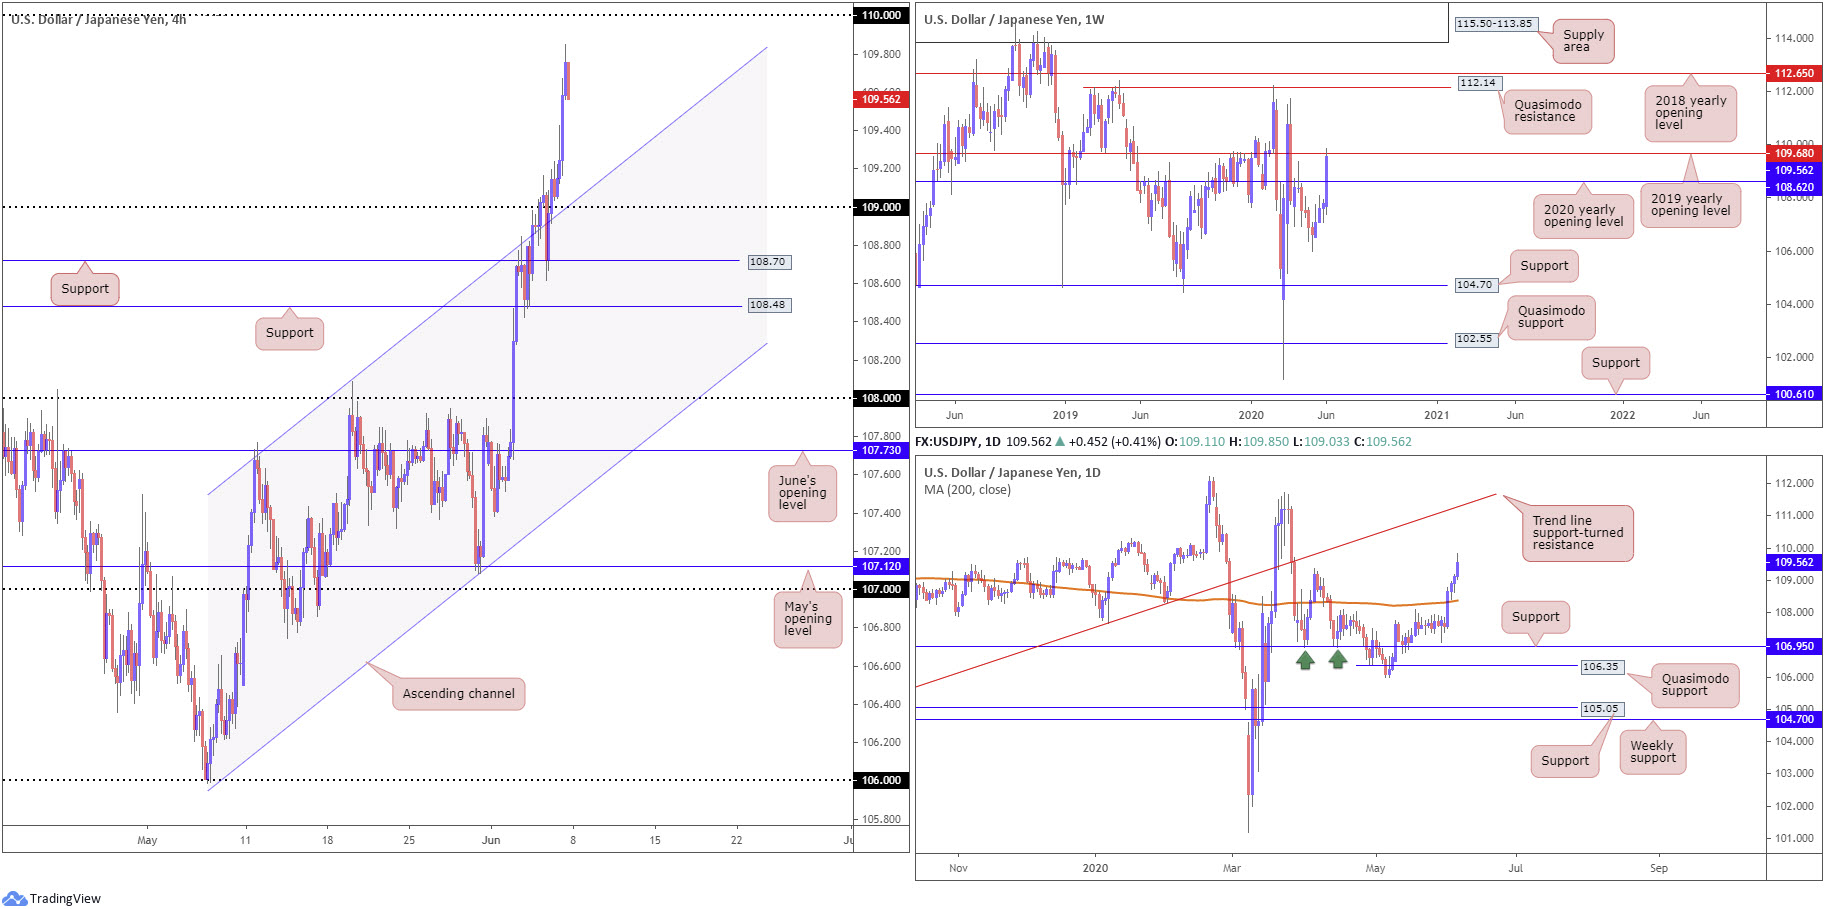
USD/JPY bulls took no prisoners last week, putting forward an aggressive extension to highs of 109.85, marking its fourth consecutive weekly gain.
Ousting sellers at the 2020 yearly opening level coming in from 108.62, a base that held price lower in April by way of a shooting star candle pattern, nudged the 2019 yearly opening level at 109.68 into motion at the close.
Stabilising off 109.68 this week has 108.62 to target, whereas territory above 109.68 appears free to make its way to Quasimodo resistance at 112.14.
Daily perspective:
The week observed daily candles overpower its 200-day SMA (orange – 108.37) in dominant fashion. This, together with Friday taking out the 109.38 April 6 high, may see the pair searching for bidders this week in attempt to reach as far north as trend line support-turned resistance, extended from the low 104.44.
Additional buying, however, may be a challenge knowing we’re trading from weekly resistance at the moment.
H4 perspective:
USD/JPY gained traction for a fourth consecutive session Friday amid optimistic job’s data and upbeat risk sentiment denting the Japanese yen’s appeal.
After establishing position above 109 late Thursday and taking out channel resistance, extended from the high 108.08, Friday’s data kept the buck on the winning side of the table. 1.10, as shown on the chart, is positioned within touching distance on this timeframe, emphasising we might pop higher early week to bring in sellers from this base.
Areas of consideration:
The 2019 yearly opening level at 109.68 may hamper upside this week, stinging breakout buyers above the 109.38 April 6 high and frustrating traders wanting to short 1.10.
H4 shows price ended the week producing a notable bearish candlestick formation under 1.10, closing at its lows. Given weekly resistance, along with fuel provided from breakout buy orders above 109.38 (liquidity to sell into), a retreat back to H4 channel resistance-turned support, extended from the high 108.08, could be thrown in the pot early trade.
USD/CAD:
Weekly gain/loss: -2.55%
Weekly close: 1.3417
Weekly perspective:
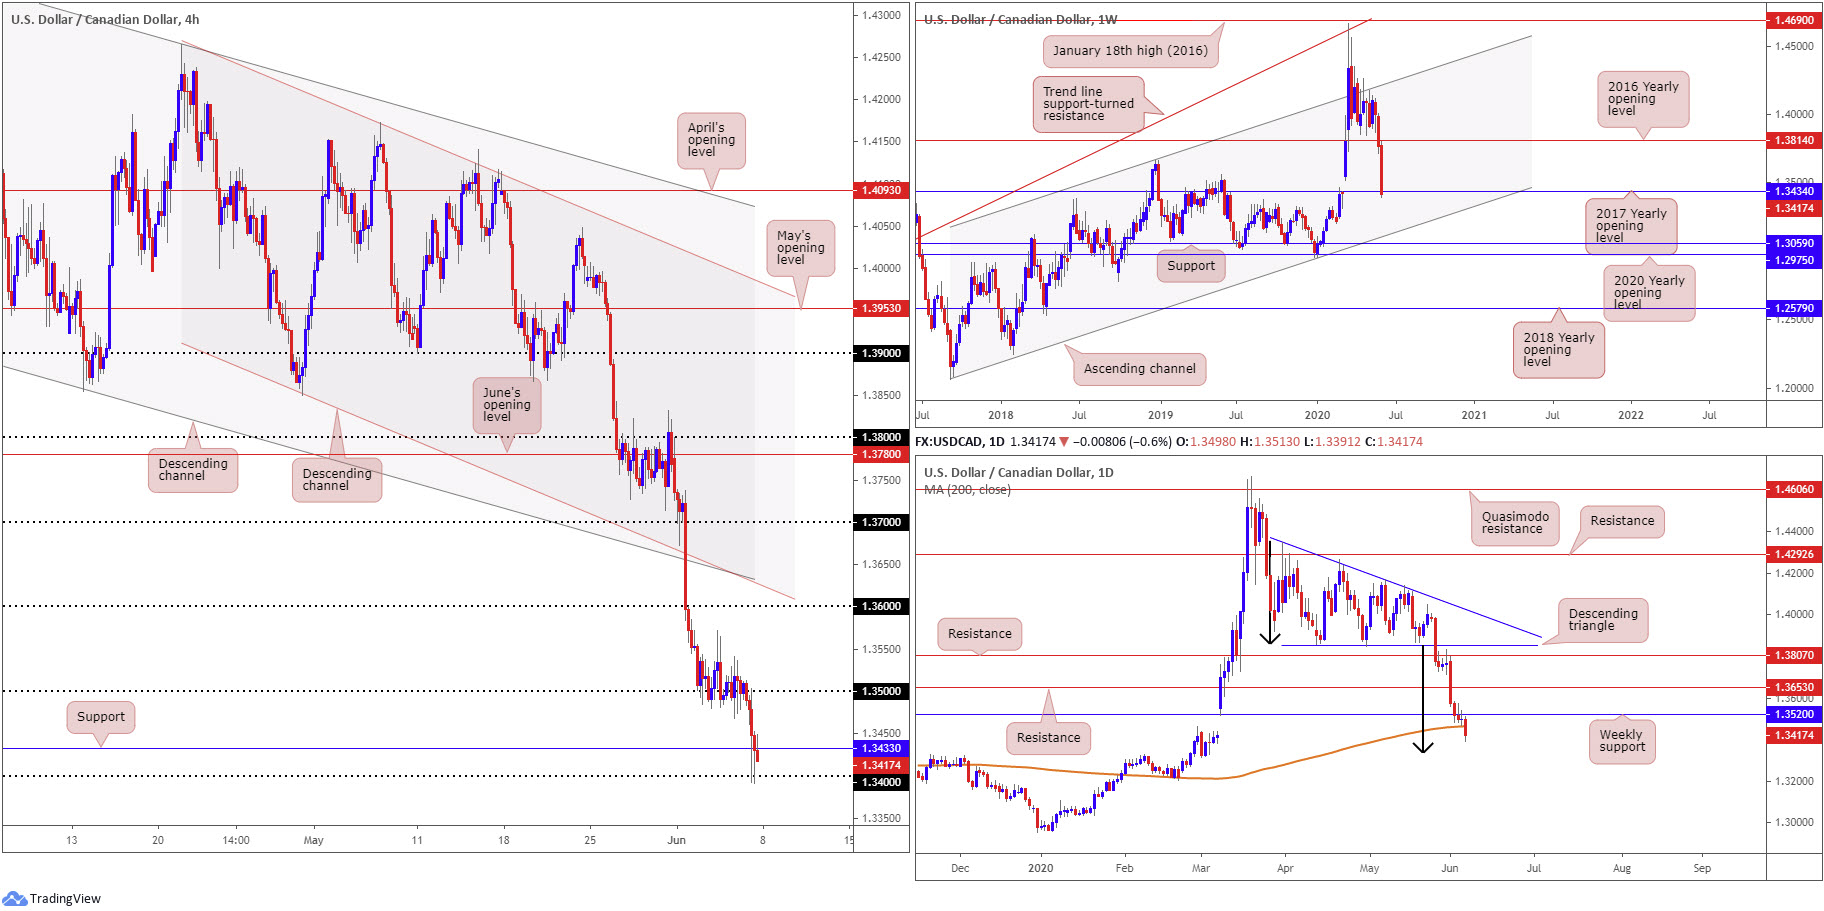
After a brief flicker of activity around 1.3814 (the 2016 yearly opening level), the US dollar sunk 2.5% against the Canadian dollar last week, nosediving into support at 1.3434, the 2017 yearly opening level.
Consequent to this, longer-term flow expects buyers to attempt a recovery this week. Failure to achieve anything meaningful suggests scope for downside towards long-standing channel support, taken from the low 1.2061.
Daily perspective:
The beginning of April started the process of carving out a descending triangle pattern between 1.4349 and 1.3855. As evident from the chart, after breaking the lower boundary along with nearby support at 1.3807, we’ve since witnessed price tunnel through a number of key supports, including the 200-day SMA (orange – 1.3463) Friday. This places the descending triangle’s take-profit base at 1.3332 (black arrows) on the radar this week.
H4 perspective:
Impressive US payrolls data provided fresh USD impetus Friday, albeit offering little respite to the pair as advancing oil prices – WTI crossed above $39.00/bbl – and optimistic Canadian job’s figures benefitted the Canadian dollar.
Longs were squeezed going into US hours, surpassing support at 1.3433 (essentially the same angle as current weekly support) and welcoming the 1.34 handle. Buyers, as you can see, have displayed some commitment off the round number but was unable to end the session above 1.3433.
Areas of consideration:
The round number at 1.34 and H4 support at 1.3433, along with weekly support, in the shape of the 2017 yearly opening level, at 1.3434, marks a potential reversal zone to consider this week. The caveat, of course, is daily price proposing a bearish stance until crossing swords with the descending triangle’s take-profit base at 1.3332.
As a result, it’s unlikely we’ll see buyers commit off 1.34 until a H4 close forms above 1.3433.
Alternatively, a H4 close south of 1.34 may be interesting for sellers, unlocking downside to the descending triangle’s take-profit base at 1.3332 and, according to the weekly timeframe, possibly channel support (1.2061).
USD/CHF:
Weekly gain/loss: +0.11%
Weekly close: 0.9618
Weekly perspective:
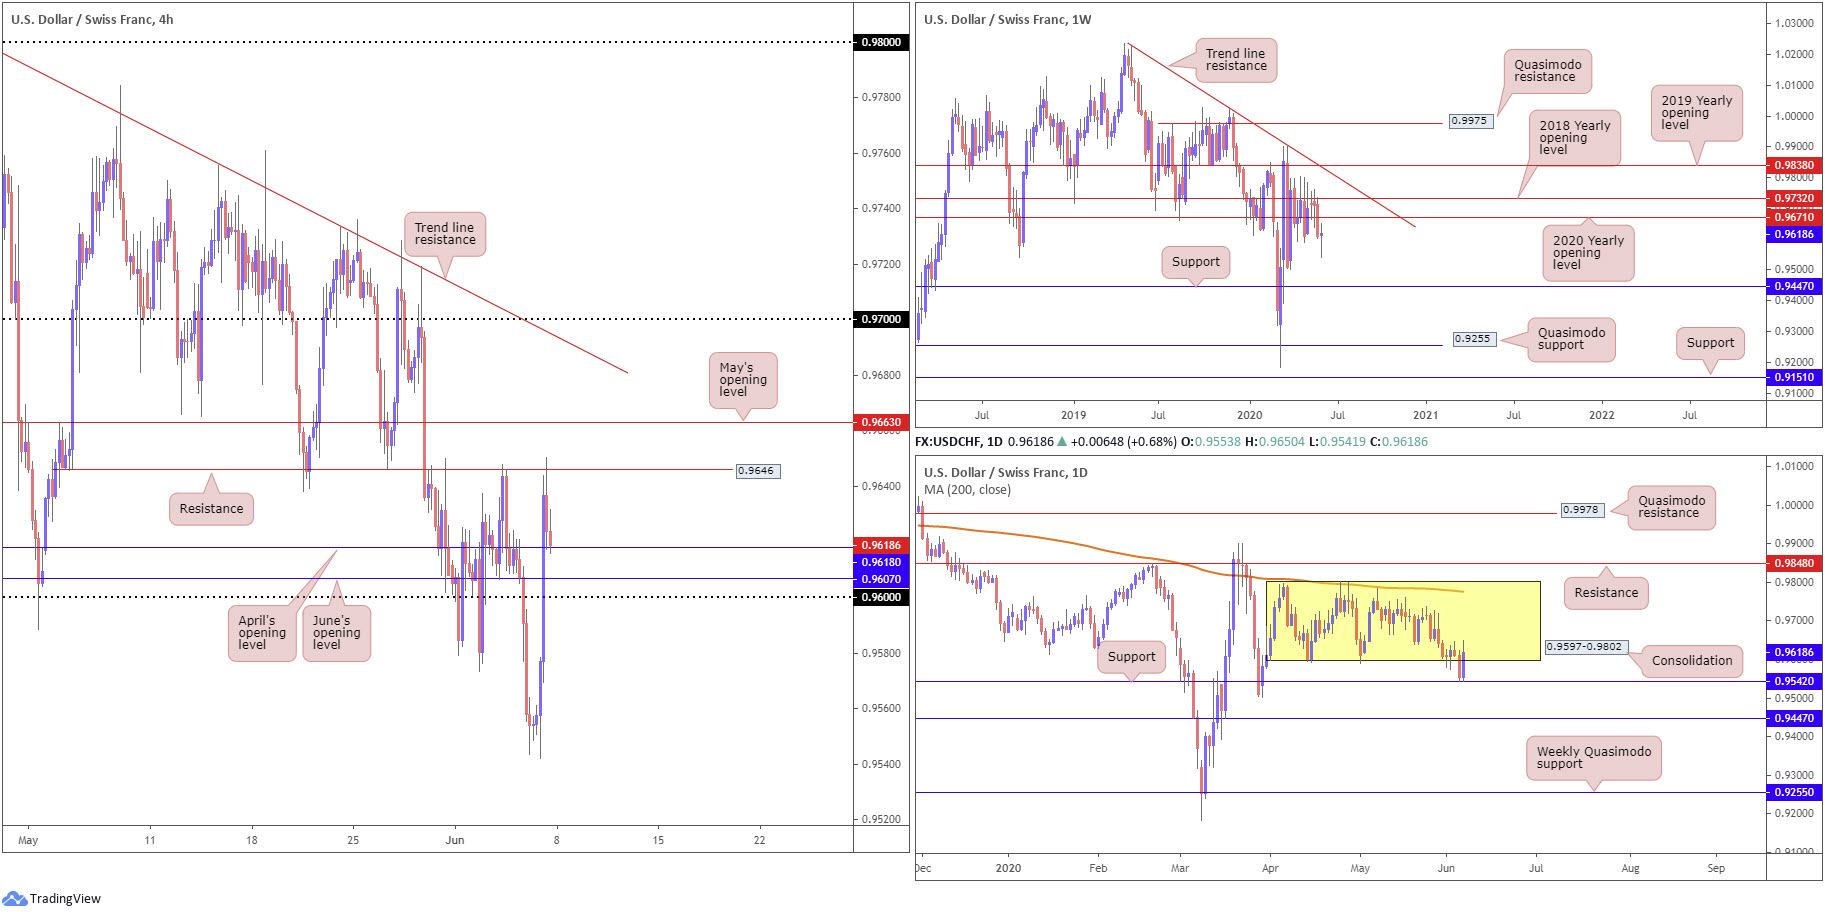
Despite longer-term flow observing an energetic prod below the 2020 yearly opening level at 0.9671 in recent weeks, sellers were unable to capitalise on downside momentum.
Last week chalked up an indecision candle, albeit with a slightly more pronounced tail than preferred. This leaves the pair exposed to a possible retest scenario at 0.9671 this week, and additional selling firing up a potential run to support at 0.9447.
Daily perspective:
Since early April, price action on the daily timeframe has consolidated between 0.9802/0.9597. Interestingly, the lower boundary came under fire into the tail end of the week, forged in the shape of a 2-candle fakeout off nearby support from 0.9542.
From a technical perspective, this may be adequate to secure a bullish position this week and kick price to 0.9671 on the weekly timeframe or, with a little oomph, the upper boundary of the daily range around 0.98ish.
H4 perspective:
Friday’s highly-anticipated US employment data unexpectedly soared in May, elevating USD/CHF through orders at 0.96, as well as June and April’s opening levels at 0.9607 and 0.9618, respectively, leading the way to resistance coming in at 0.9646.
Minor profit taking emerged off the aforementioned resistance, drawing April’s opening level back into the fray by the close. Holding here may spark an attempt to bring in May’s opening level at 0.9663, a base aligning closely with the 2020 yearly opening level on the weekly timeframe at 0.9671.
Areas of consideration:
Weekly price could effectively swing either way this week, though a retest at 0.9671 stands as the more likely direction having seen daily price wrap forming a bullish fakeout through the lower boundary of its range at 0.9597. Buyers, based on the H4 timeframe, therefore, may seek bullish positions from the supports on offer: April and June’s opening levels (0.9618 and 0.9607) and 0.96.
Breaking 0.96 this week, on the other hand, suggests sellers, particularly breakout sellers, may reassert their dominance, targeting daily support at 0.9542.
Dow Jones Industrial Average:
Weekly gain/loss: +6.10%
Weekly close: 27083
Weekly perspective:
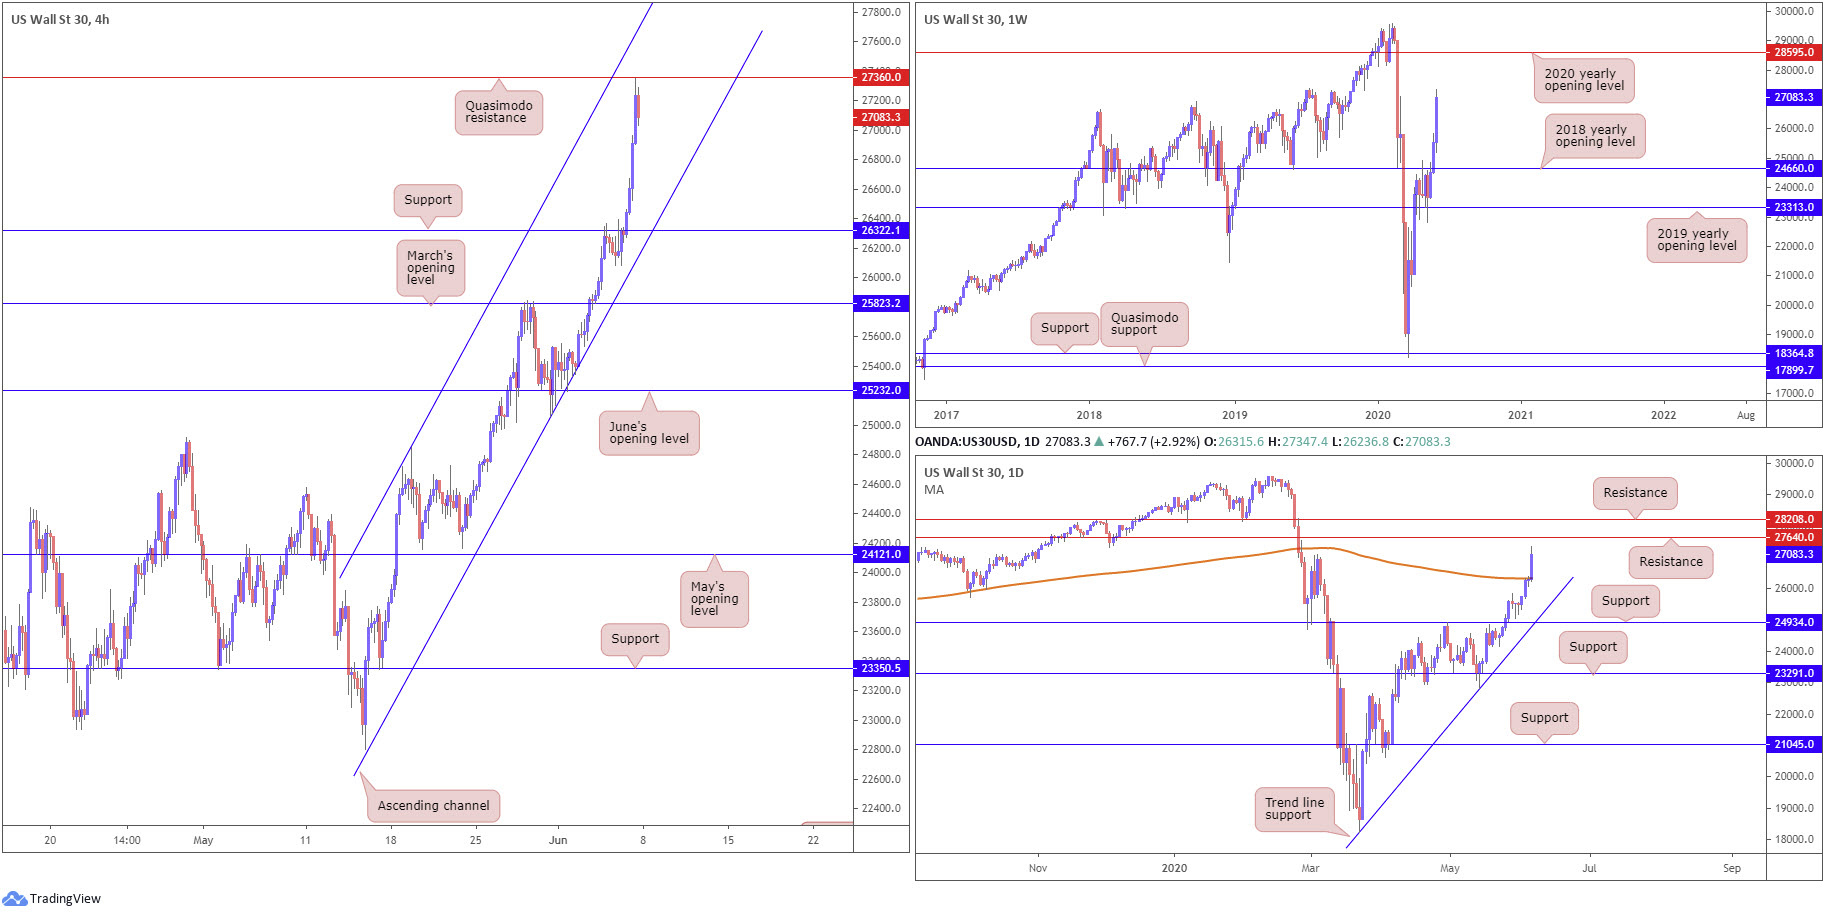
The resurgence of bidding over the past few weeks positions buyers in a fortunate position north of the 2018 yearly opening level at 24660. Sustained upside is likely this week, according to this timeframe, eventually drawing the candles to the 2020 yearly opening level at 28595.
Daily perspective:
Following a short-lived pause at the 200-day SMA (orange – 26341), buyers regained consciousness and dominantly sliced above the aforementioned SMA as well as marginally through the 27092 March 4 high. This may trigger a fresh wave of bullish sentiment this week, throwing light across to resistance at 27640 (prior Quasimodo support), followed by another layer of resistance at 28208. Therefore, weekly buyers may hit a few road bumps before making it to higher ground.
H4 perspective:
Major US benchmarks rallied Friday following an unexpected surge in US jobs in the month of May, raising hopes of an economic recovery. The Dow Jones Industrial Average climbed 829.16 points, or +3.15%; the S&P 500 rallied 81.58 points, or 2.62%, and the tech-heavy Nasdaq 100 concluded higher by 194.73 points, or 2.02%.
Technicals, based on the H4 timeframe Friday, had price action top just south of Quasimodo resistance at 27360, mildly paring gains into the closing bell. Stationed just under channel resistance, taken from the high 24849, this may encourage an intraday pullback today/early week until challenging either channel support, extended from the low 22803 or support at 26322.
Areas of consideration:
Having seen weekly price echo the possibility of moving higher, and daily price not expecting resistance to develop until 27640, H4 Quasimodo resistance at 27360 is unlikely to generate much downside.
Daily resistance at 27640 could be an angle to watch for possible countertrend opportunities this week, given it closely intersects with H4 channel resistance. Breaking through the named daily resistance, however, will likely see a rally to weekly resistance (2020 yearly opening level) at 28595 unfold.
XAU/USD (GOLD):
Weekly gain/loss: -2.76%
Weekly close: 1681.6
Weekly perspective:
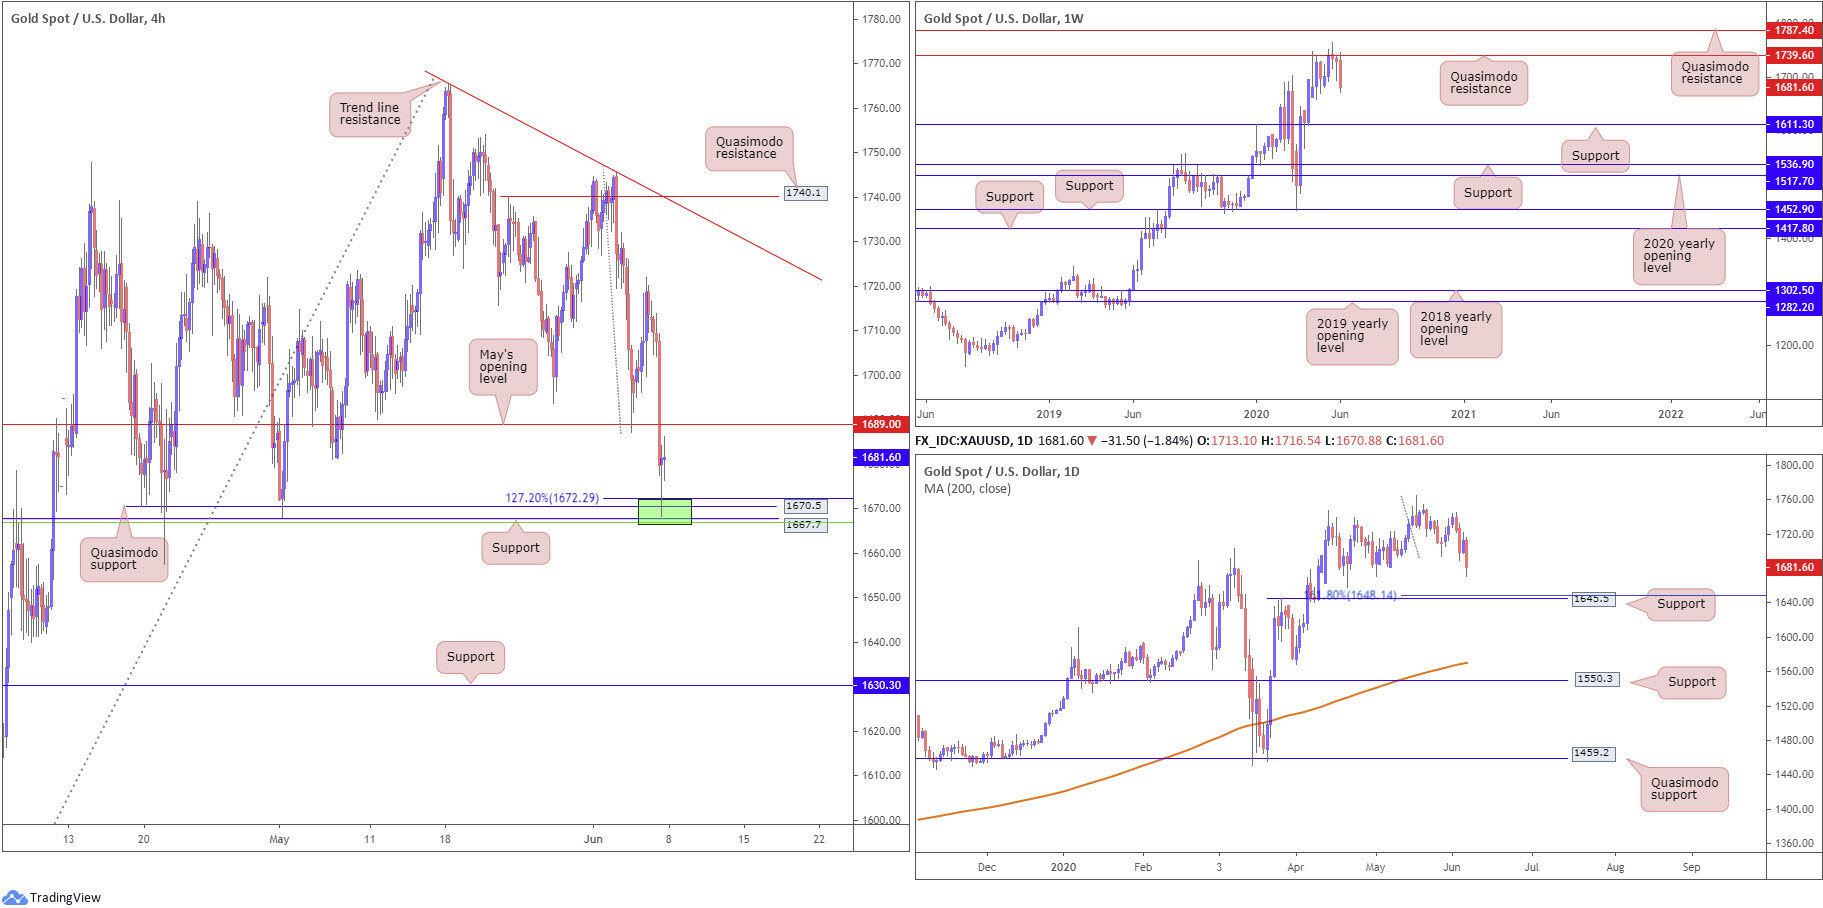
Shaped by way of a bearish outside pattern, buyers, once again, lost their flavour under Quasimodo resistance at 1739.6, capped since mid-April. Clearance of 1739.6 underlines another layer of Quasimodo resistance at 1787.4, while downside has support in view at 1611.3.
It may also interest some traders to note the trend on gold has faced a northerly trajectory since 2016.
Daily perspective:
Despite Thursday putting forward a bullish inside candle setup, bullion sunk Friday and spun focus back to support drawn from 1645.5. This is a level drawing a close connection to a 161.8% Fibonacci extension point at 1648.1.
H4 perspective:
Thanks to Friday’s surprising job’s data, demand for safe-haven assets diminished, including the yellow metal. This hauled H4 price through May’s opening level at 1689.0 and pierced into an area of support (green) made up of a Quasimodo formation from 1670.5, a support at 1667.7, a 127.2% Fibonacci extension at 1672.2 and a 50.0% retracement ratio at 1666.8 (green line).
Extending Friday’s recovery out of 1666.8/1672.2 could have price challenge, and potentially engulf, May’s opening level at 1689.0 for a run to trend line resistance, taken from the high 1765.1. Yet, dropping through the said support area highlights support coming in at 1630.3.
Areas of consideration:
With both weekly and daily timeframes perhaps directing candles to lower levels this week, it is questionable H4 price will be able to make much headway north of May’s opening level at 1689.0. As such, bearish strategies may be something to consider either off 1689.0 or under 1666.8/1672.2.
The accuracy, completeness and timeliness of the information contained on this site cannot be guaranteed. IC Markets does not warranty, guarantee or make any representations, or assume any liability regarding financial results based on the use of the information in the site.
News, views, opinions, recommendations and other information obtained from sources outside of www.icmarkets.com.au, used in this site are believed to be reliable, but we cannot guarantee their accuracy or completeness. All such information is subject to change at any time without notice. IC Markets assumes no responsibility for the content of any linked site.
The fact that such links may exist does not indicate approval or endorsement of any material contained on any linked site. IC Markets is not liable for any harm caused by the transmission, through accessing the services or information on this site, of a computer virus, or other computer code or programming device that might be used to access, delete, damage, disable, disrupt or otherwise impede in any manner, the operation of the site or of any user’s software, hardware, data or property.