EUR/USD:
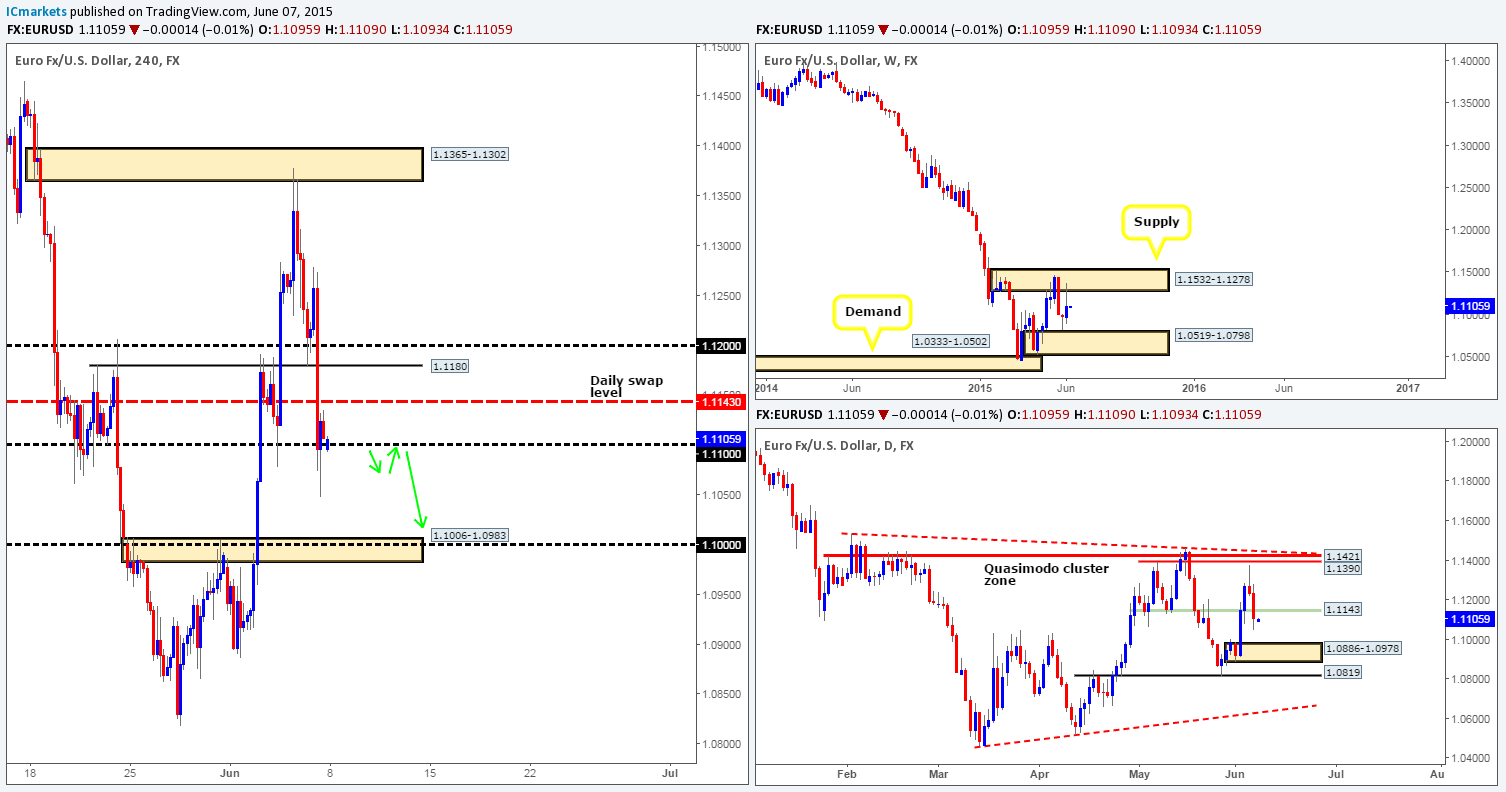
Weekly view – Last week’s action shows that price rebounded nicely from a weekly supply area seen at 1.1532-1.1278, consequently closing at 1.1107. In the event that this selling pressure continues, we may see price challenge the weekly demand area at 1.0519-1.0798 sometime this week.
From a long-term standpoint, however, the downtrend on this pair is still very much intact in our opinion, and will remain this way until we see a convincing push above the aforementioned weekly supply area.
Daily view: Following Thursday’s rebound from just below the daily Quasimodo cluster zone at 1.1390/1.1421, price continued to sell off going into Friday’s session as the U.S economy announced 280k new jobs were generated in May. This move, as you can see, completely engulfed the daily swap level 1.1143, and has potentially set the stage for a continuation move south this week down to at least the daily demand area coming in at 1.0886-1.0978.
4hr view: Friday’s sell off took out several 4hr technical levels during its onslaught. It was only once price connected with the 1.1100 region did we see the market begin to stabilize.
There were no big changes over the weekend as price opened at 1.1095 – only twelve pips below Friday’s close at 1.1107. With everything taken into consideration, the psychological number 1.1100 will likely remain an influential level for our team during today’s trading. Risk/reward considerations would argue against entering long from this level, especially with the daily swap barrier looming just above at 1.1143.
Ultimately, we’re looking for the Euro to close below 1.1100 today, as the path south would then likely be clear for price to challenge the 4hr swap area coming in at 1.1006-1.0983 sometime this week. A close below 1.1100 would, in effect, be our cue to begin watching for price to retest this number as resistance. As long as there is some sort of lower timeframe sell signal accompanying this retest, our team would have little hesitation shorting this market as per the green arrows.
Levels to watch/live orders:
- Buys: Flat (Predicative stop-loss orders seen at: N/A).
- Sells: Flat (Predicative stop-loss orders seen at: N/A).
GBP/USD:
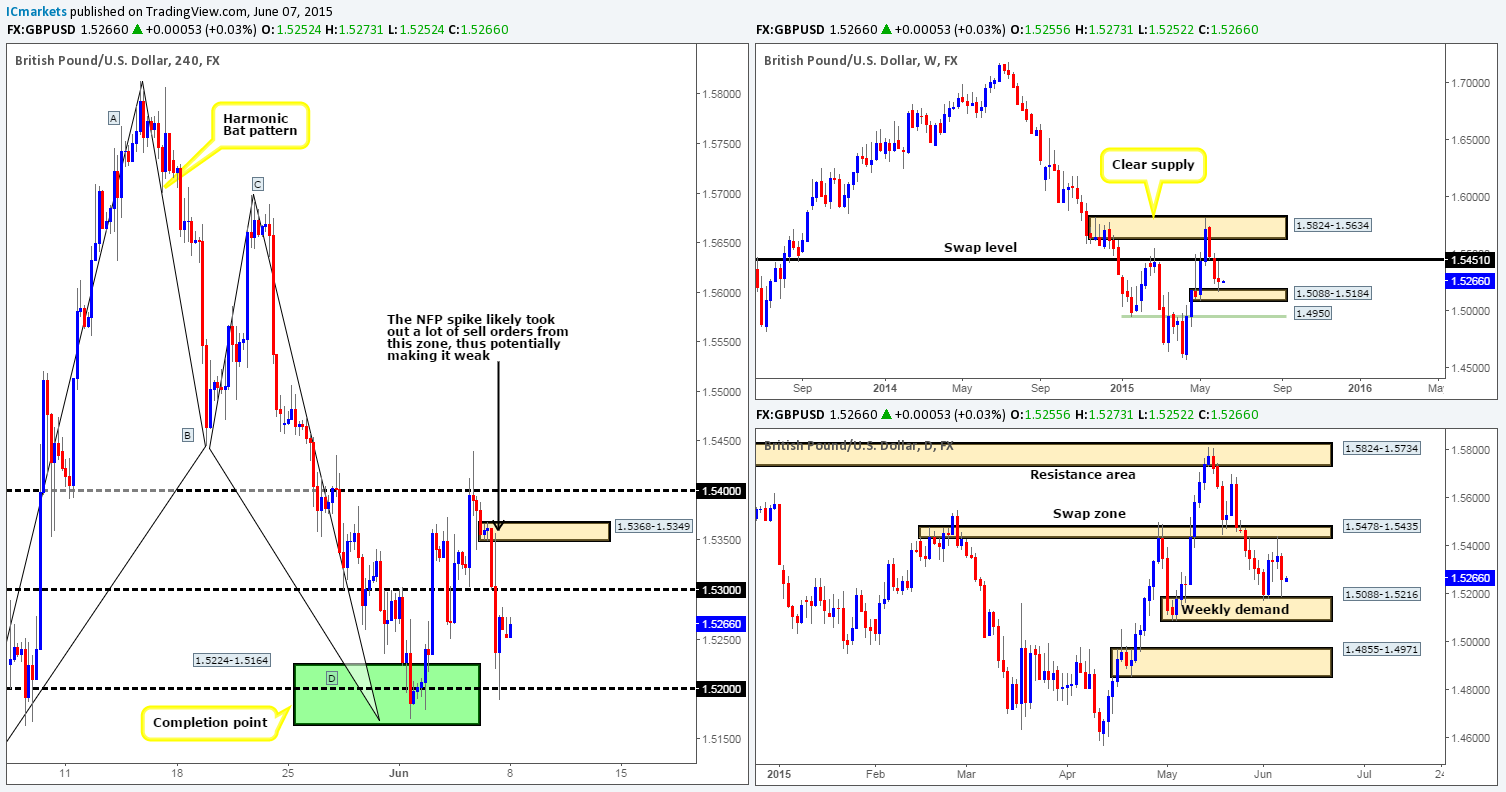
Weekly view – Last week’s trading shows that price rebounded from a weekly demand area seen at 1.5088-1.5184, forcing the market to close at 1.5260. The rebound from this zone was sluggish at best in our opinion. As such, we have to be prepared for the possibility that this area of demand may give way this week. It will be interesting to see what the lower timeframes have to offer…
Daily view: Thursday’s rebound from the daily swap area seen at 1.5478-1.5435 saw price continue to sell off going into Friday’s session following positive NFP data. This, as a result, forced the GBP to tie up with the weekly demand area just mentioned above. This weekly zone, as you can see from this timeframe, was already tested at the beginning of last week, thus buy-side liquidity could potentially be weak here.
4hr view: From this angle, we can see that the recent descent on this pair took out 1.5300, and collided into 1.5200, which was clearly enough to support a counter-attack back up to the 1.5270 region. For anyone who followed our recent GBP long trade (1.5228) from the 4hr Harmonic Bat completion area seen in green at 1.5224-1.5164 (located around the upper limits of the aforementioned daily demand area), you will likely recall that we took 70% of the position off at 1.5400 and set our stop at breakeven which has now obviously been taken out.
The GBP remained unaffected over the weekend. Price opened at 1.5255 – five pips lower than Friday’s close 1.5260. Considering the market’s overall position on the higher timeframes at the moment (see above), the near-term 1.5300 number will likely play a key role in the market today. If price rallies to test 1.5300, which we believe it will, and this level holds as resistance, there is (dependent on the approach of course) likely going to be a shorting opportunity from here down to 1.5200 this week. However, by selling at this level, you’re possibly going against higher timeframe buying opposition residing around both the weekly and daily demand (see above) zones. Therefore, waiting for lower timeframe confirmation and keeping a close eye on any open positions from here is highly recommended.
If, on the other hand, price manages to get above 1.5300 today, we could see a rally up towards 1.5400 this week. We’re not ignoring the small 4hr supply area at 1.5368-1.5349; we simply believe this zone may be weak from Friday’s NFP spike seen marked with a black arrow at 1.5357. For us to be given the ‘green light’ to enter long following a close above 1.5300, we would need to see not only a retest of this number as support but also corresponding lower timeframe bullish confirmation before risking capital on any buy trades here.
Levels to watch/ live orders:
- Buys: Flat (Predicative stop-loss orders seen at: N/A).
- Sells: 1.5300 [Tentative – confirmation required] (Predicative stop-loss orders seen at: dependent on where one confirms this level).
AUD/USD:
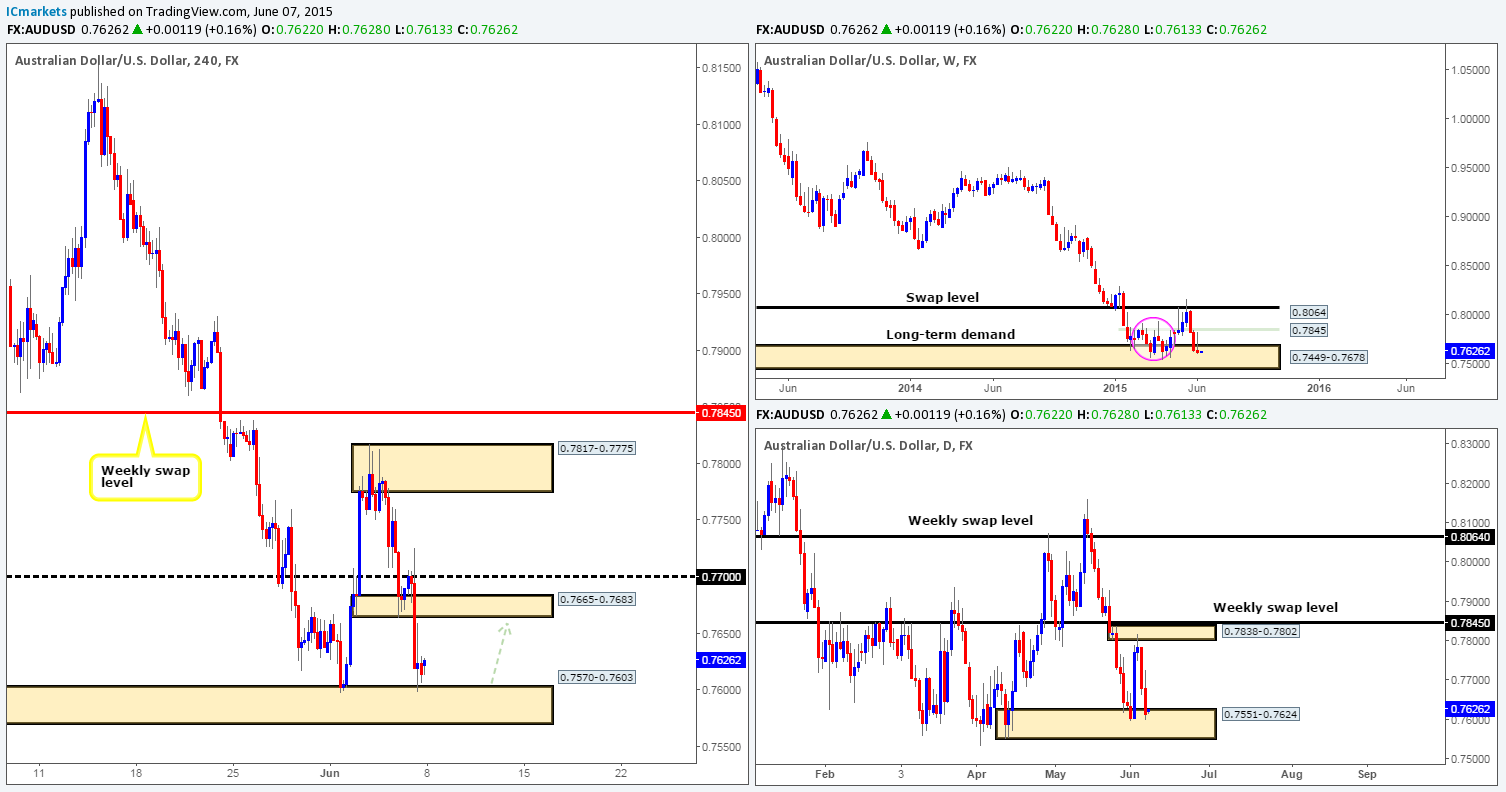
Weekly view – Following the push seen into the weekly demand area at 0.7449-0.7678, last week’s trading action shows that price printed an inverted weekly pin-bar candle, resulting in the AUD/USD pair closing at 0.7614. To some traders this may be a sign that the market wants higher prices – a reversal signal, and they could very well be right considering where the candle pattern formed. Nevertheless, Judging by the sloppy reaction seen (pink circle – 02/02/15-06/04/15) at this zone a few months earlier, things could potentially get messy here before we see any decisive move take place.
From a long-term perspective, the trend direction on this pair is still very much south in our opinion, and will remain this way until we see a convincing break above 0.8064.
Daily view: The rebound from the small daily supply area seen at 0.7838-0.7802 saw price extend lower on Friday after positive NFP data hit the wire. This move, as you can clearly see, forced the market clash with a daily demand area at 0.7551-0.7624 going into the weekly close.
4hr view: The 4hr timeframe shows that before Friday’s sell off took place; a vicious spike north was seen above the 0.7700 handle which was likely a hunt for liquidity. The descent, however, saw price consume a 4hr demand area at 0.7665-0.7683, and as a result connected with another 4hr demand zone at 0.7570-0.7603 (located within the aforementioned daily demand area) where price action begun to stabilize.
The market opened eight pips higher than Friday’s close (0.7614) at 0.7622, suggesting no big changes took place over the weekend.
On the grounds that price is currently dancing within both weekly and daily demand areas (see above) at the moment, our attention will mostly be driven toward longs today. Entering into a buy position from the current 4hr demand zone is certainly something our team is interested in taking part in. However, we have no intention to enter at market here as we could see price drive deeper into this 4hr area before the price rallies. Therefore, waiting for lower timeframe confirmation is a MUST for our team here. Should everything go to plan, and we find a suitable entry long from this 4hr demand zone, we’ll look to take our first profits at the 4hr swap/round number area at 0.7665-0.7683/0.7700. And if we clear this barrier, final profits will be taken around the 0.7817-0.7775 4hr supply (located within the aforementioned daily supply area).
Levels to watch/ live orders:
- Buys: 0.7570-0.7603 [Tentative – confirmation required] (Predicative stop-loss orders seen at: 0.7565).
- Sells: Flat (Predicative stop-loss orders seen at: N/A).
USD/JPY:
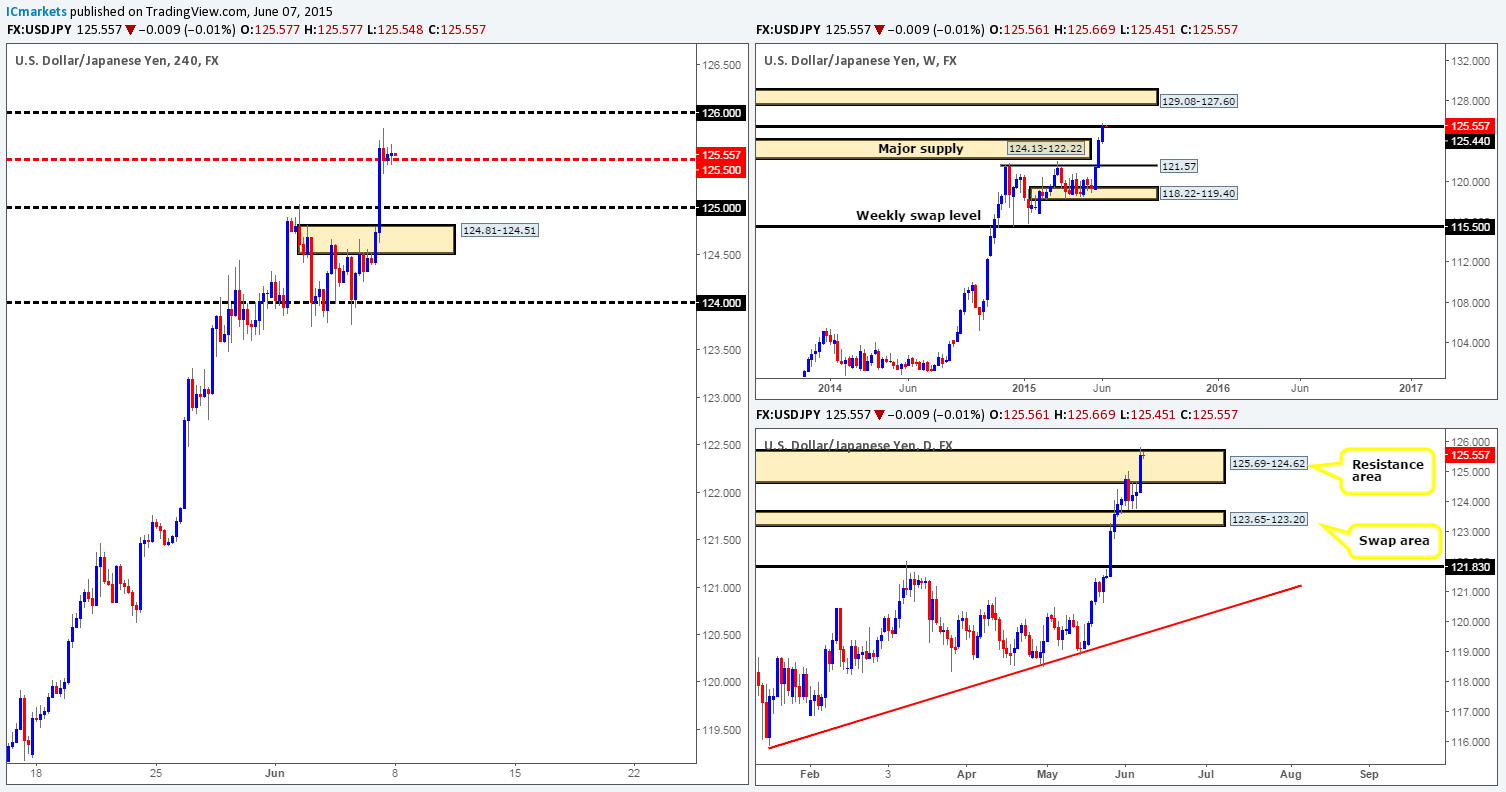
Weekly view – The weekly timeframe shows that price has now rallied for three consecutive weeks, consequently taking out a weekly supply area at 124.13-122.22, and marrying up with a weekly swap level at 125.44 going into the close 125.561. In the event that we do not see any response from the sellers around this weekly swap barrier this week, the market will then likely continue to trend north up towards the weekly supply area sitting at 129.08-127.60.
Daily view: From this angle, we can see that price peeked above the daily resistance area at 125.69-124.62 during Friday’s session on the back of positive NFP numbers. In the event that this move took out most of the stops above this zone (in this case buy stops), the path north will then, as far as we can see, be relatively clear up to a daily supply area coming in at 128.40-127.29. It will be interesting to see what the 4hr timeframe has to offer…
4hr view: Friday’s rally, as you can see, consumed multiple 4hr technical levels, and eventually closed six pips above the mid-level number 125.50 at 125.561. Little change was seen over the weekend as the price opened very close to Friday’s close at 125.566.
Taking all of the above into account, the focal point for today will firmly be focused on how price behaves around 125.50. In the event that this number holds as support, we may see further upside towards 126.00. A move such as this will also likely confirm BUYING strength around both the current daily resistance area and weekly swap level (see above for levels), and as a result promote further buying in this market going into the week. On the flip side, if 125.50 gives way, the path south will then likely be free down to at least 125.00, which, at the same time will also possibly confirm SELLING strength from the aforementioned higher timeframe zones.
Therefore, to conclude, if lower timeframe buying confirmation is seen at 125.50, we will take a long position targeting 126.00 as a first take-profit target. If 125.50 gives way and is retested as resistance, we’ll look to short (with lower timeframe confirmation) down to our first take-profit target 125.00.
Levels to watch/ live orders:
- Buys: 125.50 [Tentative – confirmation required] (Predicative stop-loss orders seen at: dependent on where one confirms this level).
- Sells: Flat (Predicative stop-loss orders seen at: N/A).
USD/CAD:
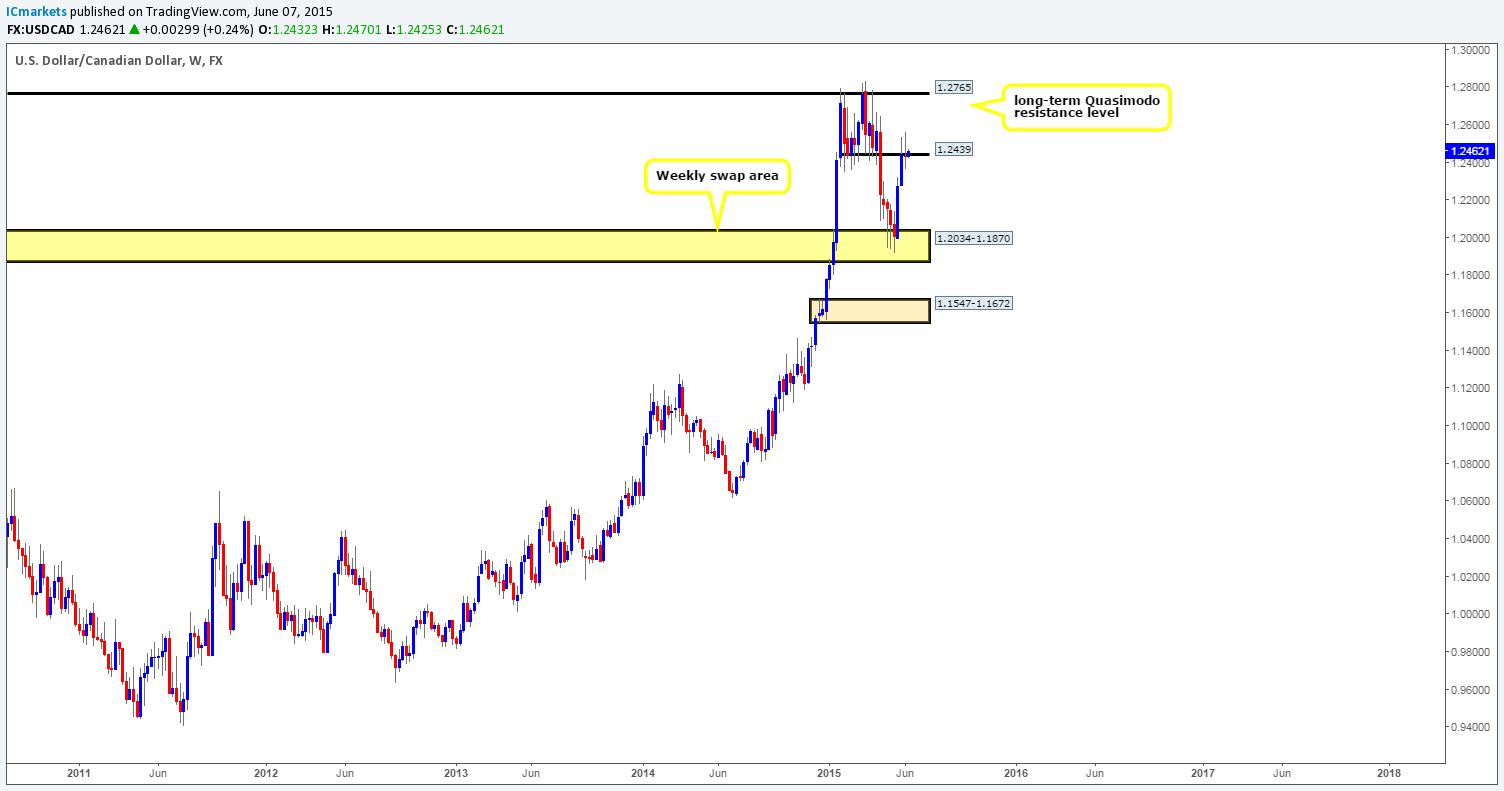
Weekly view – Overall, our long-term bias on this pair is long. It will only be once we see a break below the weekly swap area 1.2034-1.1870 would our present bias likely shift.
Last week’s trading, however, shows that the buyers and sellers were seen pulling for position around a weekly swap level coming in at 1.2439. A sustained move above this number this week would likely force the market north to test a weekly Quasimodo resistance level at 1.2765. Conversely, should the sellers be victorious here, its likely price will slip down towards the aforementioned weekly swap area.
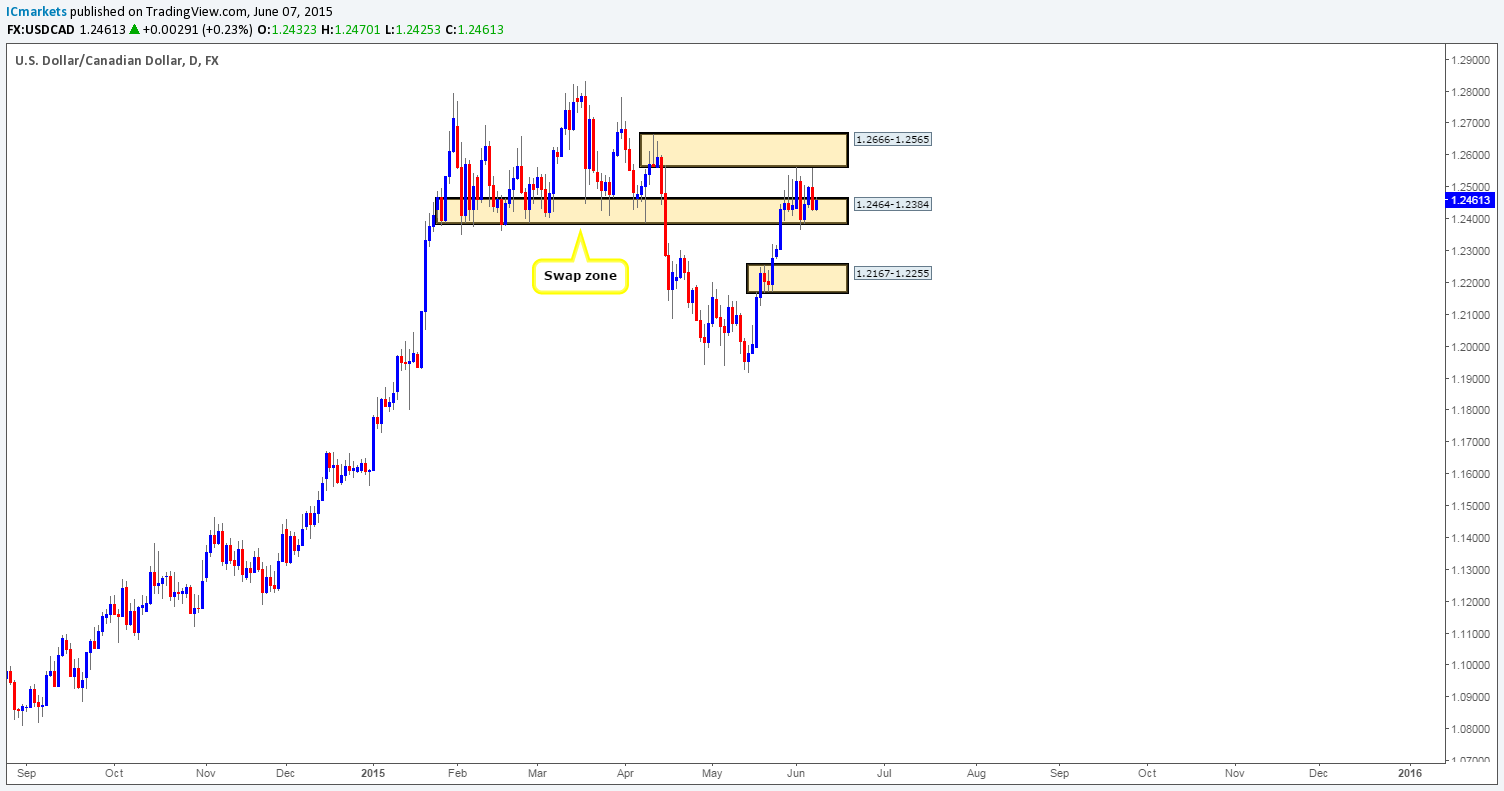
Daily view: Technically, there has been little change seen on this timeframe over the past week and a half. Price continues to trade in between the confines of a small range formed by a daily supply area at 1.2666-1.2565 and a daily swap zone seen at 1.2464-1.2384.
USD/CHF:
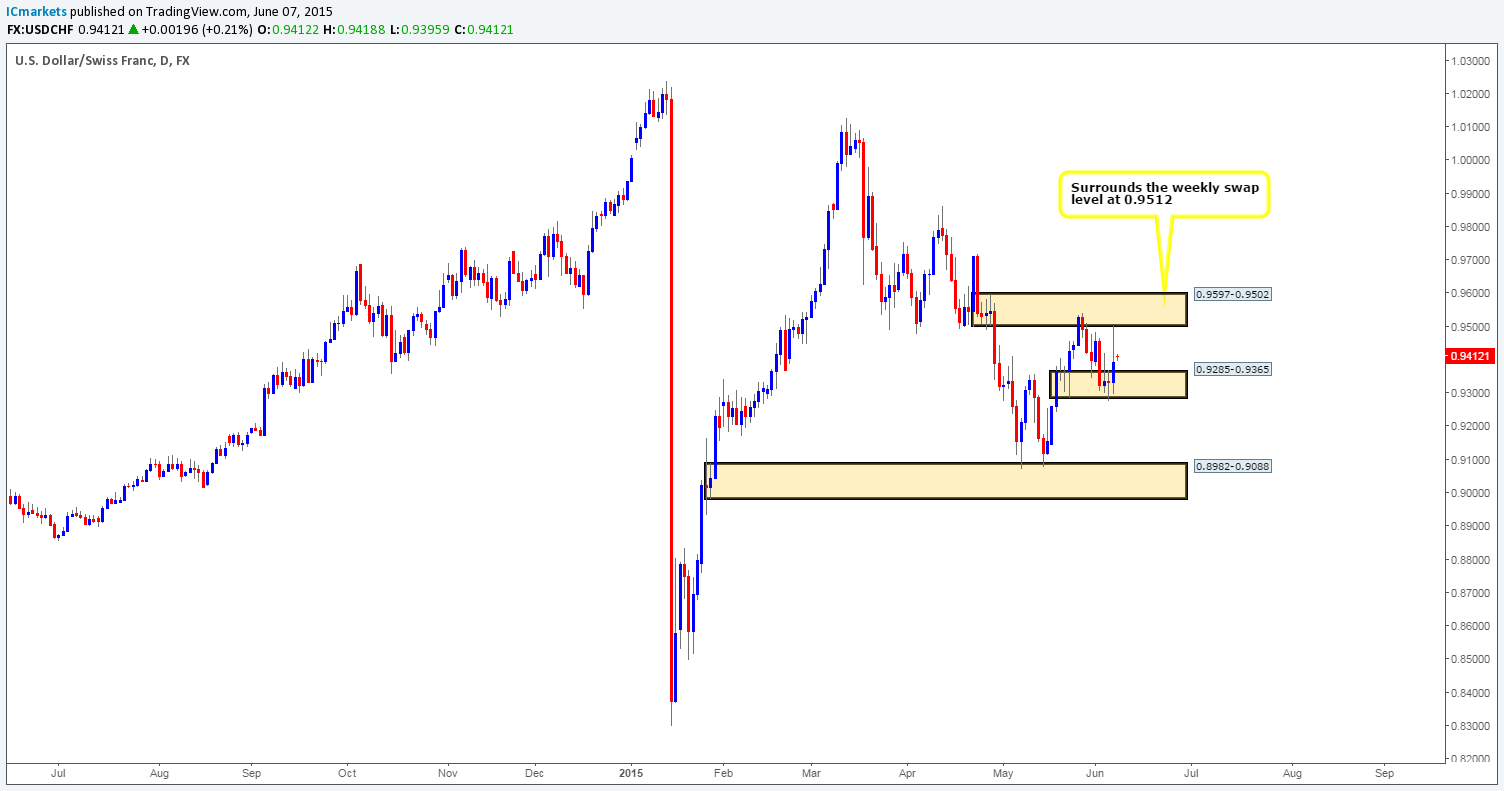
Weekly view – Last week’s trading shows that the USD/CHF pair managed to hold out below the weekly swap level at 0.9512, which as you can probably see, formed a weekly indecision candle into the close 0.9392. Provided that the sellers can maintain a position here this week, there’s a good chance we may see this market continue to weaken down to the weekly swap area seen at 0.9074-0.9000.
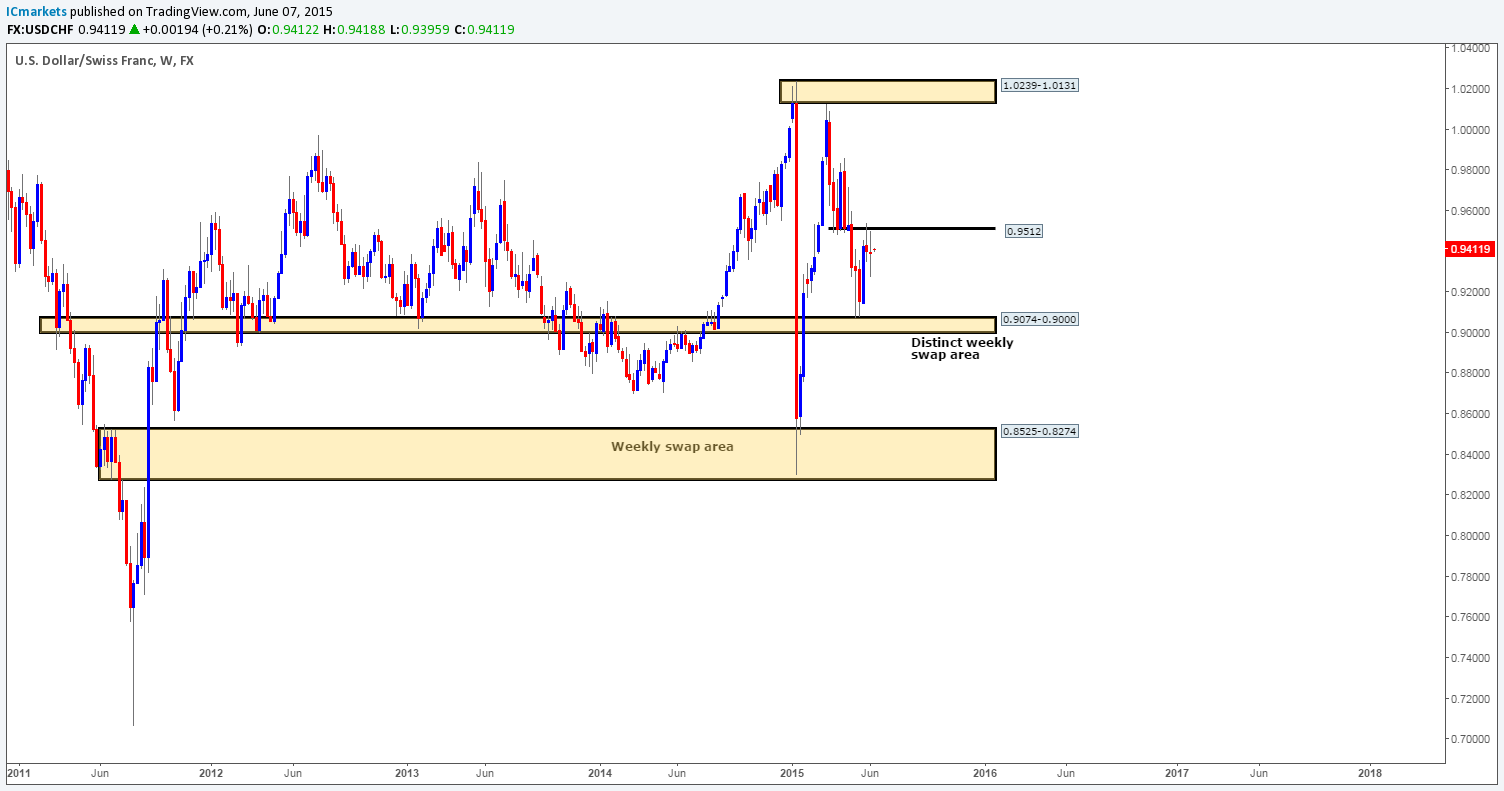
Daily view: This timeframe, however, reveals that price remains capped by a daily supply area at 0.9597-0.9502 (surrounds the aforementioned weekly swap level), and a daily demand area seen at 0.9285-0.9365.
US 30:
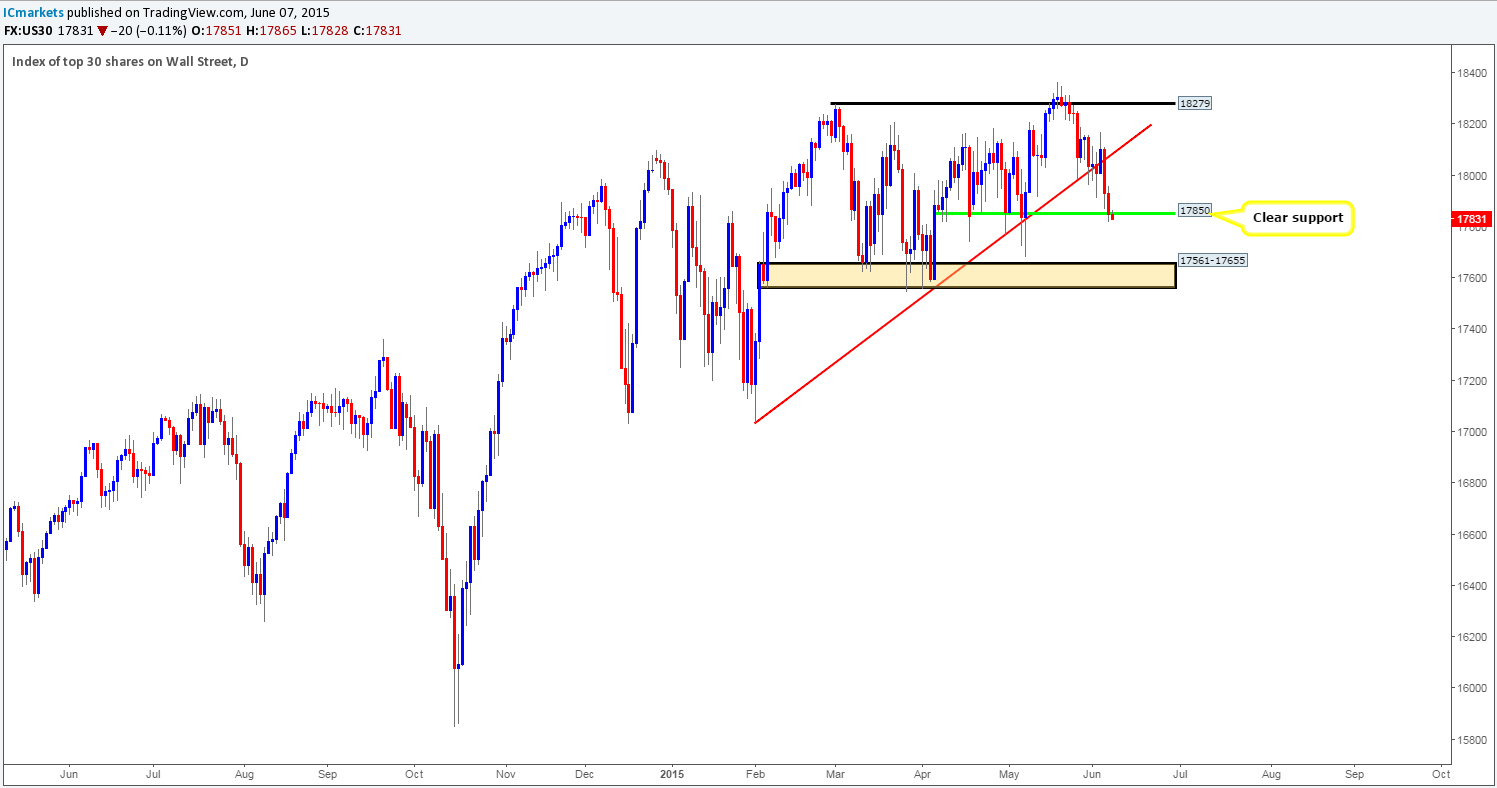
Weekly view – The DOW index fell for a second consecutive week last week, consequently forcing this market to close at 17851. Should this selling continue going into this week, it is likely that price will clash with the weekly swing low coming in at 17556. Despite this recent decline in value, however, this index is still in a very strong uptrend in our opinion, and will remain that way until we see a convincing break below 17135.
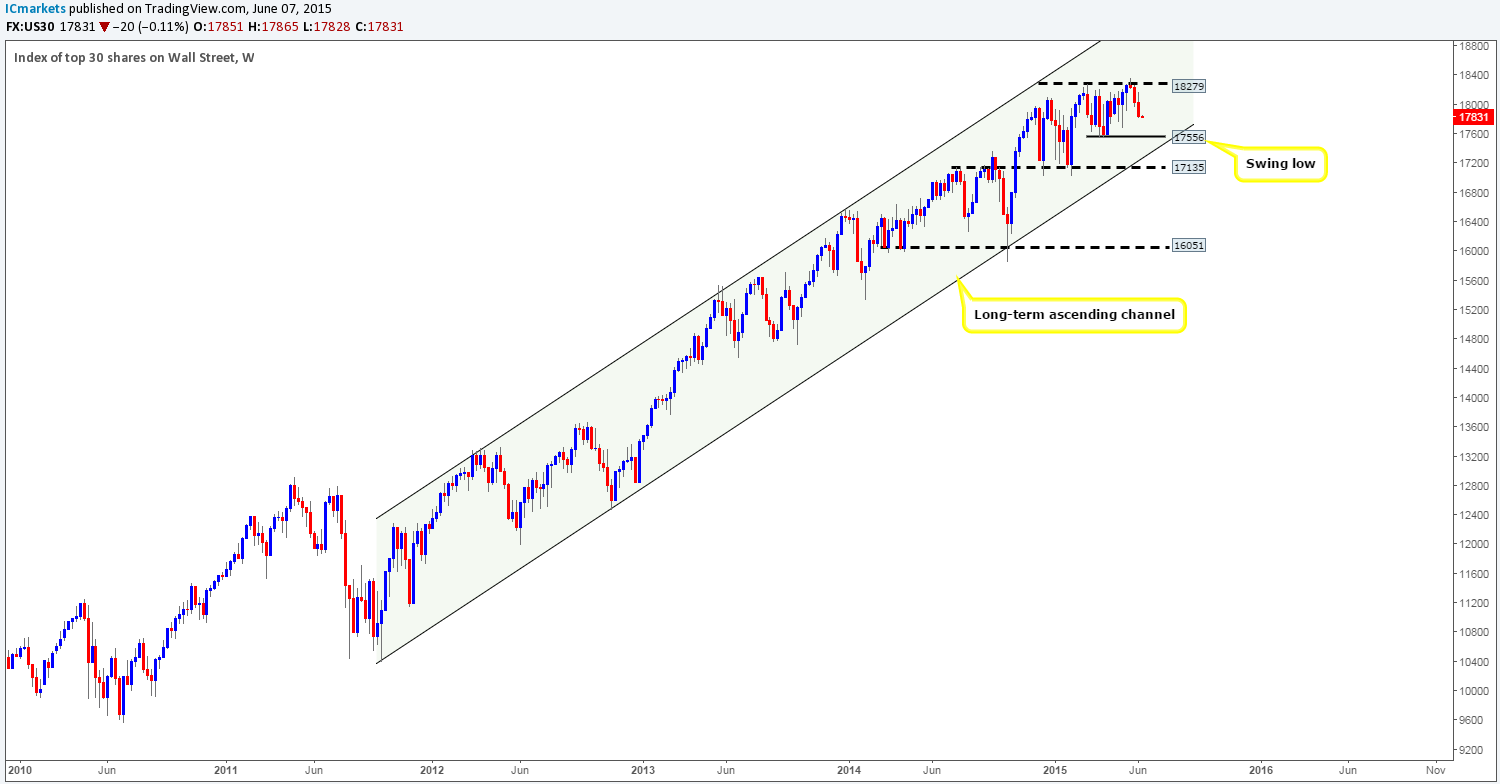
Daily view: Thursday’s close below the daily trendline taken from the low 17033 saw the market continue to tumble going into Friday’s session. As a result, price was forced to interact with a daily support level coming in at 17850, which, as you can see, remains a key obstacle to price hitting the daily buy zone seen just below it at 17561-17655 (encapsulates the aforementioned weekly swing low).