
A note on lower timeframe confirming price action…
Waiting for lower timeframe confirmation is our main tool to confirm strength within higher timeframe zones, and has really been the key to our trading success. It takes a little time to understand the subtle nuances, however, as each trade is never the same, but once you master the rhythm so to speak, you will be saved from countless unnecessary losing trades. The following is a list of what we look for:
- A break/retest of supply or demand dependent on which way you’re trading.
- A trendline break/retest. Buying/selling tails – essentially we look for a cluster of very obvious spikes off of lower timeframe support and resistance levels within the higher timeframe zone.
- Candlestick patterns. We tend to only stick with pin bars and engulfing bars as these have proven to be the most effective.
For us, lower timeframe confirmation starts on the M15 and finishes up on the H1, since most of our higher timeframe areas begin with the H4. Stops usually placed 5-10 pips beyond your confirming structures.
EUR/USD:
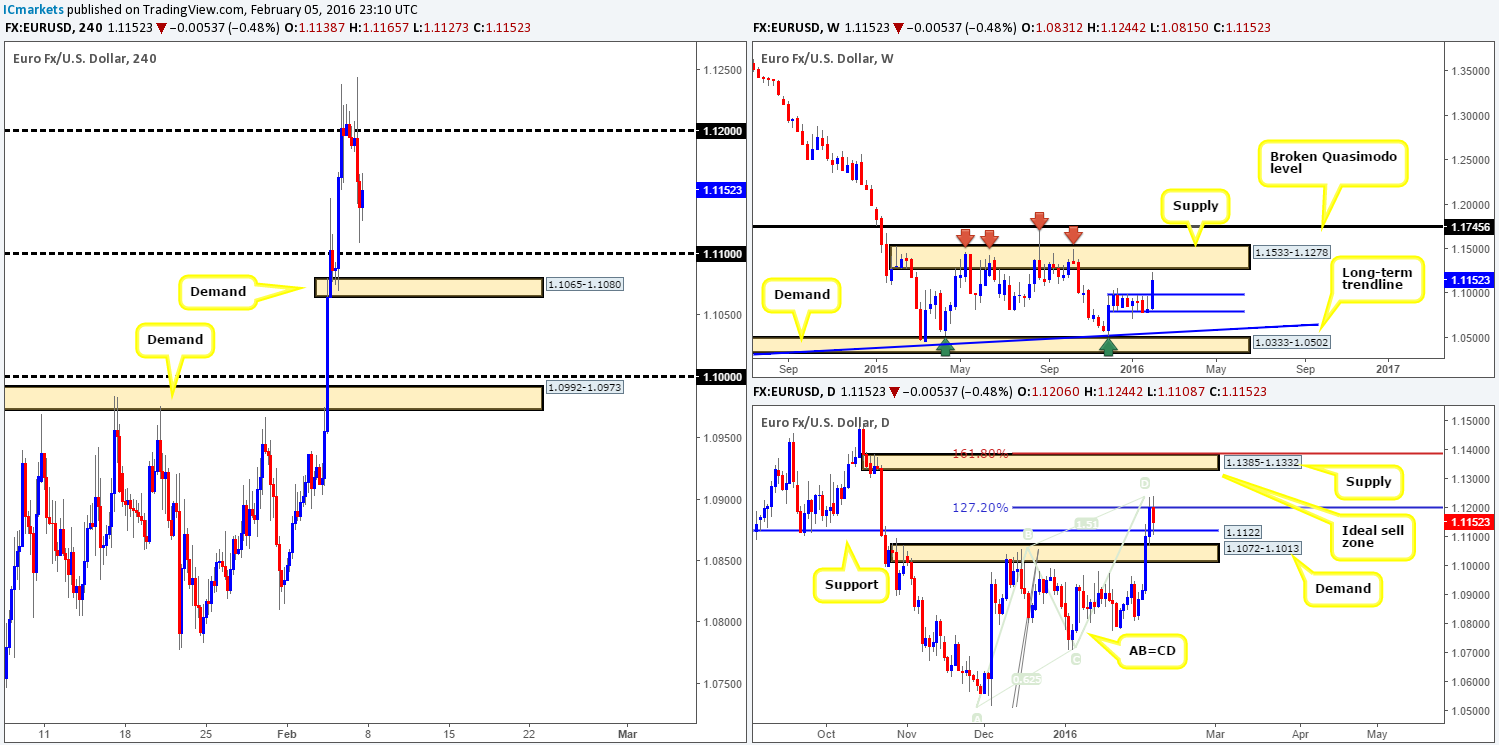
It’s amazing what a new week of trading can bring! For the past two months the EUR has been consolidating between weekly support at 1.0796 and resistance drawn from 1.0983. This week however, saw prices advance over 320 pips into the close 1.1152. This has, as you can see, placed price now within shouting distance of a major area of weekly supply at 1.1533-1.1278, so do keep an eye on this zone this week!
Moving down to the daily timeframe, we can see that a very clear Harmonic AB=CD bear pattern begun forming last week. As we mentioned in Friday’s report, our sell zone for this formation is fixed between the 127.2% Fibonacci level at 1.1197 and the 161.8% at 1.1387. As can be seen from the chart, there has already been a slight reaction to the underside of this area, forcing the single currency to test support below it at 1.1122. Despite this small sell-off, we still believe this bearish pattern is in play as it has not yet fully completed in our opinion.
With that being the case, we firmly believe that the daily supply zone painted above at 1.1385-1.1332 (the upper area of our Harmonic sell zone which also sits within the above said weekly supply) is by far the more logical sell area at the moment. Shorting from the 127.2% would have required an enormous stop loss – not really what we were looking to get into on a Friday if we’re honest.
On to the H4 chart, Friday’s employment report came in worse than expected at 151k initially spiking prices to fresh highs of 1.1244 before collapsing down to lows of 1.1108. Unless we see further selling this week of course, the H4 will be taking a back seat as our focus remains on the daily supply mentioned above
Something to watch for on the H4 though, which may give us a clue this week as to whether our daily supply will be hit is a close above psychological resistance 1.1200. Conversely, should the market close below the small H4 demand at 1.1065-1.1080, we can pretty much conclude that our daily zone will not likely come into play this week and then look to reassess our position.
Going into the new week, our orders remain the same – a pending sell placed at 1.1330 and a stop just above our daily zone at 1.1395. As of now, the first take-profit level can be seen on the daily timeframe at 1.1122 which was hit on Friday.
Levels to watch/live orders:
- Buys: Flat (Stop loss: N/A).
- Sells: 1.1330 [Pending order] (Stop loss: 1.1395).
GBP/USD:
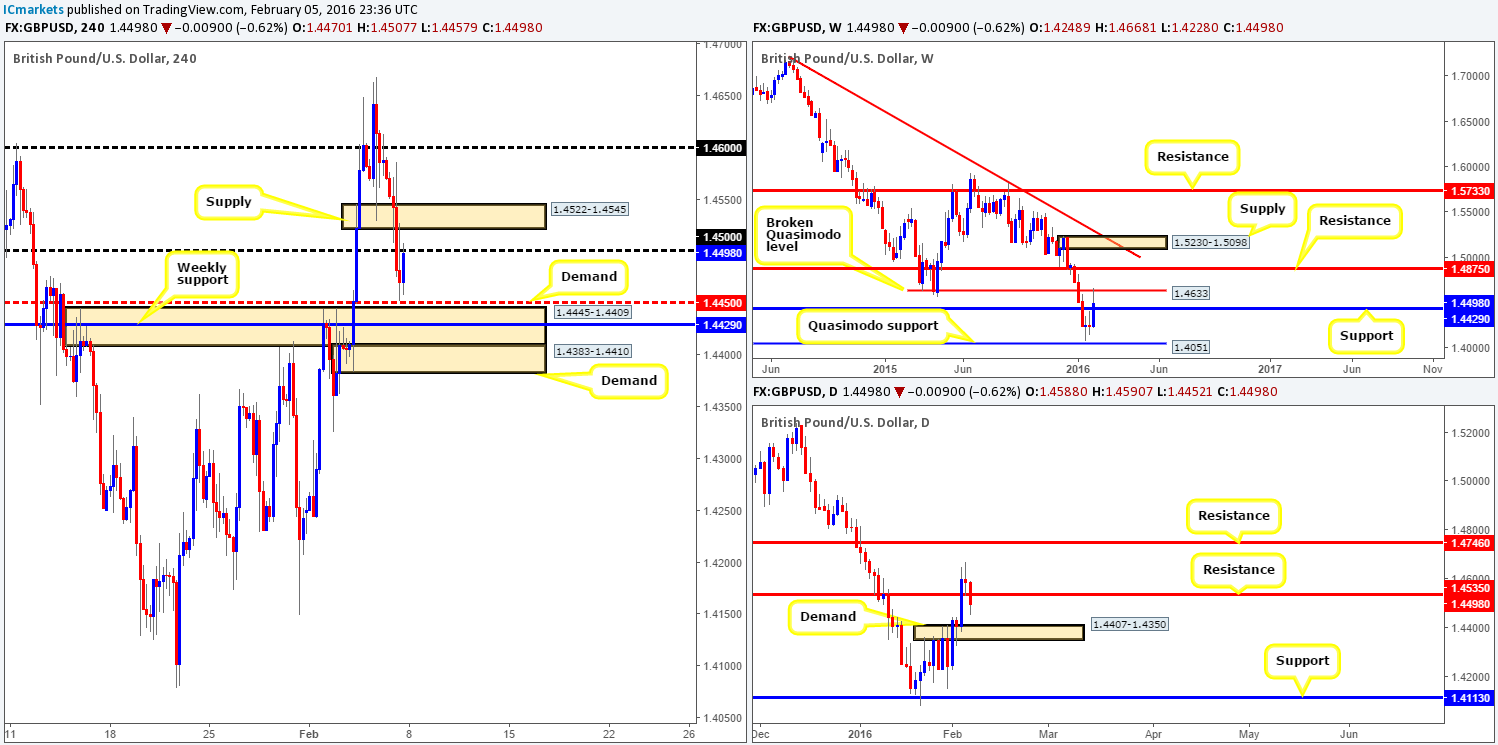
Following back-to-back weekly indecision candles Cable propelled itself north last week. A 250-pip gain was recorded by the close 1.4498, which saw this unit connect with a broken weekly Quasimodo (BQM) level at 1.4633 and slightly pullback into the week’s end. Weekly action, as we can all see, still remains above support at 1.4429 thus may cause problems to anyone short this week. It will be interesting to see what the lower timeframes have to offer…
Zooming in and looking at the daily picture, a bearish close was seen below support (now acting resistance) at 1.4535 on Friday. This, as a consequence, likely clears the path south down to demand printed at 1.4407-1.4350. Now, this area of value sits just below the aforementioned weekly support barrier discussed above, so we’d recommend keeping a tab on this daily zone this week.
Stepping down to the H4 timeframe, price made a quick run to highs of 1.4586 on Friday shortly after the NFP report was released, then, like the EUR, cascaded lower. Demand (now supply) at 1.4522-1.4545 and psychological support 1.4500 were taken out during this sell-off, which ended with price putting in a low of 1.4452 and retesting 1.4500 into the weekend.
Although selling has been seen from the weekly BQM base (see above), our team is still very interested in the aforementioned weekly support this week. Not only does it sit just above daily demand at 1.4407-1.4350, it is also housed within a H4 demand at 1.4445-1.4409. However, to be on the safe side, we’d advise not to take a buy position here without confirming support from the lower timeframes as it is very difficult to know whether the sellers will run with the bounce seen from the weekly BQM.
Levels to watch/live orders:
- Buys: 1.4429 [Tentative – confirmation required] (Stop loss: dependent on where one confirms this area).
- Sells: Flat (Stop loss: N/A).
AUD/USD:
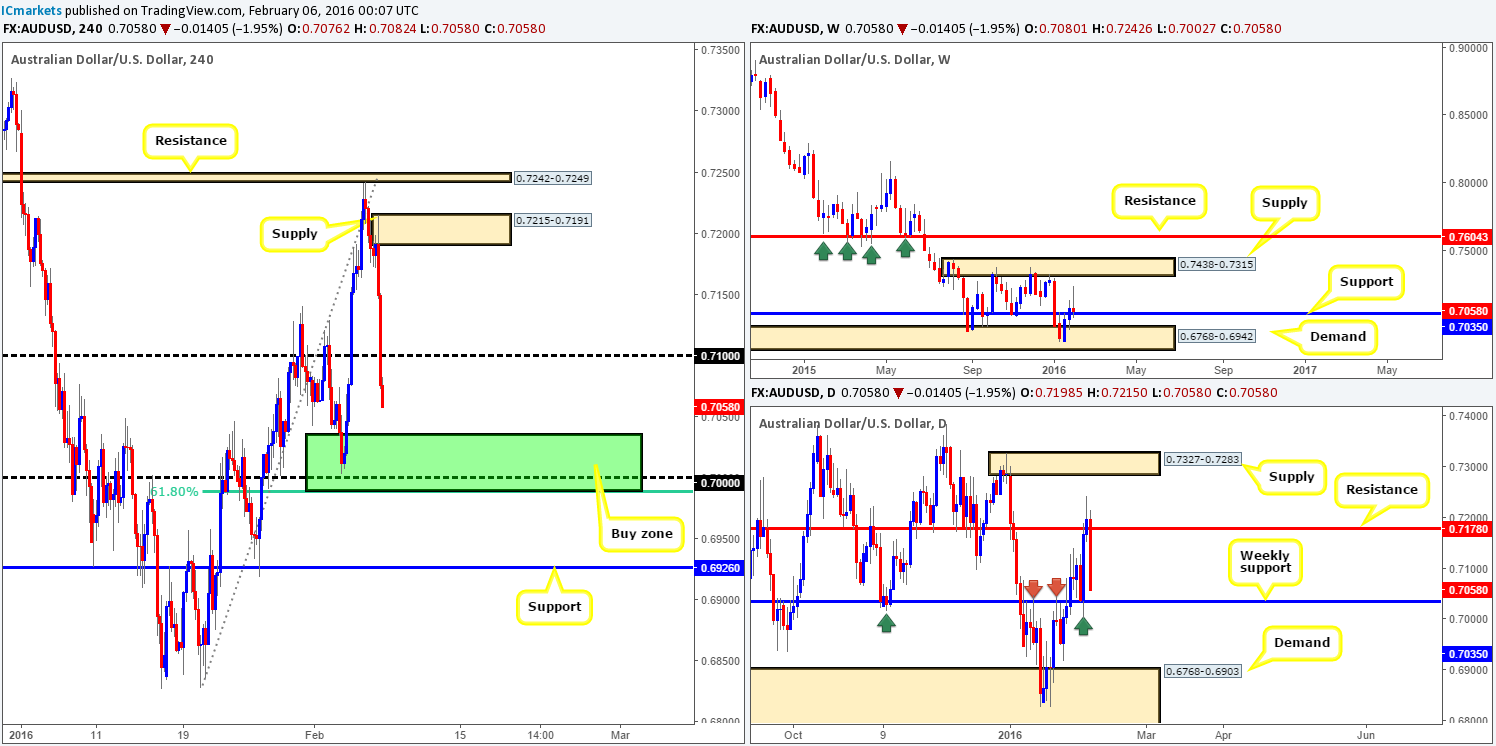
The past week saw the weekly chart paint a rather vicious-looking selling wick from highs of 0.7242. In spite of this, price failed to close below support drawn from 0.7035 ending the week relatively unchanged by the close 0.7058. Therefore, it’s highly likely that this weekly support barrier will come into play this week, so you might want to take a note of this number
Looking at the daily chart, one can see two things. Firstly, the Aussie was relatively bullish up until Friday which saw the pair decline in value around 140 pips (open/close). Secondly, check out how responsive the aforementioned weekly support has been in the past on the daily timeframe (see arrows). Each time price visited this barrier, a sizable reaction was seen.
A quick look at Friday’s sessions on the H4, however, shows that following the NFP release a quick jab north to highs of 0.7215 was seen, before plummeting lower and closing the day beyond psychological support 0.7100.
With all of the above taken into consideration, our team has their eye on the 0.7000 region this week for potential buys due to the following reasons:
- By and of itself, 0.7000 is a number watched by a huge amount of traders thus is expected to hold as support.
- Just beneath this 0.7000 sits a 61.8% Fibonacci level at 0.6989.
- 35 pips above 0.7000 lurks the weekly support mentioned above.
The bounce from this barrier could possibly be large, so we’re willing to be patient here. Our buy zone is fixed between 0.7035/0.6989 (green rectangle). One could enter at market within this zone without waiting for confirmation in our opinion, but, us being conservative we have chosen to look to the lower timeframes for our entry since we want to get in as low as possible on this one.
Levels to watch/live orders:
- Buys: 0.7035/0.6989 [Tentative – confirmation preferred] (Stop loss: dependent on where one confirms this area).
- Sells: Flat (Stop loss: N/A).
USD/JPY:
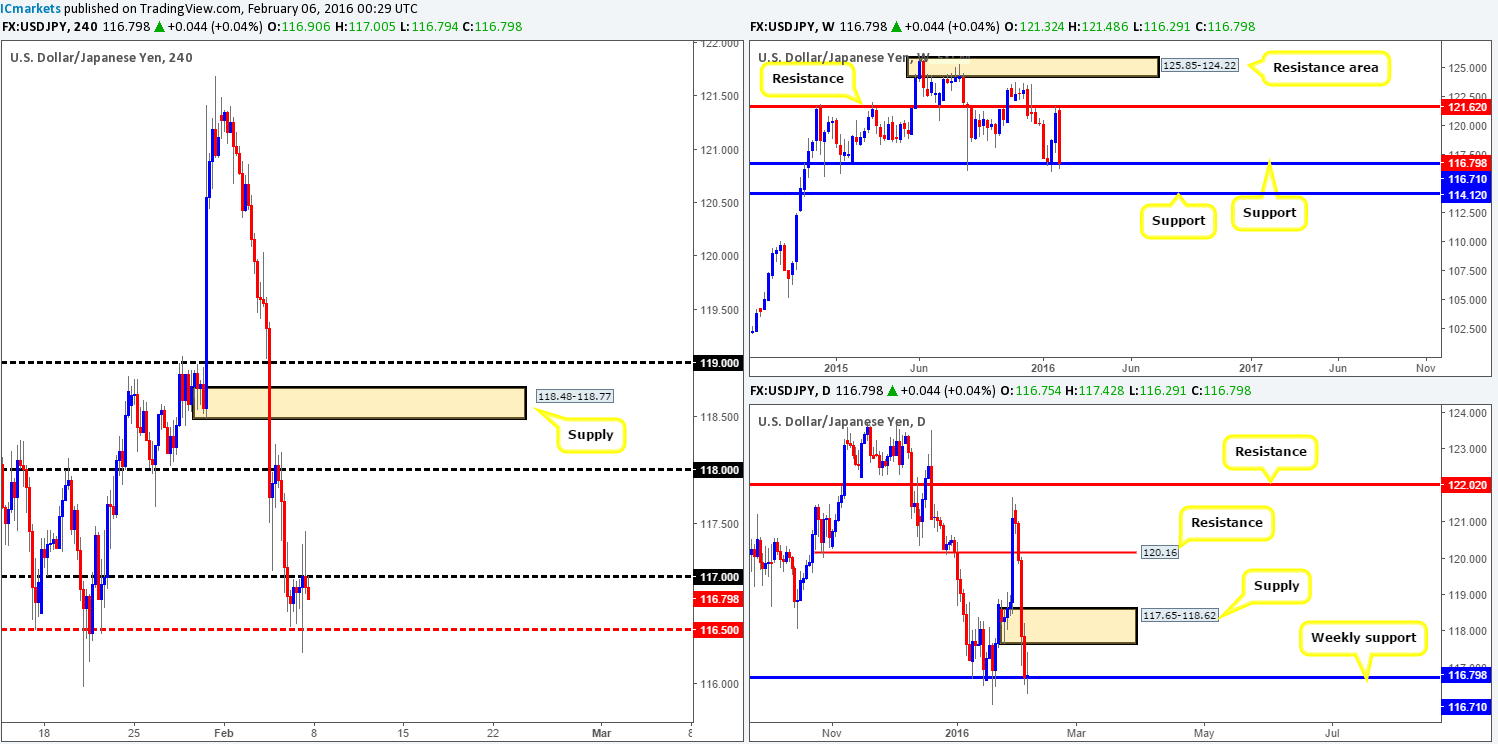
The USD/JPY suffered a nasty decline in value last week, losing over 400 pips into the close 116.79. This assault began from the underside of a weekly resistance level at 121.62 and ended with price thrusting itself into weekly support at 116.71. On account of this, traders who are considering shorting this market this week may want to take this into account.
Branching lower to the daily chart, this week’s sell-off took out not only support (now acting resistance) at 120.16, but also wiped out demand (now acting supply) at 117.65-118.62 before colliding with the above said weekly support level. What was interesting on the daily timeframe was that Friday’s close printed an indecision candle at the base of this weekly hurdle.
Friday’s H4 action, as you can see, was not quite as abrupt as the EUR, GBP and AUD pairs during the NFP release. Mid-level support 116.50 continued to provide a floor to this market allowing the bulls to attack offers around psychological resistance 117.00. For those who read Friday’s report (http://www.icmarkets.com/blog/friday-5th-february-nfp-day-today-traders-be-careful-out-there/), we mentioned that entering long from the 116.50 region was not something we’d be comfortable taking part in, and although we are at a weekly level of support (see above) this is still the case for us. A close above psychological resistance 117.00 would need to be seen before we look to get in long this week (preferably on a retest of 117.00). A close higher should effectively clear the upside to at least the underside of the recently broken daily demand at 117.65, followed by psychological resistance 118.00 and maybe the H4 supply seen at 118.48-118.77.
Levels to watch/live orders:
- Buys: Watch for offers to be consumed around 117.00 and look to trade any retest seen thereafter (lower timeframe confirmation required).
- Sells: Flat (Stop loss: N/A).
USD/CAD:
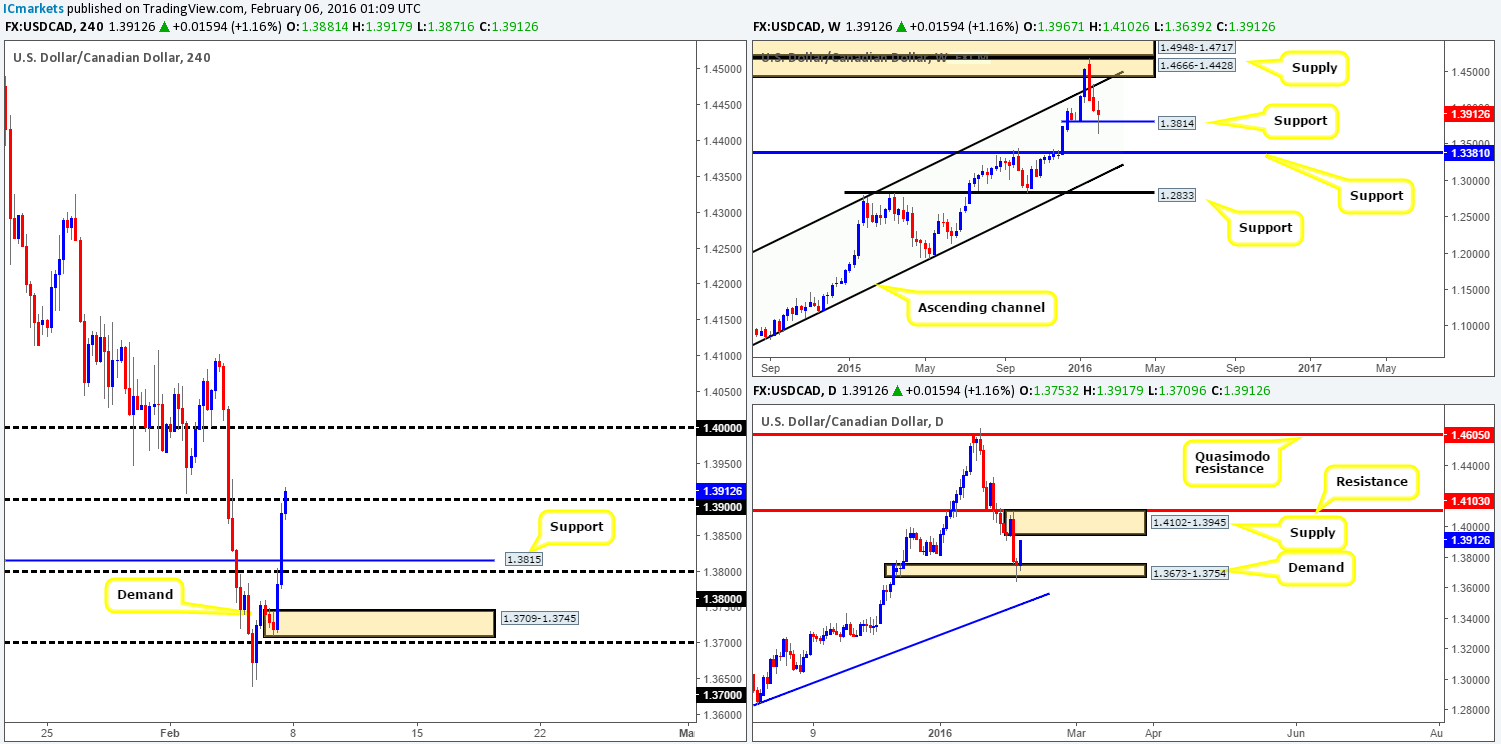
Despite last week’s action ranging over 460 pips, the Loonie closed the week a mere 56 pips below the prior week’s close at 1.3912. What was interesting though was the fact that weekly support at 1.3814 managed to stay afloat seeing as it was struggling for most of the week. Should the buyers manage to hold ground this week, we might, just might see the USD/CAD touch gloves with the weekly channel resistance extended from the high 1.1173. Could this be enough to encourage further buying into this market?
Rolling a page lower to the daily timeframe, Thursday’s buying tail that whipsawed through demand seen at 1.3673-1.3754 saw a healthy follow-through of buying on Friday, bringing this unit up to within touching distance of supply painted at 1.4102-1.3945. Both zones will be on our radar this week as each could play a significant role.
Despite the NFP report coming in worse than expected at 151k, Friday saw the USD/CAD aggressively advance around 160 pips north from above psychological support 1.3700. This bullish assault ended with price poking its head above psychological resistance 1.3900.
In short, here is what we see right now:
- Weekly trading above support.
- Daily very close to crossing swords with supply.
- H4 closed above 1.3900 with plenty of room higher seen to move to at least the large psychological resistance 1.4000.
So, where do we go from here? Well, considering the H4 close higher and the fact that weekly support is holding, we are going to watch how price reacts to 1.3900 today. In the event that the lower timeframes (preferably the M30/M60) show bullish intent (confirmation), we may, dependent on the time of day, buy this market targeting 1.4000. However, this by no means a ‘set and forget trade’, as we would effectively be buying into daily supply so trailing your stop is advisable as price could turn anywhere between your entry and the target zone.
Levels to watch/live orders:
- Buys: 1.3900 [Tentative – confirmation required] (Stop loss: dependent on where one confirms this level).
- Sells: Flat (Stop loss: N/A).
USD/CHF:
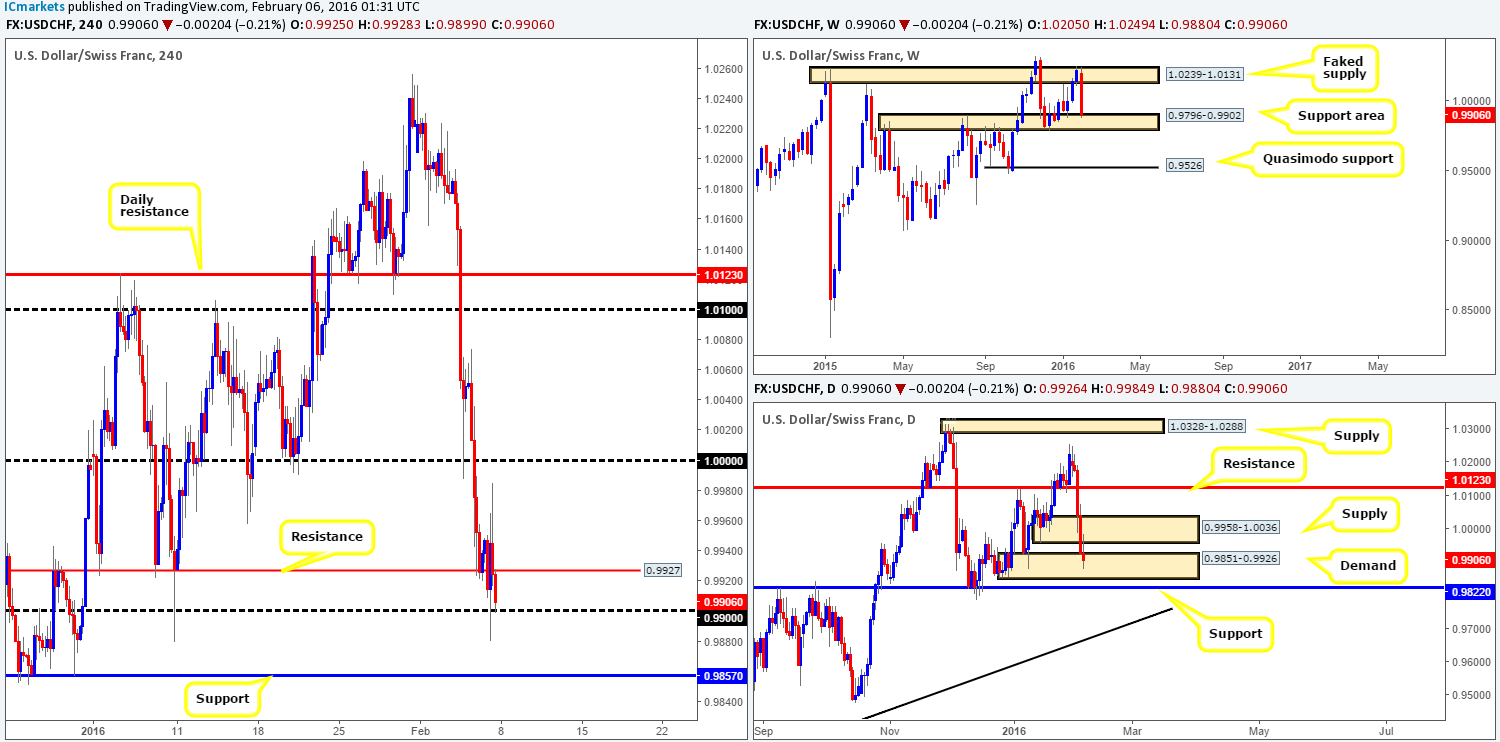
Last week saw the USD/CHF take a hit to the mid-section, suffering a 320-pip loss by the close 0.9906. The bearish attack began from high within a weekly faked supply at 1.0239-1.0131, and ended by jabbing into a weekly support area coming in at 0.9796-0.9902. Considering how well this support structure has held in the past, we would not really feel comfortable selling this market this week… Nevertheless, let’s see what the lower timeframes have to report…
Breaking into the daily timeframe, we can see that price squeezed out longs from daily demand (now acting supply) at 0.9958-1.0036, and went on to collide with another daily demand just below it taken from 0.9851-0.9926. Despite Friday’s bearish-looking selling wick that formed here, this demand remains significant since it rests on top of the above said weekly support area. Therefore, this daily area and the support level seen a few pips beneath it at 0.9822 are numbers we’ll be watching this week.
In Friday’s report (http://www.icmarkets.com/blog/friday-5th-february-nfp-day-today-traders-be-careful-out-there/), we spoke about looking for lower timeframe buy entries between the H4 support (now acting resistance) at 0.9927 and the psychological support 0.9900. As is evident from the chart a bounce was seen from here, but stops were quickly taken out as the NFP got into full swing.
Should 0.9900 hold firm today and close above 0.9927, there is scope for a long trade up to at least parity (1.0000). Whether one choses to enter on a retest of 0.9927 or wait for a deeper retracement, this would be down to the individual trader. We personally would much prefer to enter as low as possible alongside confirmation. Supposing 0.9900 fails, all eyes will then be on the support level at 0.9857 for confirmed longs (sits very deep within the daily demand zone mentioned above at 0.9851-0.9926 and also within the weekly support area at 0.9796-0.9902). Reason for needing confirmation here is simply due to the possibility that price may fake beyond the current daily demand into daily support just below it (see above).
Levels to watch/live orders:
- Buys: Watch for offers to be consumed around 0.9927 and look to trade any retest seen thereafter (lower timeframe confirmation required). 0.9857 [Tentative – confirmation required] (Stop loss: dependent on where one confirms this level).
- Sells: Flat (Stop loss: N/A).
DOW 30:
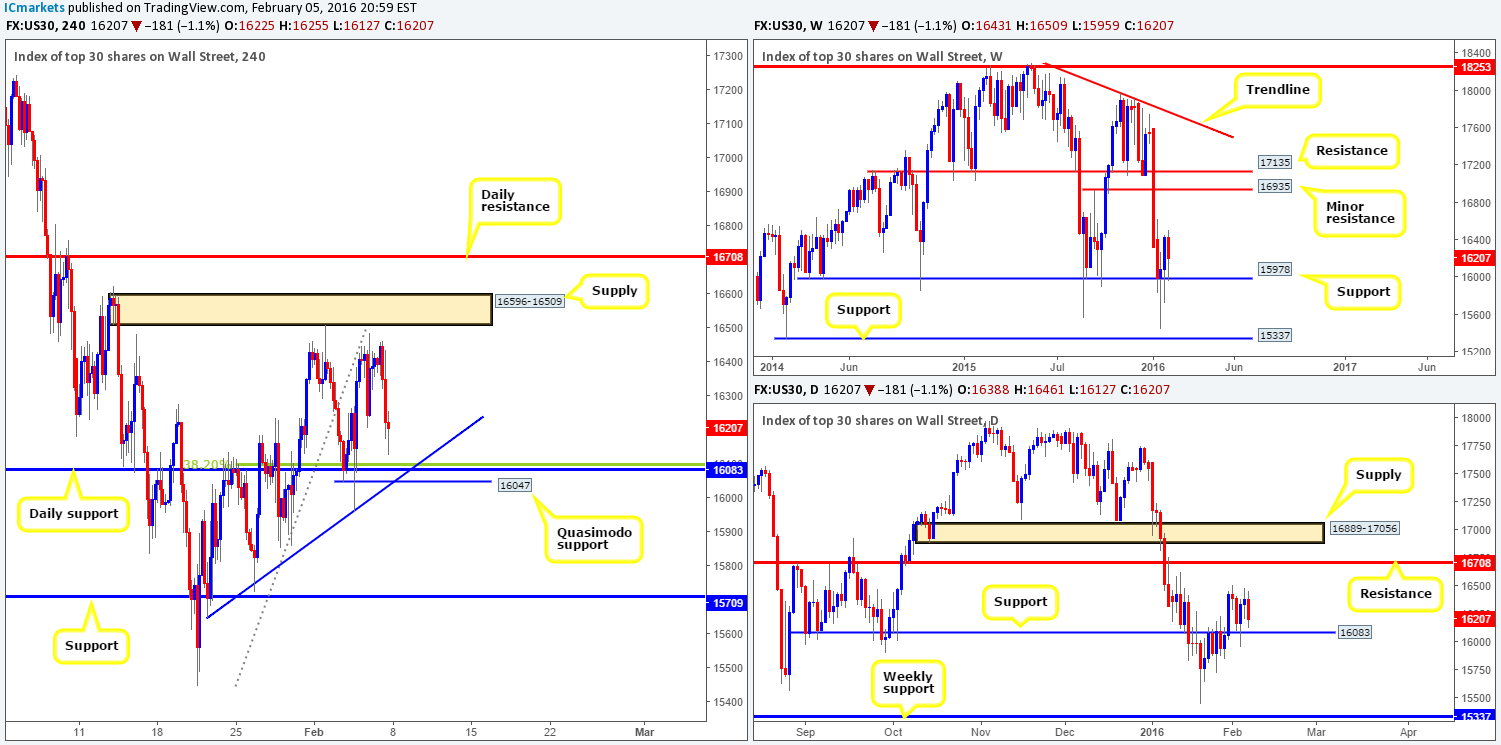
U.S. stocks shredded around 225 points during trading last week, forcing price to close the week lower at 16207. In spite of this, weekly support at 15978 remains intact and should still be on your watch lists. With that being the case, the next upside target as per the weekly timeframe can be seen around resistance coming in at 16935.
Branching lower to the daily chart, support at 16083 is a level of interest to us. Not only because it is located close to the aforementioned weekly support, but also due to how well this daily barrier has held up in the past, specifically during the month of September 2015.
Now here is where things become interesting! H4 action shows that shortly after the NFP had its time in the spotlight, U.S stocks tumbled lower reaching lows of 16127 on the day. Just below this low, however, sits the daily support discussed above at 16083. We are confident that this barrier will bounce price should this market attack this area today/this week, as there are a number of technical aspects that support this view. Firstly, a nice-looking H4 Quasimodo support level is seen drawn from 16047; secondly a H4 trendline support extended from the low 15647and thirdly a H4 38.2% Fibonacci support level at 16092. Couple all of this together with the current daily support and the backing of a weekly support a little lower down on the scale and we have ourselves a neat little buy zone to watch!
Depending on the time of day, our team has come to a general consensus that entering long from here at market is a viable option. To be on the safe side, we’d advise stops to be placed below the H4 trendline, thus allowing the trade room to breathe. First take-profit target falls in around the 16240 region, followed closely by the H4 tops seen above at the16450 area.
Levels to watch/live orders:
- Buys: 16083 region [Looking at a market entry here] (Stop loss: 15950 area).
- Sells: Flat (Stop loss: N/A).
XAU/USD: (Gold)
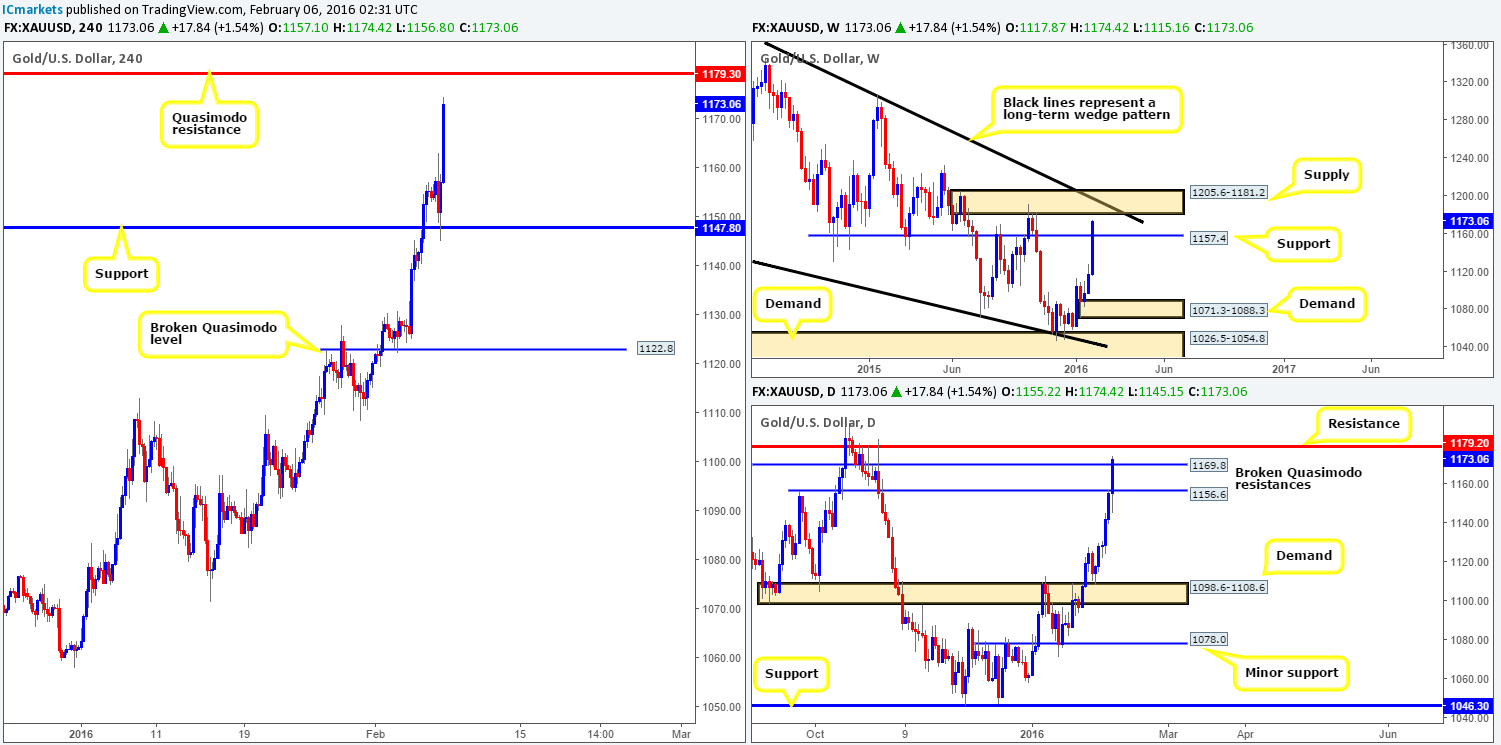
The yellow metal steam rolled itself north last week printing its third consecutive weekly candle and gaining over $55 in value at the close 1173.0. Consequent to this, weekly resistance (now acting support) at 1157.4 was taken out and price is now trading within shouting distance of a weekly supply at 1205.6-1181.2, that fuses together beautifully with the upper limit of a weekly wedge taken from the high 1488.00.
Shifting a gear lower, the daily picture shows that last week’s bullish assault ended with price taking out two Quasimodo resistances at 1156.6/1169.8. Now, from this angle at least, the next upside objective for price to reach is seen at 1179.2 – a resistance. This level has performed well in the past and considering that it lurks just below weekly supply (see above), this is certainly a hurdle worth having on your watch lists this week guys.
And finally, a quick look at Friday’s H4 reaction to the mighty NFP release shows that price respected support at 1147.8 nearly to-the-pip. If you check out the M30 timeframe you’ll see there was a beautiful array of buying tails printed here – a perfect signal to get long – shame this was around news time though! From this number, price blasted north reaching highs of 1174.4 by the day’s end.
In light of both the weekly and daily timeframes closing relatively near to strong-looking resistance structures (see above), our eye is automatically drawn to the H4 Quasimodo resistance level sitting just above current prices at 1179.3. This will be our first port of call this week for shorts. Be that as it may, shorting here without confirmation from the lower timeframes is not something we’d be comfortable taking part in. The reason for why is simply because price can just as easily continue driving north into the weekly supply area before any worthwhile selling is seen. That being the case, in the event that our H4 Quasimodo line is taken out we’ll then reassess where the next logical H4 resistance will likely come into play.
Levels to watch/live orders:
- Buys: Flat (Stop loss: N/A).
- Sells: 1179.3 [Tentative – confirmation required] (Stop loss: dependent on where one confirms this level).