
EUR/USD:
Weekly gain/loss: -0.02%
Weekly close: 1.1214
Weekly perspective:
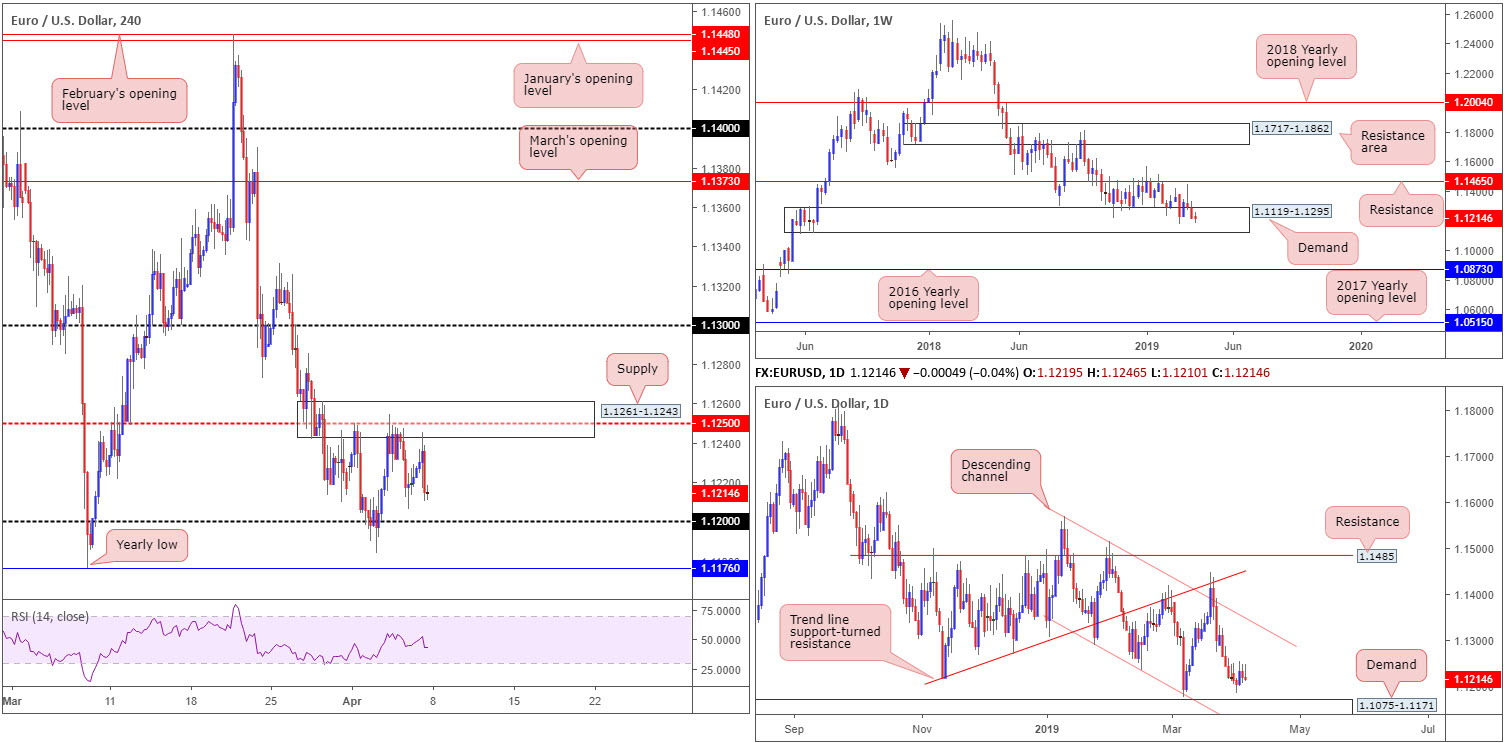
Although trading within the parapets of demand at 1.1119-1.1295, the single currency wrapped up the week almost unchanged. Since early February, it is worth noting the unit has struggled to gain much traction out of the zone.
Overall, the long-term trend on the weekly timeframe continues to face a southerly direction, with traders’ crosshairs now likely fixed on 1.1176: the 2019 yearly low. The next area of interest beyond the current demand, however, falls in around the 2016 yearly opening level priced in at 1.0873.
Daily perspective:
Aside from Wednesday’s candle, the pair was unable to print anything meaningful to the upside. Friday’s candle, as you can see, concluded by way of a bearish pin-bar formation.
According to our technical studies, this places the daily candles in good stead to approach demand at 1.1075-1.1171 this week. Note this demand area is fastened to the underside of the current weekly demand.
H4 perspective:
Total US non-farm payroll employment increased by 196,000 in March (consensus 172k), along with the unemployment rate coming in unchanged at 3.8%, the US Bureau of Labour Statistics reported Friday. Wages, however, disappointed, printing 0.1% month-on-month (consensus 0.3%), with the year-on-year rate falling to 3.2%, missing 3.3% expected.
Following the release of the US employment situation report, the EUR/USD immediately clocked a high of 1.1245, consequently forcing a revisit of H4 supply coming in at 1.1261-1.1243 (holds the 1.1250 psychological resistance within). On the back of a resurgence of USD bidding, and no doubt interest from the aforementioned supply, upside momentum swiftly diminished and closed 0.04% on the day. The next support target in view on the H4 timeframe rests around 1.12, closely followed by the 2019 yearly low of 1.1176.
Areas of consideration:
The 2019 yearly low 1.1176, along with the top edge of daily demand at 1.1171, remains an interesting combination of support this week. These levels, bearing in mind both are positioned within weekly demand, are likely to hold buyer interest. The only grumble is the threat of 1.12 potentially acting as resistance and forcing the unit lower. An option to help overcome this is waiting and seeing if the H4 candles reclaim 1.12 to the upside after shaking hands with 1.1171/1.1176. In doing so, this emphasises buyer intent and could, therefore, be traded as a bullish breakout scenario (entry and risk levels can be determined according to the open/close of the breakout candle), targeting the aforesaid H4 supply as an initial take-profit target.
Today’s data points: Limited.
GBP/USD:
Weekly gain/loss: -0.02%
Weekly close: 1.3031
Weekly perspective:
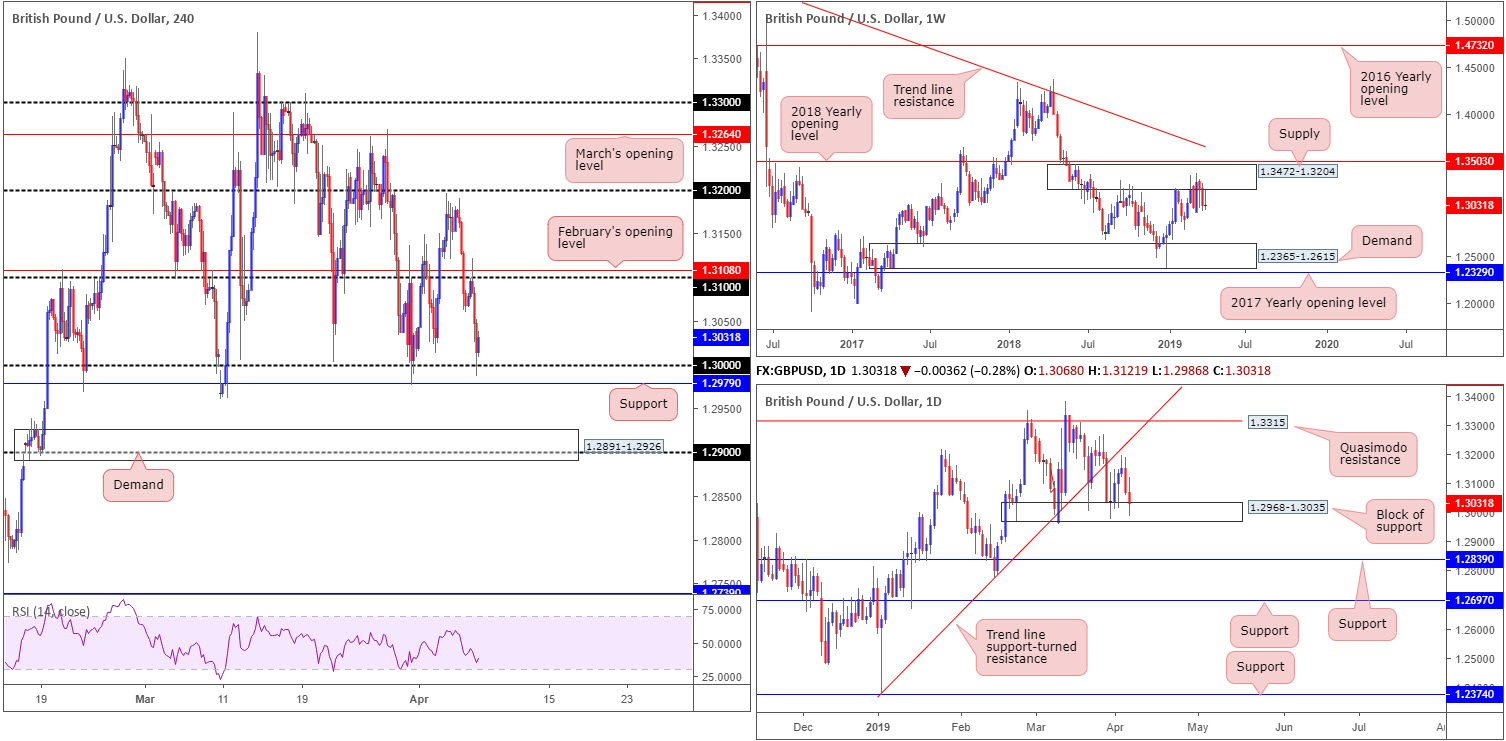
Garnishing the weekly chart is supply drawn from 1.3472-1.3204. Since the end of February this area has been home to many traders as price flips between gains/losses. According to structure, recent selling should not have come as a surprise, with the next obvious downside target not realised on this timeframe until demand coming in at 1.2365-1.2615.
Daily perspective:
The beginning of the week started on a strong footing, exploring ground above a clear block of support drawn from 1.2968-1.3035. Just south of trend line support-turned resistance (extended from the low 1.2373), nonetheless, things turned sour at the later stages of the week, consequently forcing a retest of the said support zone.
H4 perspective:
US economic data hit the wires Friday, reporting the economy added 196K jobs in March and slower-than-expected wage growth. The numbers failed to lift the greenback initially, though as the US session kicked off, the market witnessed a resurgence of USD bidding enter the fold across the board. As a result, the British pound weakened, and marginally surpassed the key figure 1.30, missing support priced in at 1.2979 by a couple of points.
Areas of consideration:
Traders interested in entering long from the 1.30 region this week, according to our technical studies, bring with them a clear block of support at 1.2968-1.3035 backing up the trade. Though this is likely to encourage buyers, the main concern is on the weekly timeframe: supply coming in at 1.3472-1.3204. This area is proving a troublesome beast to overcome and, therefore, could weigh on any longs this week. Aggressive traders may already be long from 1.30. If so, expect potential selling to emerge from 1.3060ish.
In the event weekly selling pressures the market lower and the H4 candles overthrow 1.30 and nearby support at 1.2979, nevertheless, the next area of interest can be seen around demand pencilled in at 1.2891-1.2926 (also holds the 1.29 handle within its walls).
Today’s data points: Limited.
AUD/USD:
Weekly gain/loss: +0.11%
Weekly close: 0.7103
Weekly perspective:
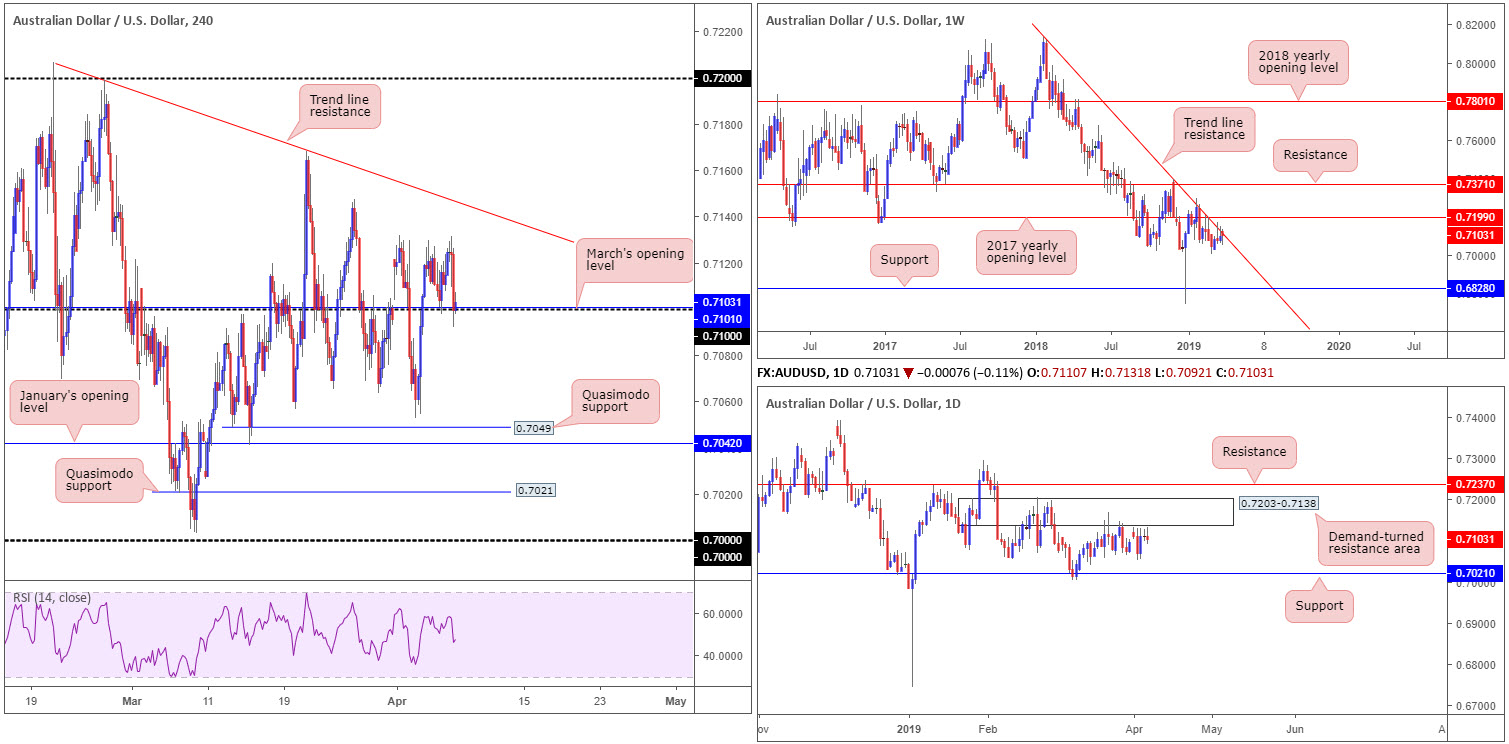
The weekly candles remain kissing the underside of a long-standing trend line resistance (etched from the high 0.8135). The market could eventually observe additional selling take shape from here as downside appears reasonably free until connecting with support coming in at 0.6828.
Daily perspective:
Following a modest rebound off support at 0.7021 early March, the pair, since March 20, has been clinging to the underside of a demand-turned resistance area at 0.7203-0.7138. A push higher from here may land the unit at resistance drawn from 0.7237.
H4 perspective:
The aftermath of Friday’s mixed US job’s report witnessed the Australian dollar initially trade higher against its US counterpart, reaching a session high of 0.7131. Buyers swiftly lost their flavour, however, reclaiming all immediate gains and challenging 0.71 as support, along with March’s opening level merging closely at 0.7101.
In previous reports, the research team highlighted the likelihood of 0.71 failing as support due to where we’re coming from on the weekly and daily timeframes.
Areas of consideration:
Entering long from 0.71 is a chancy trade for reasons stated above.
In the event our higher-timeframe reading is accurate and H4 action overthrows 0.71 to the downside again, selling this market (preferably on a retest – entry and risk levels can be determined according to the rejection candle’s structure) towards Quasimodo support at 0.7049 is an option.
Today’s data points: Limited.
USD/JPY:
Weekly gain/loss: +0.76%
Weekly close: 111.70
Weekly perspective:
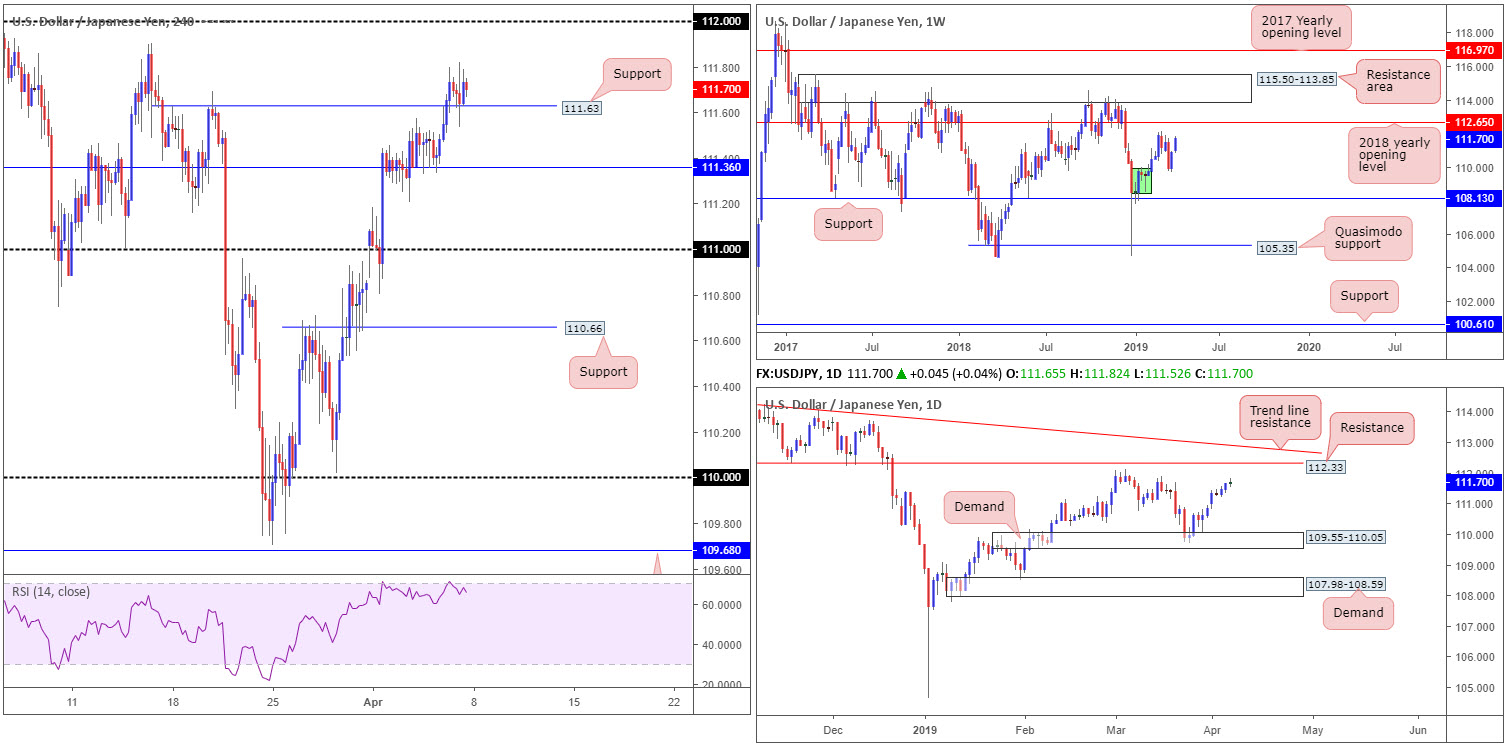
Back-to-back weekly gains produced from the top edge of (local) demand (green) at 108.50-109.89 has the weekly candles facing the March 4 high at 112.13 this week, shadowed closely by the 2018 yearly opening level priced in at 112.65. In addition to this, traders may also want to pencil in the resistance area drawn from 115.50-113.85. Note this zone capped upside on a number of occasions since May of 2017.
Daily perspective:
In terms of where we stand on the daily timeframe, the March 4 high at 112.13 mentioned above on the weekly timeframe is also a discernible resistance on this scale, though the more prominent resistance falls in around 112.33, closely tailed by a long-standing trend line resistance (etched from the high 114.55).
H4 perspective:
In spite of Friday’s US job’s report, the market’s range was somewhat lacklustre. The session observed a clean break above Quasimodo resistance at 111.63, which, as you can see, was retested as support and held into the close. Overhead, the 111.90 March 15 high is in view, though the 112 handle is seen as a more conspicuous resistance. Traders who employ indicators to help base trading decisions might want to note the RSI indicator is also seen clinging to the underside of the overbought value.
Areas of consideration:
In view of H4 flow engulfing Quasimodo resistance and respecting the barrier as support, further buying on this timeframe could be observed today/early week, targeting 112 as an initial base. This theory is further bolstered on the higher timeframes – both weekly and daily charts exhibit scope to press higher this week, with the March 4 high at 112.13 in line as the first port of call in terms of resistance.
Though a reasonably substantial H4 bull candle presented itself Friday (the second candle prior to the close), this is unlikely enough to generate buyer interest. This is simply due to the candlestick’s upper shadow being of a considerable size. Therefore, according to our technical reading here, the best path to take for those considering buying this market is to wait and see if the H4 candles chew out a notable bullish candlestick signal. Not only will this promote buyer intent it’ll also serve as a base to define entry and risk levels.
Today’s data points: Limited.
USD/CAD:
Weekly gain/loss: +0.26%
Weekly close: 1.3380
Weekly perspective:
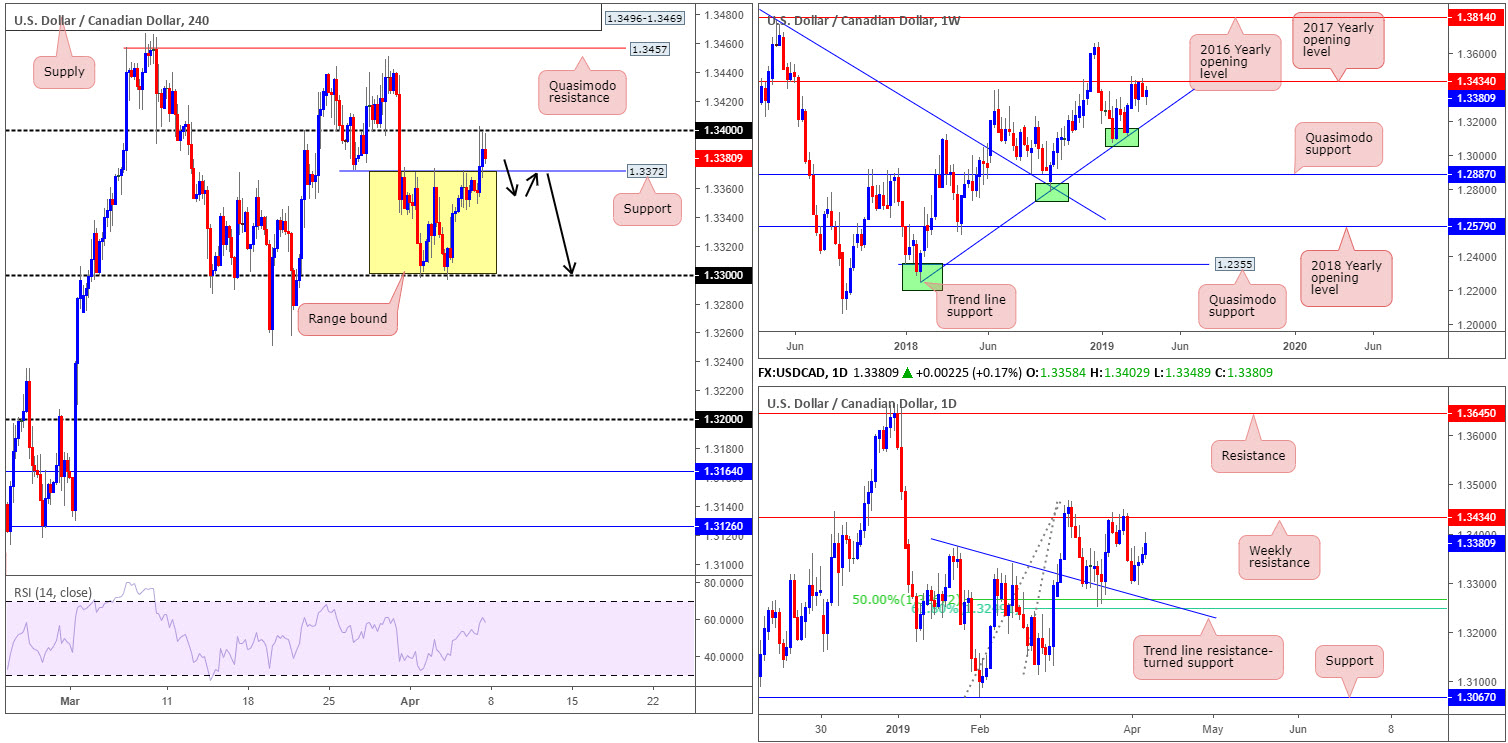
In recent weeks, the USD/CAD engaged with notable resistance at 1.3434 (the 2017 yearly opening level) following a dominant push higher from a meaty trend line support (taken from the low 1.2247). Should price action run through 1.3434 this week, keep tabs on the 1.3664 Dec 31 high, followed reasonably closely by the 2016 yearly opening level at 1.3814.
Daily perspective:
Daily flow, on the other hand, found a ‘floor’ ahead of a 50.0% support at 1.3267 last week. Note this barrier happens to merge closely with a 61.8% Fibonacci support at 1.3248 and a trend line resistance-turned support (extended from the high 1.3375). Further buying from this point could eventually bring in 1.3434 from the weekly timeframe this week.
H4 perspective:
Recent developments on the H4 timeframe reveal the candles spent a large portion of trade chiselling out a consolidation between local resistance plotted at 1.3372 and the round number 1.33 (yellow). Friday, nevertheless, watched the USD/CAD gain traction amid US hours, following the US and Canadian employment release. Disappointing Canadian employment change (-7.2k vs. 3.0k expected) weighed on the Canadian currency, forcing the USD/CAD market outside of its range towards 1.34. This is also despite WTI refreshing a 2019 high at $63.31.
With H4 price ending Friday sandwiched between range resistance-turned support at 1.3372 and the round number 1.34, current price action offers limited movement in early trading today.
Areas of consideration:
In terms of movement outside of 1.3372/1.34 this week, traders considering buying a breakout above 1.34 may find they quickly run into fresh headwinds from the 2017 yearly opening level on the weekly timeframe at 1.3434. This, therefore, should only be considered a short-term long above 1.34, though still ensure you have risk/reward in check, traders.
On the flip side, continued rejection from 1.34 may lead to the unit re-entering the aforesaid H4 range and approaching its lower extreme 1.33. This could offer traders a possible shorting opportunity this week. Conservative traders will likely want to see the H4 candles close within the range and then follow up with a retest of 1.3372 (black arrows), preferably in the form of a H4 or H1 bearish candlestick formation (entry and risk parameters can then be defined according to this structure), targeting the opposing end of the H4 range and, with a little bit of enthusiasm, the daily supports highlighted above at 1.3249/1.3267.
Today’s data points: Limited.
USD/CHF:
Weekly gain/loss: +0.48%
Weekly close: 0.9999
Weekly perspective:
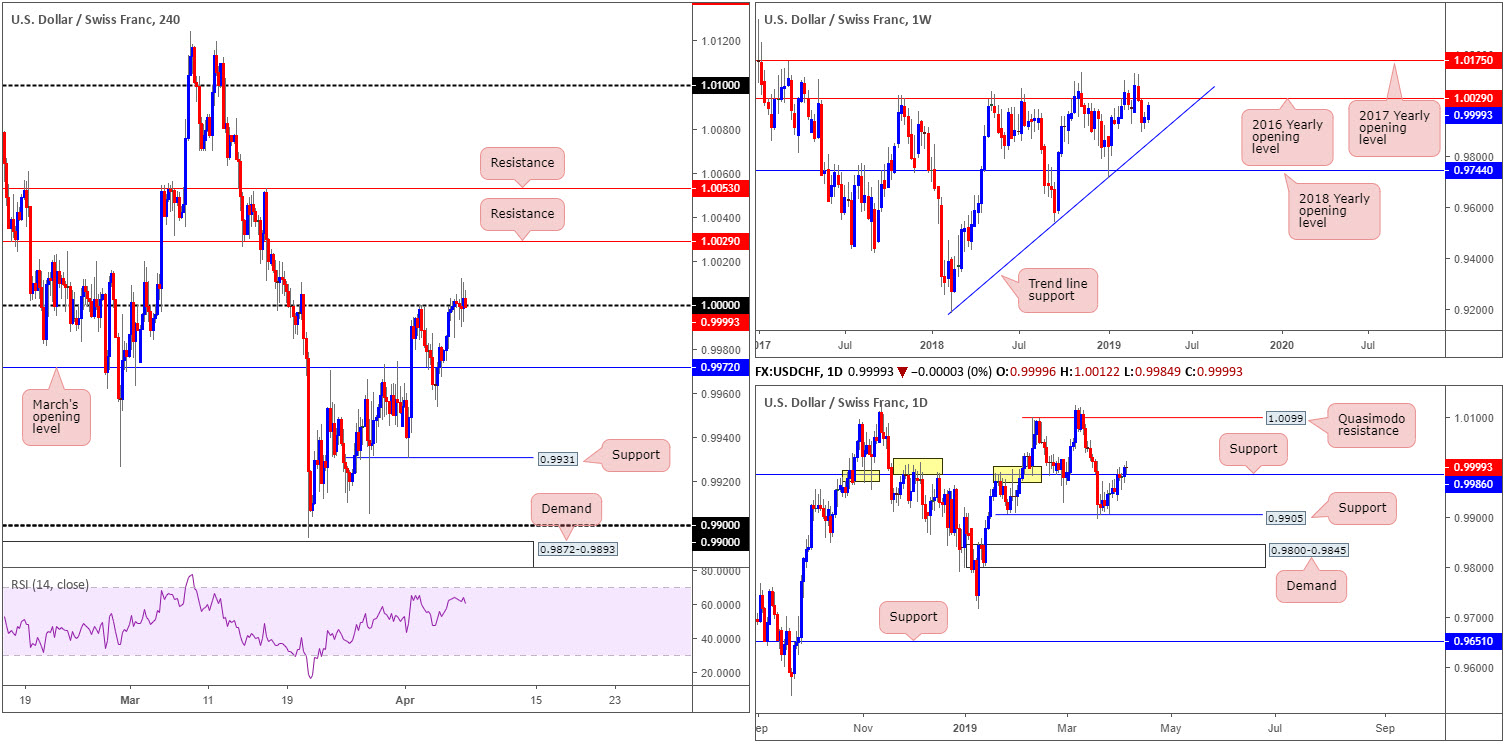
The US dollar rose against the Swiss franc in recent trade, concluding the week up 0.48%. Despite failing to test nearby trend line support (etched from the low 0.9187), weekly movement is currently eyeing a possible retest of its 2016 yearly opening level at 1.0029 as resistance this week.
Daily perspective:
The story on the daily timeframe, thanks to recent buying, witnessed the candles overthrow notable resistance at 0.9986 (now acting support). Note this support and resistance level boasts strong historical significance dating as far back as November 2017. Should the buyers continue bidding this market higher, the next area of resistance in sight falls in around a Quasimodo resistance base at 1.0099.
H4 perspective:
Although the US employment situation report entered the fold Friday, price action, according to H4 movement, largely ignored the release. As you can see, the day consisted of the candles flipping between gains/losses around the key figure 1.0000 (parity).
In the event we push for higher ground today/early week, two layers of resistance are visible at 1.0053 and 1.0029. Traders may want to acknowledge the lower of the two levels also represents the 2016 yearly opening level on the weekly timeframe.
To the downside, nonetheless, March’s opening level at 0.9972 is visible.
Areas of consideration:
Those who attempted to fade 1.0000 Friday have likely had stops filled. By the same token, traders attempting to buy the breakout have also likely had their orders filled. Accounting for this, short-term buying opportunities may emerge above 1.0000, targeting 1.0029 as an initial upside target. Traders considering this move are urged to ensure risk/reward conditions are favourable before pulling the trigger, as the likelihood of selling materialising from 1.0029 this week is reasonably strong, despite daily flows showing room to press beyond here.
Today’s data points: Limited.
Dow Jones Industrial Average:
Weekly gain/loss: 1.65%
Weekly close: 26351
Weekly perspective:
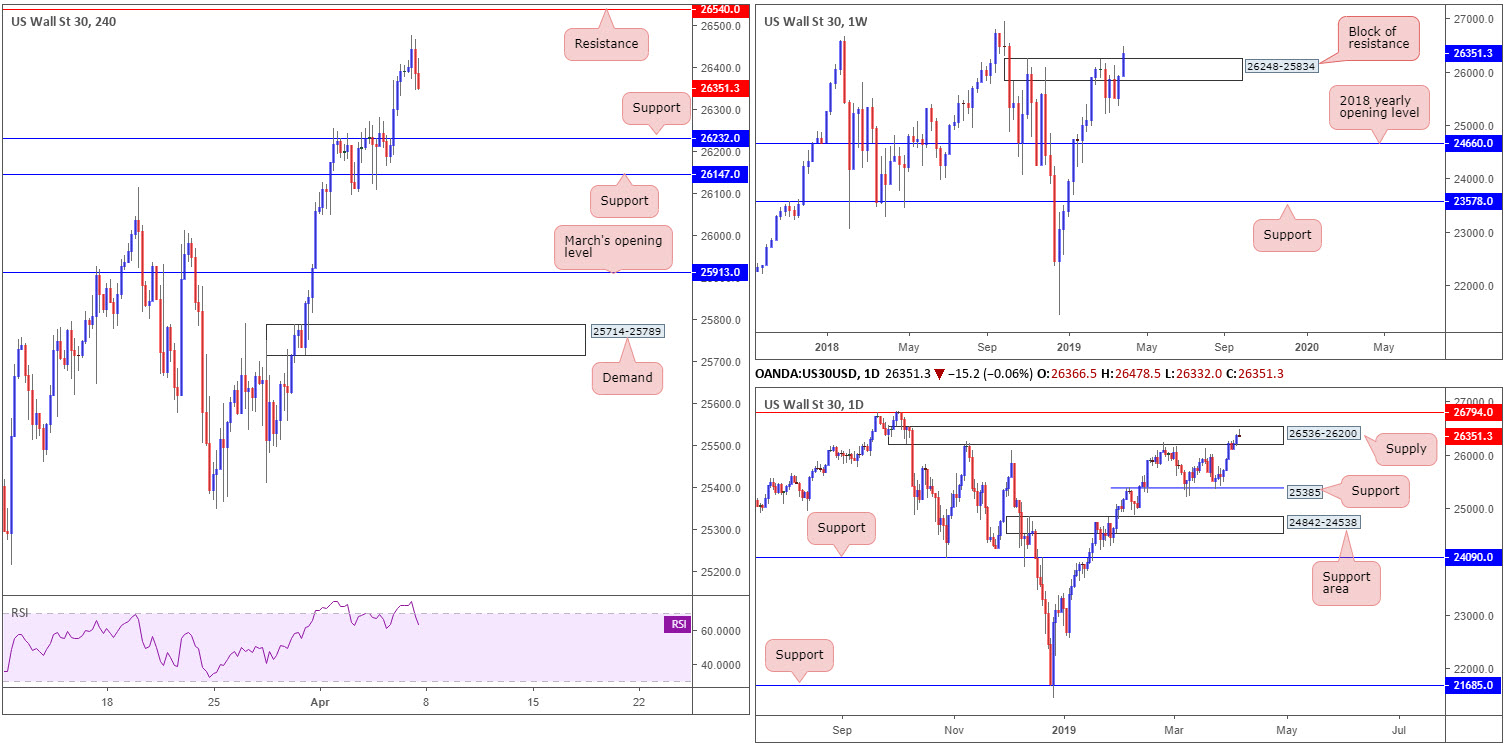
Wall Street added further gains on trade optimism last week, marking a fresh 2019 high of 26478. Also noteworthy is the recent domination of a resistance area shown at 26248-25834. Assuming the market remains bid, the index could soon be knocking on the door of the all-time high 26939, and quite possibly beyond.
Daily perspective:
In spite of the weekly timeframe’s current position, price action on the daily timeframe has its candles trading within the parapets of supply coming in at 26536-26200. Of note is Friday’s action closing by way of a bearish pin-bar formation. In the event weekly buyers continue to support this market and a break of the noted daily supply is observed, daily Quasimodo resistance at 26794 is in sight as the next viable ceiling.
H4 perspective:
Though Friday’s US employment report lifted the market higher at the outset, things turned sour relatively quickly. Within an hour, gains were all but consumed with the day ending in marginally negative territory, down 0.06%.
Structure on the H4 scale is relatively free and open. To the upside, resistance is set around 26540, whereas to the downside traders likely have their crosshairs fixed on support at 26232, closely followed by another layer of support coming in at 26147.
Areas of consideration:
Technical signals on the higher timeframes are mixed at the moment, with weekly price potentially showing scope to advance and daily activity displaying seller intent within supply at 26536-26200, in the shape of a bearish candlestick formation. For this reason, traders are urged to tread cautiously engaging with any medium/long-term positions this week.
Levels to watch for a bounce on the H4 timeframe this week are resistance mentioned above at 26540 and the two said H4 supports at 26147 and 26232. Given the mixed signals on the bigger picture, though, the research team recommends only trading these barriers on the back of additional confirmation. Not only does this help confirm buyer/seller intent, it also serves as structure to base entry and risk levels from.
Today’s data points: Limited.
XAU/USD (GOLD):
Weekly gain/loss: -0.05%
Weekly close: 1291.3
Weekly perspective:
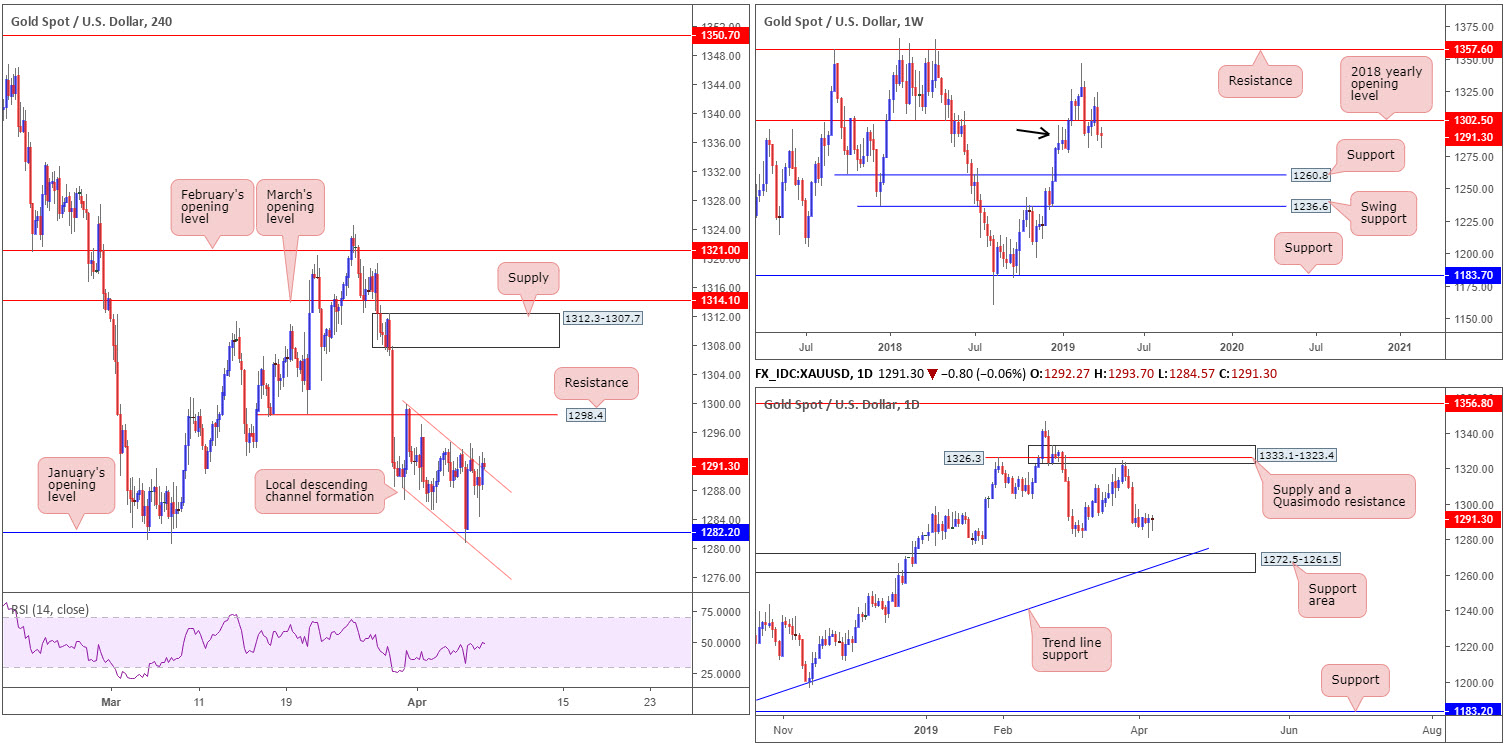
The broader picture reveals the yellow metal snapped back beneath its 2018 yearly opening level at 1302.5, by way of a strong bearish engulfing candle. Although viewed by some as a bearish cue to potentially push lower, the market generated little in the way of follow-through selling last week. This could have something to do with the fact demand (black arrow) at 1276.9-1295.8 remains in motion. A break south of this area, however, has support at 1260.8 to target.
Daily perspective:
Moving things over to the daily timeframe, immediate support to be aware of is the 1281.0 March 7 low, followed by a support area coming in at 1272.5-1261.5 and merging trend line support (taken from the low 1160.3).
In the event the market heads higher this week, resistance is not expected to emerge on this timeframe until supply drawn from 1333.1-1323.4.
H4 perspective:
The local descending H4 channel formation (1299.8/1292.1) suffered a minor breach to the upside Friday, an hour or so following the latest US employment report. By and of itself, this is a signal bullion may be looking to take things higher from here, targeting resistance priced in at 1298.4. The next area of interest beyond 1298.4 falls in around supply at 1312.3-1307.7, which, as you can see, boasts strong downside momentum from its base. It is also worth noting possible resistance may form between the aforesaid H4 supply and H4 resistance on the weekly timeframe from the 2018 yearly opening level at 1302.5.
Areas of consideration:
Aside from the long out of 1228.2, a level highlighted in previous reports as a base to buy from, traders may receive a second opportunity to buy this market today/early week should we hold above the current H4 channel resistance. This, as highlighted above, clears the path way north to at least H4 resistance at 1298.4 for a potential short-term long on a retest of the said channel.
An added bonus would be H4 (or lower-timeframe action) price chalking up a bullish candlestick signal at the retest, consequently identifying buyer intent and also serving as a base to determine entry and risk levels.
The accuracy, completeness and timeliness of the information contained on this site cannot be guaranteed. IC Markets does not warranty, guarantee or make any representations, or assume any liability with regard to financial results based on the use of the information in the site.
News, views, opinions, recommendations and other information obtained from sources outside of www.icmarkets.com.au, used in this site are believed to be reliable, but we cannot guarantee their accuracy or completeness. All such information is subject to change at any time without notice. IC Markets assumes no responsibility for the content of any linked site. The fact that such links may exist does not indicate approval or endorsement of any material contained on any linked site.
IC Markets is not liable for any harm caused by the transmission, through accessing the services or information on this site, of a computer virus, or other computer code or programming device that might be used to access, delete, damage, disable, disrupt or otherwise impede in any manner, the operation of the site or of any user’s software, hardware, data or property.


