
Key risk events today:
Limited.
(Previous analysis as well as outside sources – italics).
EUR/USD:
Weekly gain/loss: -0.57%
Weekly close: 1.1835
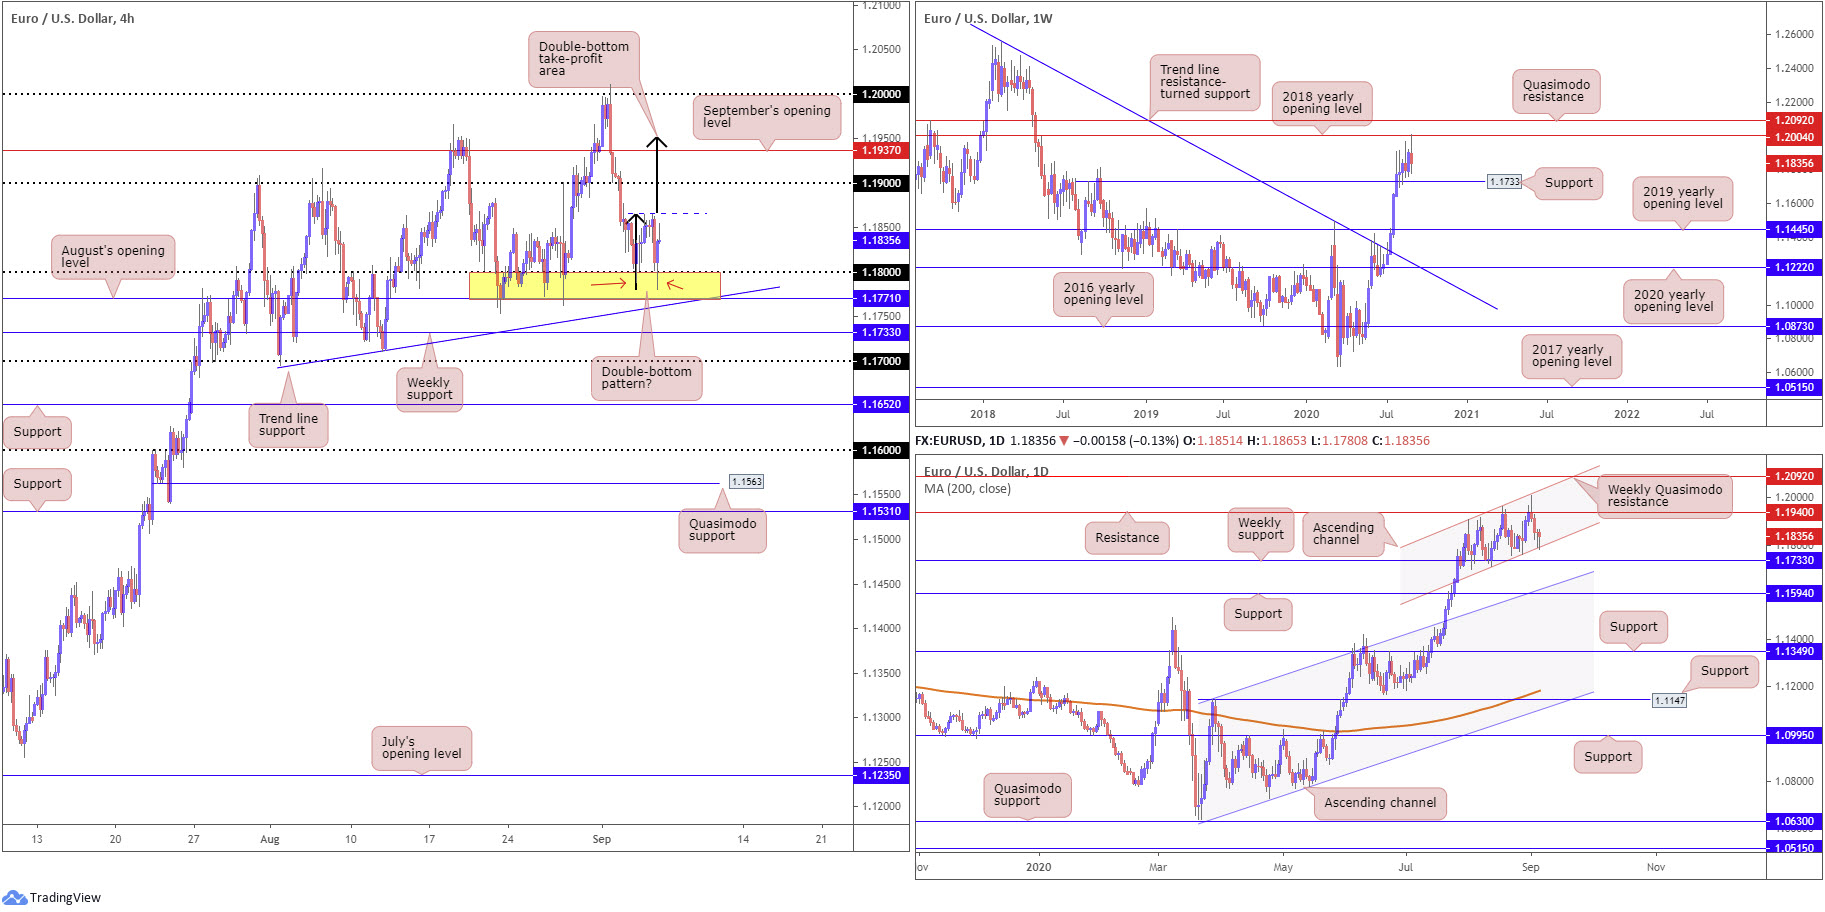
Weekly perspective:
Last week welcomed the 2018 yearly opening level at 1.2004 into the fray as the pair refreshed YTD peaks at 1.2011. Support from here is not expected to enter play until 1.1733, a prior Quasimodo resistance level. Occupying 1.2004 this week, nevertheless, shines the spotlight on Quasimodo resistance at 1.2092.
Traders will also acknowledge price has traded with a strong upside bias since March, a move that absorbed a reasonably notable trend line resistance, taken from the high 1.2555.
Daily perspective:
Since kicking off the month of August, daily candles have been compressing within an ascending channel formation between 1.1909/1.1711. This – coupled with the inability to close above resistance at 1.1940 as well as the recent test of weekly resistance at 1.2004 – suggests buyers are perhaps losing steam.
Interestingly, though, the second half of the week delivered two back-to-back hammer candlestick patterns, based off the current channel support. This hints at the possibility of revisiting daily resistance at 1.1940.
H4 perspective:
In terms of Friday’s employment release out of the US, a broadly positive wave of figures came through, consequently delivering an initial knee-jerk reaction higher in the USD that sent the DXY to a fresh session high of 92.88.
A closer examination of price movement on the H4 timeframe on EUR/USD shows the week ended nursing recent losses off a familiar support area made up between August’s opening level at 1.1771 and the 1.18 handle (yellow). Some traders will also view the recent lows around 1.1786 as a double-bottom pattern (red arrows), with a neckline stationed around 1.1865.
Traders with a focus on multi-timeframe analysis will also acknowledge the aforementioned support area joins together with channel support on the daily timeframe.
Further gains this week is likely to pull in the 1.19 barrier, followed by September’s opening level at 1.1937, while brushing aside 1.1771/1.18 has immediate trend line support to contend with, extended from the low 1.1695.
Areas of consideration:
Although the possibility of reaching for 1.1733 support on the weekly timeframe is present this week, the H4 double-bottom pattern drawn from within the H4 support area at 1.1771/1.18 is likely to interest buyers early week.
Gleaning additional impetus from channel support on the daily timeframe, a break of the H4 double-bottom pattern neckline at 1.1865 could be in the offing, a move that may persuade buyers to take action and target the 1.1950ish region. Not only does the 1.1950 area hold the double-bottom take-profit zone (black arrows), September’s opening level at 1.1937 on the H4 is also seen close by, together with daily resistance priced in at 1.1940.
GBP/USD:
Weekly gain/loss: -0.53%
Weekly close: 1.3276
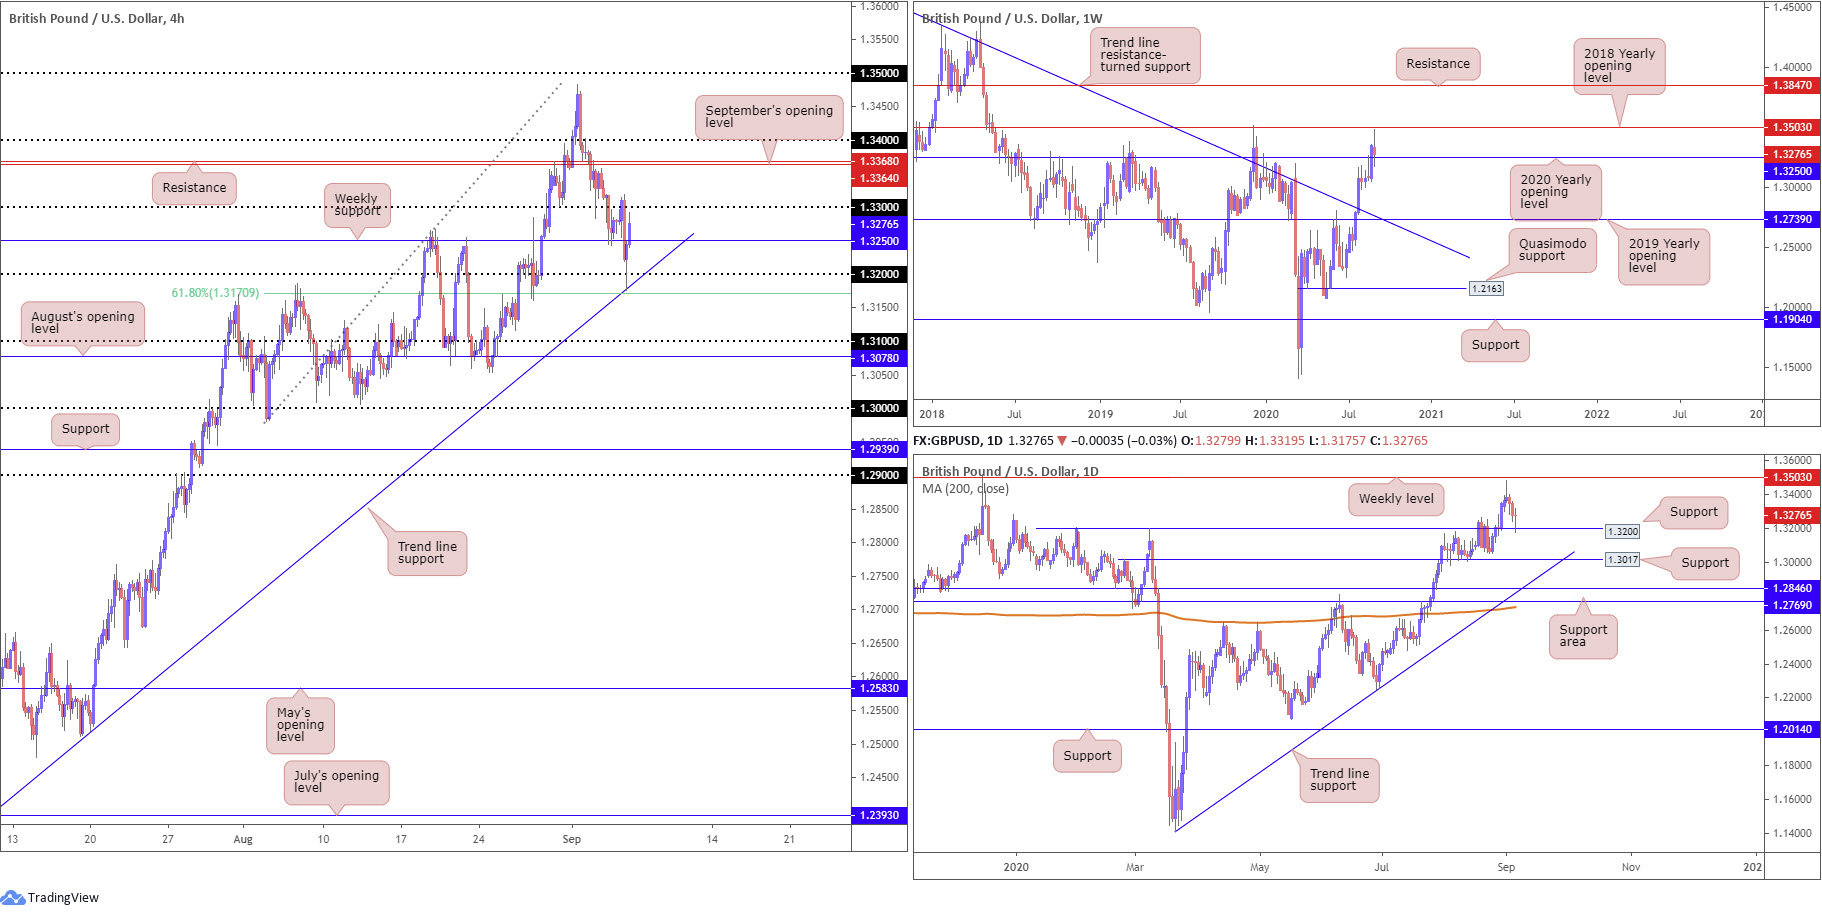
Weekly perspective:
Marking a fresh YTD pinnacle at 1.3483 last week, price action came within striking distance of the 2018 yearly opening value at 1.3503 before losing grip and erasing weekly gains. Consequently, 1.3250, the 2020 yearly opening value, re-entered the frame and held as support into the close.
Dropping to deeper water this week could see the beginning of a descent towards the 2019 yearly opening value at 1.2739, merging closely with trend line resistance-turned support, extended from the high 1.5930.
Daily perspective:
Support at 1.3200 made its way into the spotlight Friday, delivering a strong buying tail. Any sustained move beyond the latter this week throws support at 1.3017, a prior Quasimodo resistance level, into the pot, which happens to also align closely with trend line support, taken from the low 1.1409. In the event we extend Friday’s recovery, refreshing yearly peaks and shaking hands with the 2018 yearly opening level at 1.3503 on the weekly timeframe is a possibility.
H4 perspective:
For those who read Friday’s technical briefing you may recall the following (italics):
While we are coming off weekly support at the moment (1.3250), which could have buyers take things higher from here (given the trend has faced north since late March), there is still a chance H4 could whipsaw through the weekly base to gather fresh buyers from trend line support (1.2257) and the 1.32 handle.
As evident from the chart, price did indeed squeeze lower on Friday and test the aforementioned trend line support, as well as the round number 1.32 (also represents daily support). What’s also interesting is the dip lower came within a few pips of challenging a 61.8% H4 Fibonacci retracement ratio at 1.3170, before sterling turned to reclaim space above weekly support at 1.3250.
Areas of consideration:
A H4 close above 1.33 on the H4 is likely to be interpreted as bullish strength off weekly support this week and may see a continuation to the upside as a result. This could have breakout themes target September’s opening value at 1.3364 and H4 resistance at 1.3368.
Bearish strategies, on the other hand, may be an idea should we push through the 61.8% H4 Fibonacci retracement ratio at 1.3170, targeting the 1.31 region.
AUD/USD:
Weekly gain/loss: -1.14%
Weekly close: 0.7281
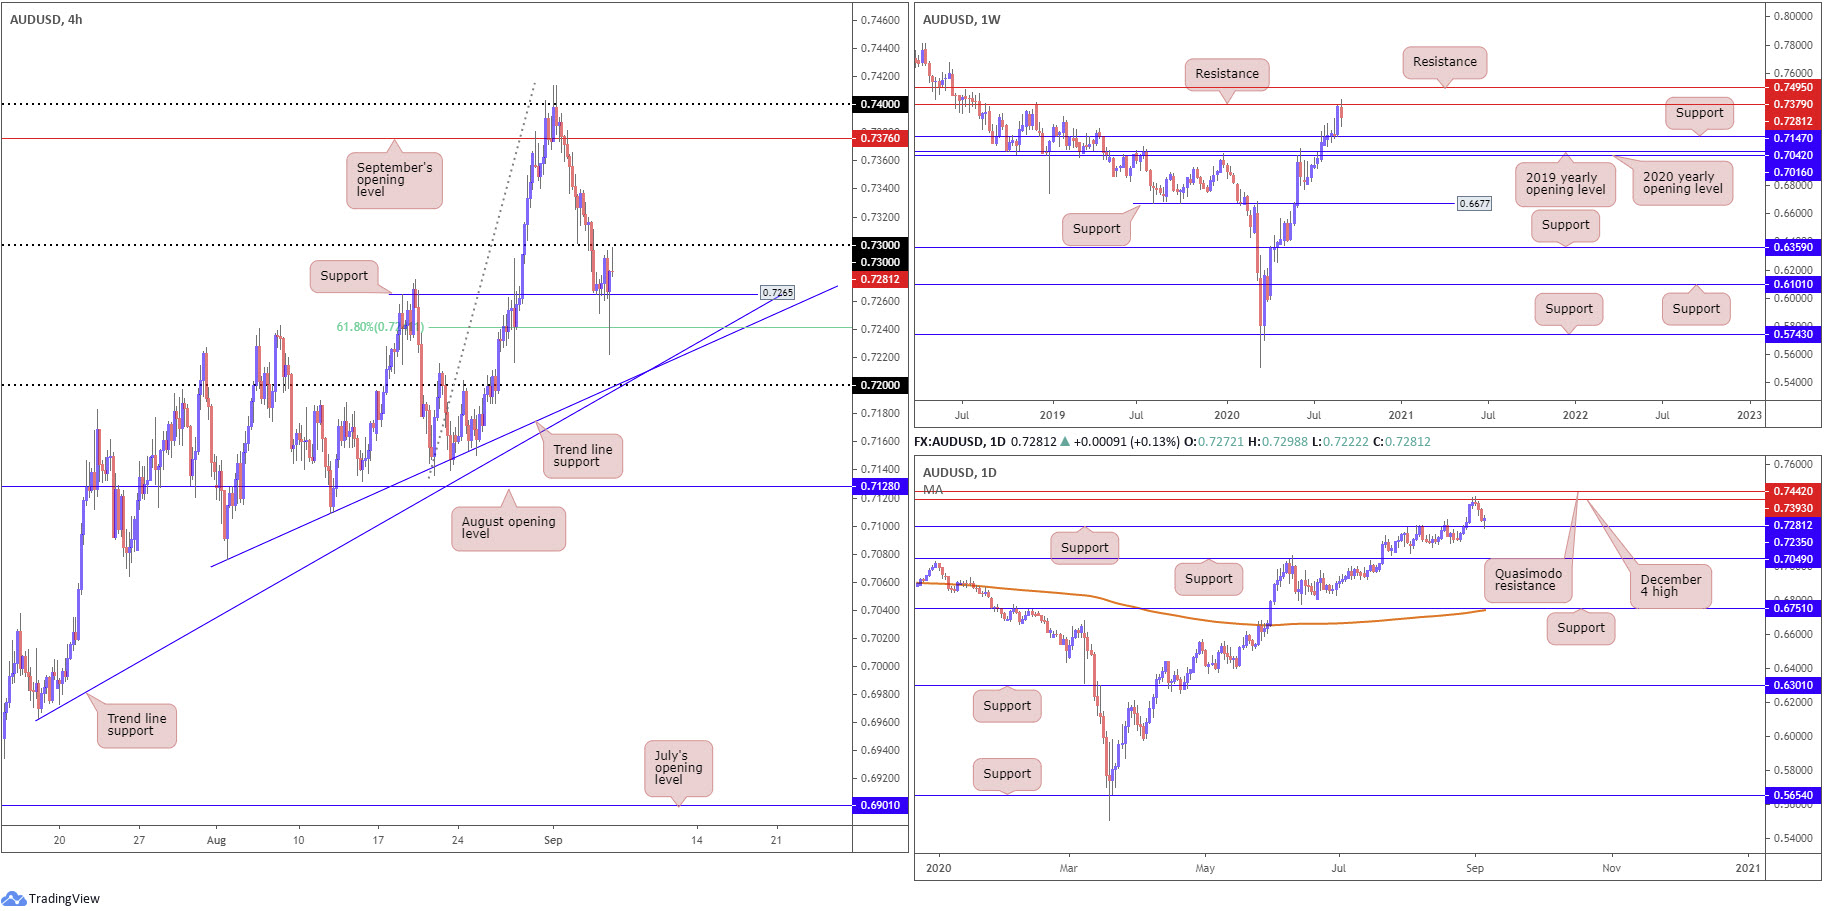
Weekly perspective:
Following an animated near-full-bodied push from support at 0.7147, longer-term activity recently crossed swords with resistance at 0.7379 and clocked fresh yearly highs at 0.7413. Given we only printed a moderate reaction, alongside the market trending northbound since early 2020, it’s difficult to determine whether sellers will strengthen their grip this week and attempt to retest the aforementioned support.
Should buyers regain consciousness, 0.7495 echoes possible resistance.
Daily perspective:
The response from the 0.7393 December 4 high (a level linking up closely with weekly resistance) had price work its way towards support coming in at 0.7235 on Friday, generating a hammer candlestick pattern (bullish signal). Should sellers take on lower levels this week, weekly support mentioned above at 0.7147, followed by a possible push for daily support located at 0.7049, could be seen.
H4 perspective:
Heading into Thursday’s close, buyers and sellers bumped heads at a support drawn from 0.7265 (prior Quasimodo resistance). The current level, despite Friday’s energetic spike to 0.7235 support on the daily timeframe (which also took on nearby 61.8% Fibonacci retracement at 0.7241), held form and brought on a late advance towards 0.73.
Areas of consideration:
Absorbing selling interest around 0.73 would not only help confirm the current trend, it’d also signal bullish intent off daily support at 0.7235 and possibly set the stage for further buying to September’s opening value at 0.7376 this week. Note this level is shadowed by weekly resistance highlighted above at 0.7379 and daily resistance (Dec 4 high) at 0.7393.
In terms of bearish strategies, its unlikely we’ll see much calling for shorts until conquering 0.72, consequently clearing the rubble for an approach to weekly support at 0.7147.
USD/JPY:
Weekly gain/loss: +0.82%
Weekly close: 106.20
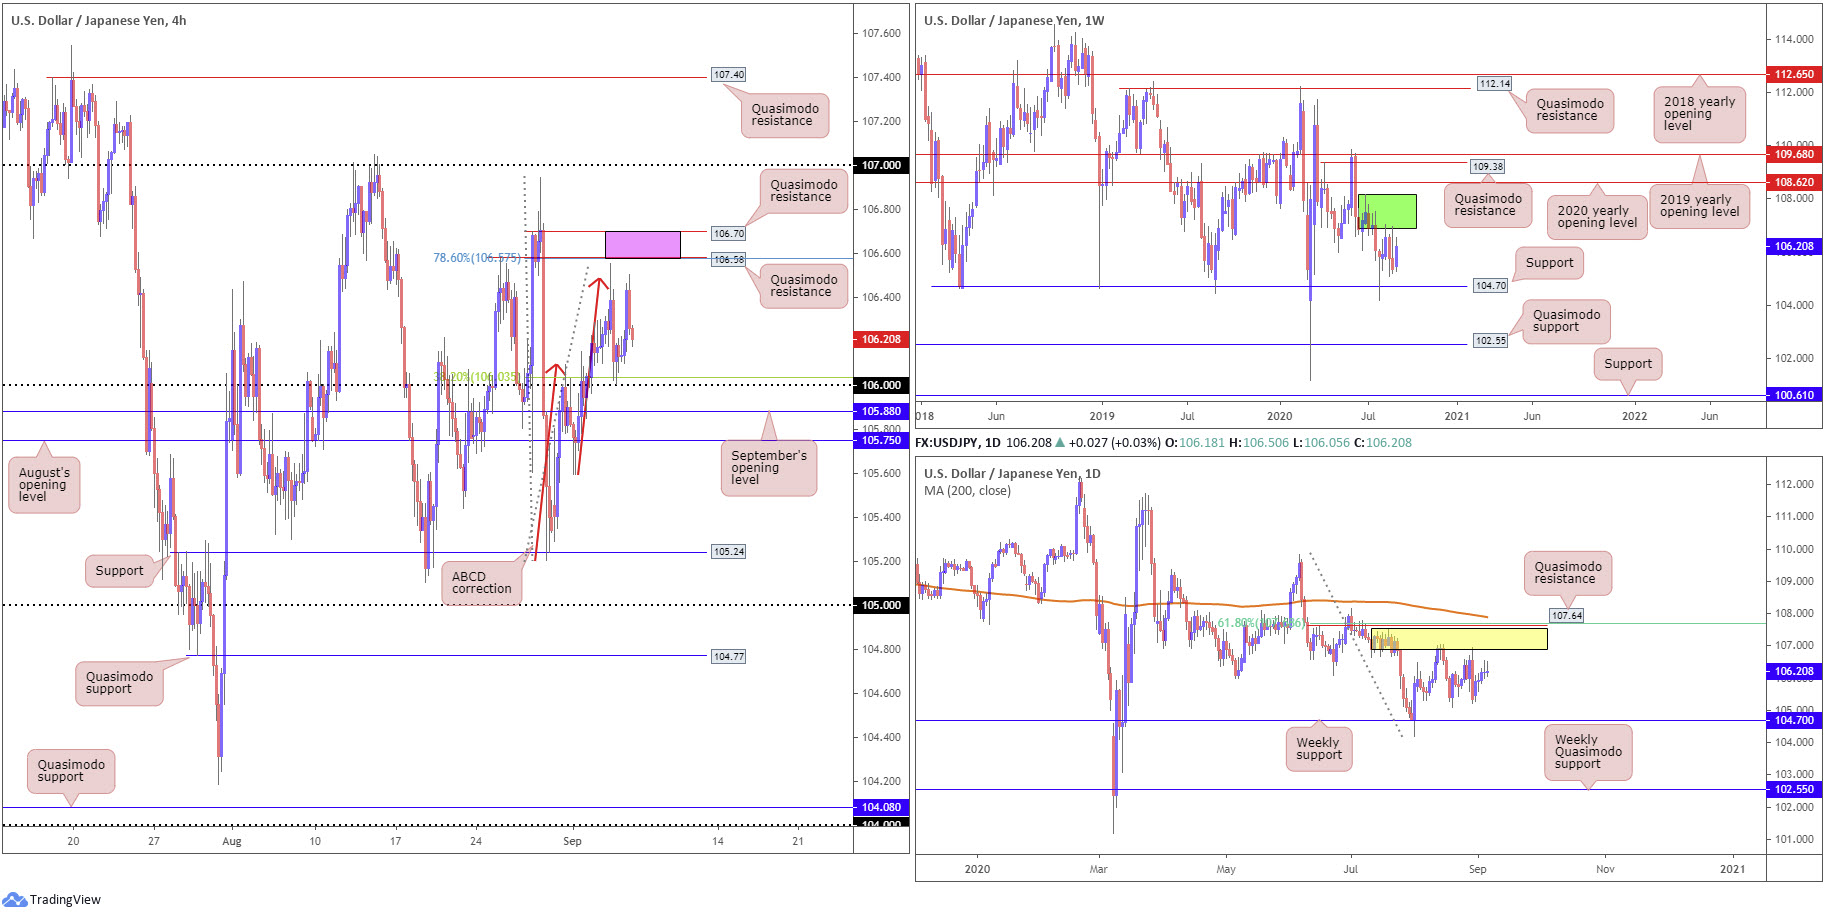
Weekly perspective:
Snapping a two-week bearish phase, USD/JPY bulls went on the offensive last week and, despite leaving support at 104.70 unchallenged, added nearly 100 pips.
Supply remains prominent at 108.16-106.88 (dark green) after price made its way off support at 104.70 at the end of July. Should buyers hold recent upside, the 2020 yearly opening level at 108.62 may eventually enter view, closely tracked by Quasimodo resistance at 109.38.
Daily perspective:
From the daily timeframe, supply at 107.55/106.89 (yellow), an area housed within the lower boundary of weekly supply mentioned above at 108.16-106.88, has proved a tough nut to crack.
Downside from current price could target weekly support underlined above at 104.70. In the event buyers climb this week, Quasimodo resistance at 107.64 might enter play, reinforced by a 61.8% Fibonacci retracement ratio at 107.68 and 200-day SMA (orange – 107.89).
H4 perspective:
Thursday fading ABCD resistance at 106.48 (red arrows) witnessed a retest at the 106 handle and a 38.2% Fibonacci retracement ratio at 106.03. Owing to the latter representing a common (initial) take-profit target out of ABCD patterns, and 106 being a watched figure, Friday responded to the upside and collided with peaks at 106.50 before pulling back and settling lower into the close.
Beyond 106 this week, price action traders will acknowledge September’s opening value at 105.88, as well as August’s opening level at 105.75. A move north throws two Quasimodo formations at 106.58 (merges with 78.6% Fibonacci resistance at 106.57) and 106.70 in the pot as possible resistances (pink area).
Areas of consideration:
The fact we have the underside of weekly and daily supply areas merging around 106.88, this could draw price to 107 this week, which might have traders attempt to fade the area. Before reaching this far north, an intraday reaction from the area moulded between the two H4 Quasimodo resistances at 106.70/106.58 could also be seen.
Another retest at 106 may also take shape, yet with buyers likely consumed from Friday’s rally, a fakeout to September’s opening level at 105.88 could come to fruition to gather sell-stop liquidity and fresh buyers.
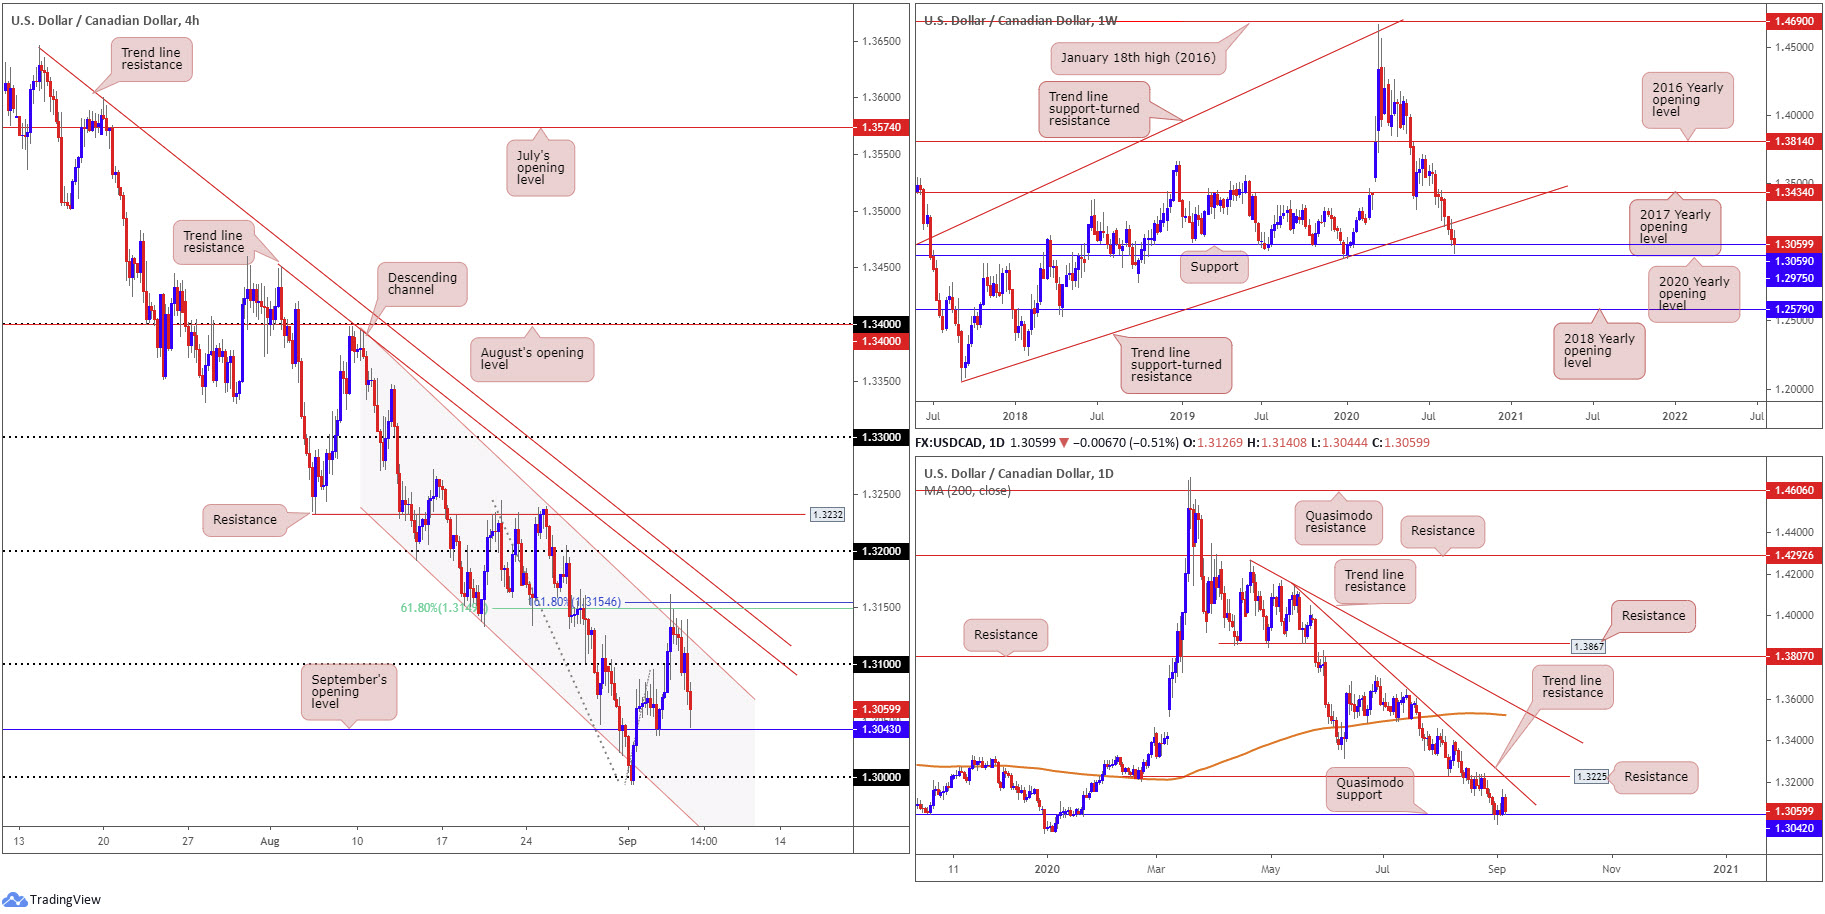
USD/CAD:
Weekly gain/loss: -0.26%
Weekly close: 1.3059
Weekly perspective:
Gliding to an eighth consecutive losing week in recent trading, price action, after securing ground under the 2017 yearly opening level at 1.3434 and trend line support (taken from the low 1.2061), crossed swords with support at 1.3059, a level positioned just north of the 2020 yearly opening level at 1.2975.
The pair, as you can see, has been probing lower since topping in mid-March at 1.4667.
Daily perspective:
Over the past week we have seen price lock horns with Quasimodo support coming in at 1.3042. Although Friday erased the majority of the week’s gains off the aforementioned support, traders are still urged to pencil in resistance at 1.3225 (a prior Quasimodo support) and trend line resistance, taken from the high 1.4140.
H4 perspective:
After Thursday took on channel resistance, taken from the high 1.3394, and a 161.8% Fibonacci extension point at 1.3154, as well as a 61.8% Fibonacci retracement ratio at 1.3149, buyers stepped aside Friday. This allowed candles to pass through 1.31 and bottom within close proximity of September’s opening level at 1.3043, which if violated, could drive things back to the key figure 1.30.
Areas of consideration:
Longer term, we are entrenched within a robust down move from 1.4667, yet currently trade from weekly support around 1.2975/1.3059. So far, weekly price has yet to show much in terms of upside pressure. Similarly, on the daily timeframe from Quasimodo support at 1.3042, Friday put a cap on further gains.
Going on the above, unless we see a decisive effort from bulls this week, bears could pursue deeper water, perhaps bringing down 1.30 on the H4 timeframe. On account of this, a retest at the underside of 1.31/H4 channel resistance could take shape this week and offer sellers an entry into the market.
USD/CHF:
Weekly gain/loss: +1.03%
Weekly close: 0.9131
Weekly perspective:
Despite the market’s trend facing a southerly trajectory since mid-2019, bulls outperformed last week and established firm position off support at 0.9014 in the shape of an outside (weekly) reversal. Price is also likely gleaning fresh impetus from ABCD support at 0.9051 (black arrows).
According to technical studies, continued upside this week targets 0.9255 resistance, a previous Quasimodo support level.
Daily perspective:
The key observation on the daily timeframe is the recently penetrated falling wedge pattern pencilled in from the high 0.9241 and a low of 0.9056. Following a mild breakout to the upside during mid-week trade, Friday went forward and cemented a strong bullish position, enough to catch the attention of other buyers.
Next on tap, with respect to possible resistance, is the 0.9187 level, followed by weekly resistance underlined above at 0.9255.
H4 perspective:
For traders who read Friday’s technical briefing you may recall the following (italics):
Similar to Wednesday, USD/CHF concluded Thursday off best levels, hampered by August’s opening level on the H4 timeframe at 0.9136. 0.91 recently came under fire. Price filled sell-stop liquidity south of the angle and tested trend line resistance-turned support, taken from the high 0.9241. So far, buyers have managed to maintain a presence off the trend line, potentially bolstered by the fact the trend line also happens to represent the upper boundary of the falling wedge pattern on the daily timeframe.
Assuming buyers absorb breakout selling pressure under 0.91, price is likely to revisit August’s opening level mentioned above at 0.9136. Reclaiming the latter could see H4 Quasimodo resistance at 0.9184 take position, closely followed by daily resistance at 0.9187.
As you can see, price did indeed take on sellers Friday and passionately ran into August’s opening level at 0.9136, tipping to highs at 0.9163.
Areas of consideration:
H4 buyers, based on the recent breakout above the daily falling wedge pattern, are likely to be watching for a move above August’s opening level at 0.9136. Not only will this give current longs confidence (those who bought the initial breakout above the daily falling wedge on Wednesday), it’s likely sufficient enough to have conservative buyers join the movement, targeting daily resistance underscored above at 0.9187, with a break exposing 0.92 on the H4 and then perhaps pushing for weekly resistance at 0.9255.
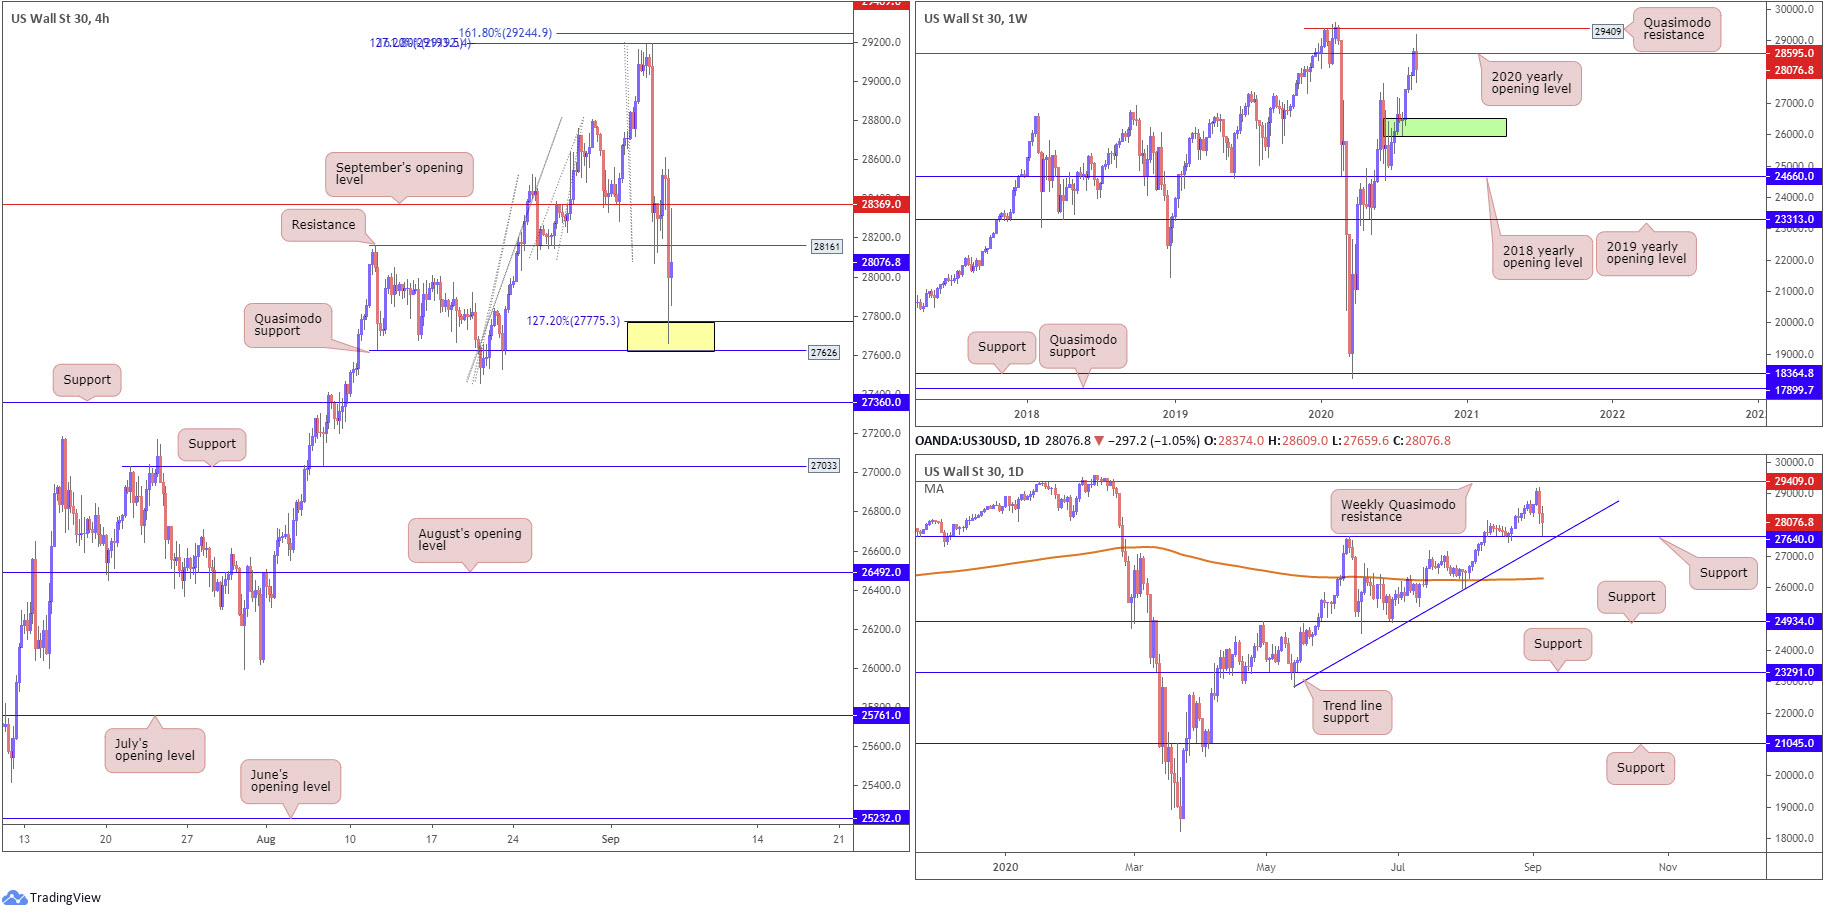
Dow Jones Industrial Average:
Weekly gain/loss: -2.05%
Weekly close: 28076
Weekly perspective:
Fashioned in the shape of a weekly outside reversal, last week had price action shatter a five-week bullish phase from around the 2020 yearly opening value at 28595.
Recent downside could stir additional selling this week, with scope to decline as far south as demand (green) at 25916-26523. Should buyers come back to life, nevertheless, this may eventually have Quasimodo resistance plotted at 29409 make an appearance.
Daily perspective:
The recent pullback, as you can see, landed price action within touching distance of support at 27640, a level shadowed closely by trend line support, taken from the low 22803. A recovery could see the unit approach recent peaks at 29193, plotted ahead of weekly Quasimodo resistance mentioned above at 29409. Dipping beyond current supports this week, though, could bring light to the 200-day SMA (orange – 26297).
H4 perspective:
US stocks cut lower again Friday, capping a tumultuous two-day stretch of trading. The Dow Jones Industrial Average declined 159.42 points, or 0.56%; the S&P 500 fell 28.10 points, or 0.81% and the tech-heavy Nasdaq 100 traded lower by 149.23 points, or 1.27%.
Thursday, technically speaking, found resistance off a Fibonacci extension cluster around the 29200 point, consisting of 127.2% and 161.8% Fibonacci extension levels. This drew candle action to support from 28161, which although buyers attempted to defend, gave way during the US morning session on Friday.
The downside break had candles greet a 127.2% Fibonacci extension point at 27775, placed north of Quasimodo support at 27626.
Areas of consideration:
Traders looking at the weekly timeframe and considering shorts on the back of last week’s reversal may contemplate waiting and seeing if daily support at 27640, together with nearby daily trend line support (22803), is taken out before committing to a position.
The area marked in yellow on the H4 timeframe may also be of interest to buyers this week, having seen the base consist of a H4 Quasimodo support at 27626, a 127.2% H4 Fibonacci extension point at 27775 and daily support from 27640.
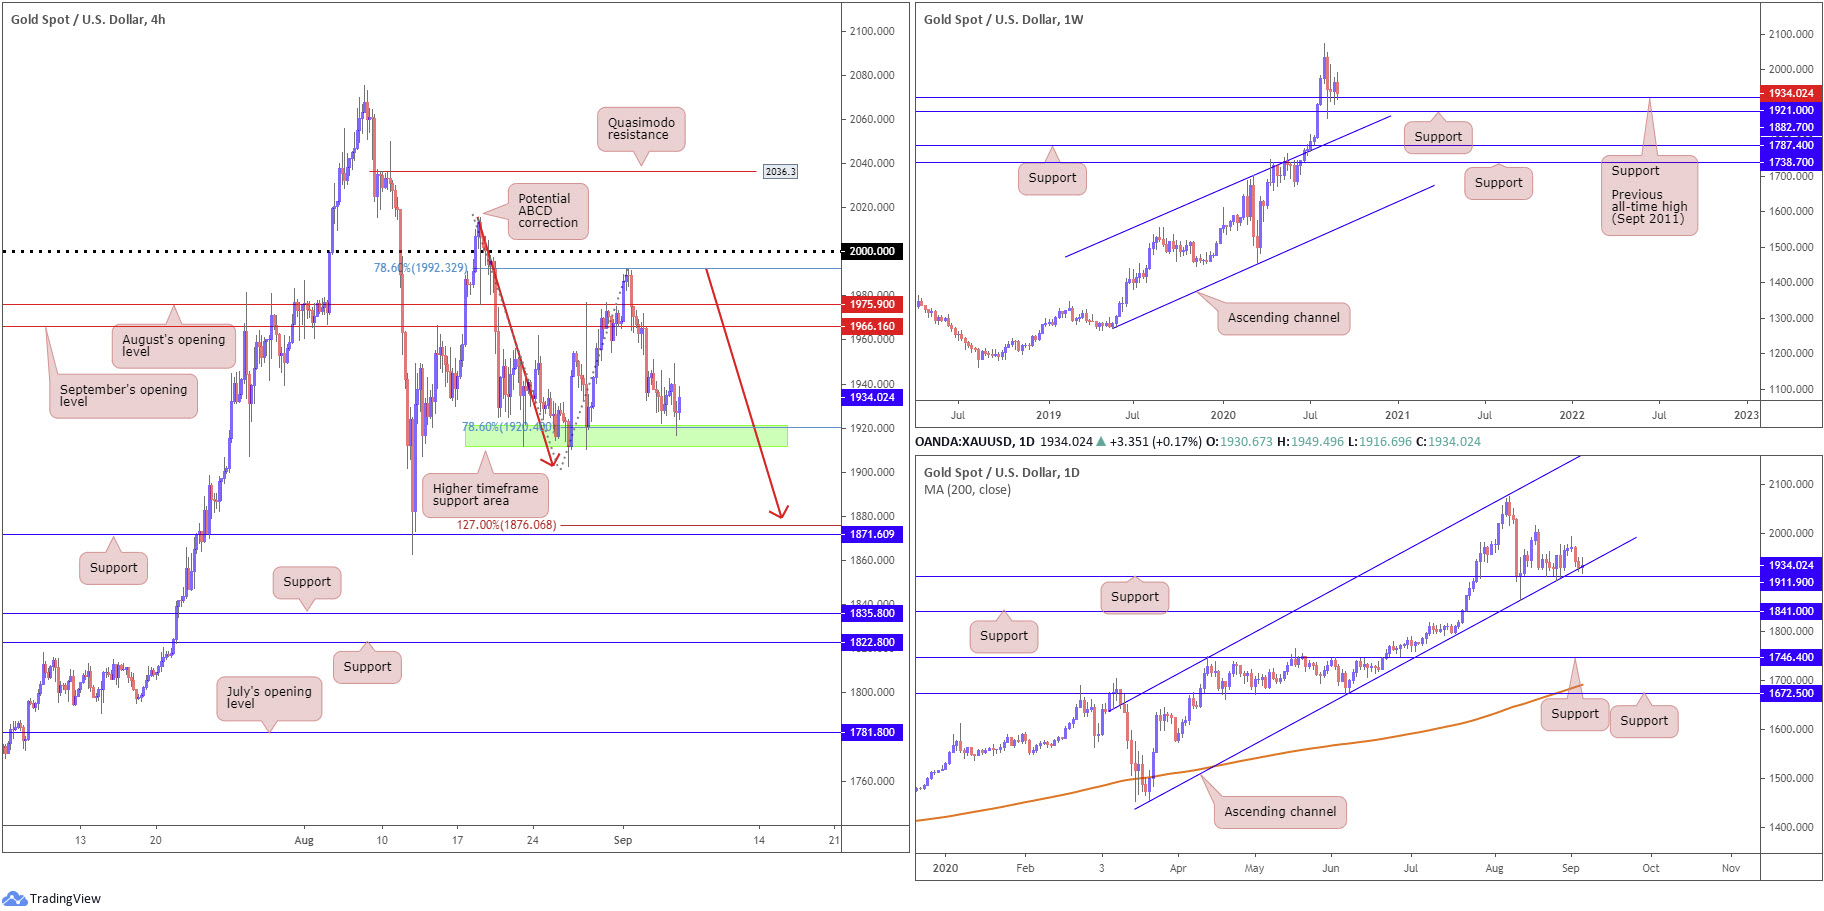
XAU/USD (GOLD):
Weekly gain/loss: -1.58%
Weekly close: $1,934.02
Weekly perspective:
Spot gold finished the week in modestly negative territory, but remains trading from $1,921.00 support, the previous major all-time high (September 2011). This is a level located ahead of support at $1,882.70.
With the current trend trekking north since 2016, despite last week’s loss, the combination of $1,882.70 and $1,921.00 may still be enough to encourage additional buying this week, with most targeting all-time peaks at $2,075.28 as the initial point. Failure to hold gains, however, could see channel resistance-turned support, etched from the high $1,703.28, enter view.
Daily perspective:
A closer reading of price action on the daily timeframe shows current flow testing channel support, extended from the low $1,455.32, a configuration that begun forming in March. Also worth taking into account is support situated nearby at $1,911.90.
Breaking higher this week positions the $1,992.56 September 1 high as possible resistance, with a break pushing for the $2,015.72 August 18 high.
H4 perspective:
H4, as you can see on Friday, recently stabbed into a familiar area of higher timeframe support at $1,911.90-$1,921.00 (green). Areas to keep a tab on should an advance from the aforementioned zone transpire this week are September’s opening value at $1,966.16, and August’s opening value coming in at $1,975.90.
Another possibility on the H4 timeframe, assuming we overrun higher timeframe supports, is the completion of an ABCD correction (red arrows) at $1,879.94, with a BC projection standing at (1.27) $1,876.06 (given leg C terminated at 78.6%), ahead of support coming in at $1,871.60.
Areas of consideration:
Overall, this remains a buyers’ market, according to the current trend – higher since bottoming in 2016.
Traders are likely to monitor price action closely at the $1,911.90-$1,921.00 higher timeframe support area in early trading this week, based on the H4 scale (green). A H4 bullish candlestick formation printed from this region, for example, may draw in buyers and target $1,966.16/$1,975.90.
The accuracy, completeness and timeliness of the information contained on this site cannot be guaranteed. IC Markets does not warranty, guarantee or make any representations, or assume any liability regarding financial results based on the use of the information in the site.
News, views, opinions, recommendations and other information obtained from sources outside of www.icmarkets.com.au, used in this site are believed to be reliable, but we cannot guarantee their accuracy or completeness. All such information is subject to change at any time without notice. IC Markets assumes no responsibility for the content of any linked site.
The fact that such links may exist does not indicate approval or endorsement of any material contained on any linked site. IC Markets is not liable for any harm caused by the transmission, through accessing the services or information on this site, of a computer virus, or other computer code or programming device that might be used to access, delete, damage, disable, disrupt or otherwise impede in any manner, the operation of the site or of any user’s software, hardware, data or property.


