
EUR/USD:
Weekly Gain/Loss: -0.35%
Weekly Close: 1.1396
Weekly perspective:
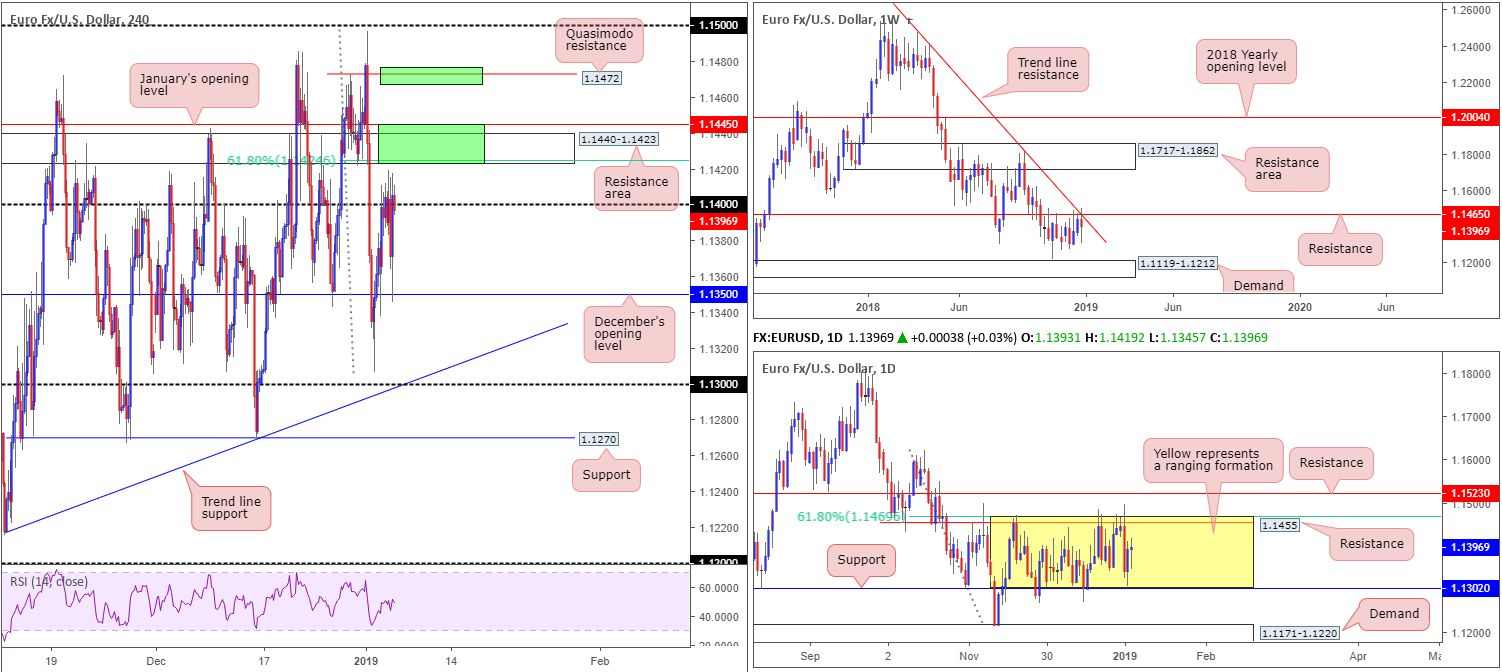
Try as it might, the EUR/USD failed to muster sufficient strength to overthrow merging resistance at 1.1465 and trend line resistance (extended from the high 1.2476) in the opening week of 2019, consequently chalking up a bearish engulfing formation. Further selling from this point has demand at 1.1119-1.1212 to target this week, whereas a rotation north exposes a resistance area parked at 1.1717-1.1862.
Daily perspective:
A closer reading, however, underscores a reasonably firm range between resistance at 1.1455 (converging 61.8% Fibonacci resistance value at 1.1469) and support located at 1.1302 (yellow). Areas of interest outside of this border fall in at resistance drawn from 1.1523 and a demand area coming in at 1.1171-1.1220. It might also interest traders who focus on correlations to note the US dollar index indicates clean support entered the mix at the turn of the year around the 95.76 neighbourhood.
H4 perspective:
Friday’s non-farm payrolls widely exceeded expectations, adding 312k jobs in December compared to the 179k consensus. Average hourly earnings rose 0.4% last month, beating expectations of 0.3%, while the US unemployment rate ticked higher to 3.9% from 3.7%.
The impact of the US employment report drove the EUR/USD to lower ground, though the move was relatively short lived. The H4 candles established support off December’s opening level at 1.1350, as Fed’s Powell sounded a cautious tone regarding the economic outlook, consequently recouping daily losses.
Areas of consideration:
Having seen the market wrap up the week just south of its 1.14 handle, the research team has eyes on two potential H4 sell zones today/early week (green).
The first comes in at 1.1445/1.1423, comprised of January’s opening level at 1.1445, a H4 resistance area at 1.1440-1.1423 and a 61.8% H4 Fibonacci resistance value at 1.1424. Although this area houses limited higher-timeframe resistance, it’s local confluence will likely be enough to draw in sellers.
The second point of interest this week is seen at 1.1472: a H4 Quasimodo resistance level. Circulating around the top edge of the current daily range (1.1455), and positioned a handful of pips above weekly resistance at 1.1465, the 1.1472 region will likely contain active sellers from all three timeframes.
Stop-loss placement, in terms of the first area, appears best above 1.1445, with the expectation of a H4 close forming beneath 1.14 to reduce risk to breakeven. Beyond 1.14, the next support target falls in around December’s opening level at 1.1350. As for the second zone, stop-loss placement is likely best sited beyond the 1.15 handle as this clears the Quasimodo apex (1.1496). The first area of trouble from 1.1472 is expected to emerge around January’s opening level mentioned above at 1.1445.
Traders are urged to consider risk/reward considerations prior to pulling the trigger.
Today’s data points: US ISM Non-Manufacturing PMI.
GBP/USD:
Weekly Gain/Loss: +0.21%
Weekly Close: 1.2721
Weekly perspective:
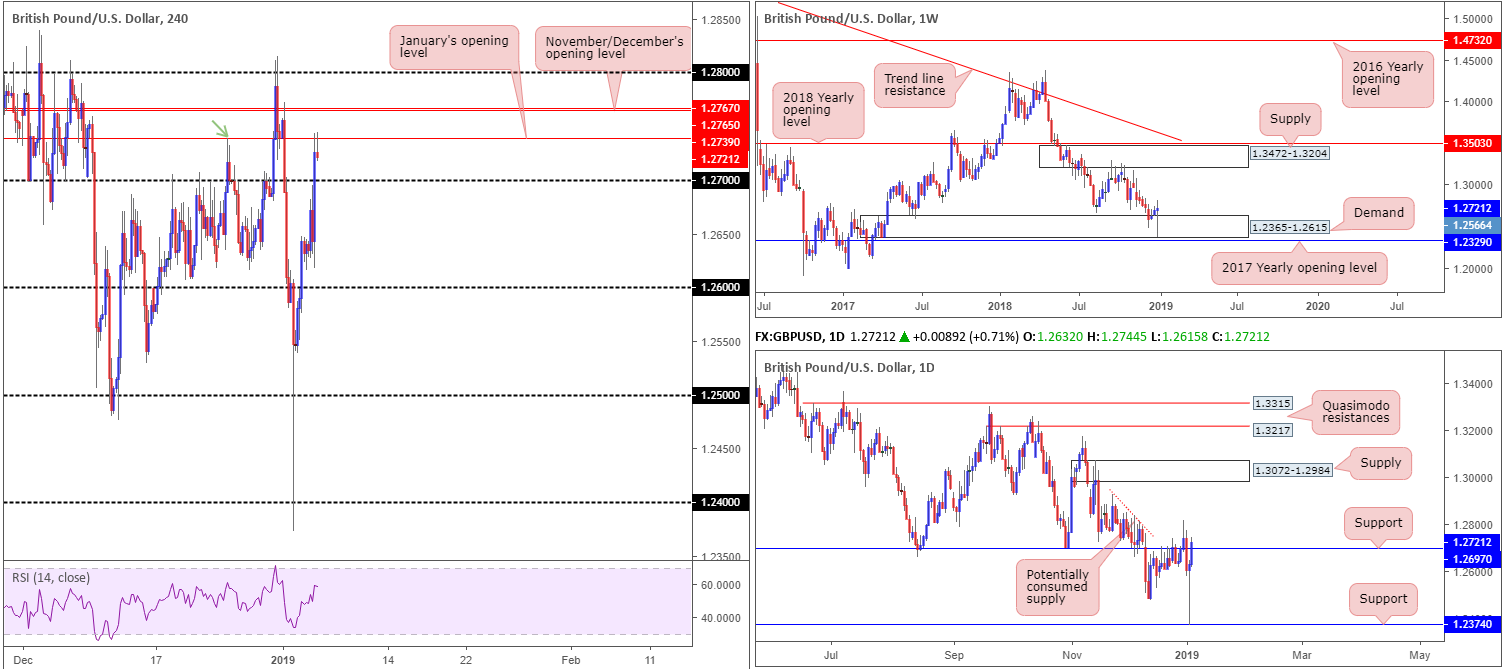
Cable firmly entered the parapets of demand at 1.2365-1.2615 in the opening stages of the year, challenging the lower borders of the area before finding willing buyers and pushing higher. Assuming buyers remain defensive, a run towards supply painted at 1.3472-1.3204 may be in store over the coming weeks.
Daily perspective:
In conjunction with weekly movement, daily activity concluded recent trade closing marginally above resistance priced in at 1.2697 (now acting support). Continued buying from this point could lead to a test of supply at 1.3072-1.2984, according to our technical studies. Above 1.2697, limited supply is visible, with a major portion likely consumed as price declined lower in late November of 2018 (see red descending line).
H4 perspective:
Upward momentum diminished amid early US trade Friday, following an upbeat US employment report. Despite erasing daily gains and clocking fresh session lows, the pair swiftly hit the brakes and gained traction to the upside after Fed Chairman Jerome Powell took to the stage, reiterating FOMC policy is not on a pre-set path.
The move higher lifted the H4 candles beyond 1.27 to January’s opening level at 1.2739, which also happens to represent a Quasimodo resistance (green arrow). It might also be worth noting the day ended in the shape a reasonably nice-looking H4 bearish pin-bar formation.
Note just beyond 1.2739 the chart underlines November and December’s opening levels at 1.2767/65, followed closely by the 1.28 handle.
Areas of consideration:
In spite of both weekly and daily price showing signs of further upside this week, entering long on the H4 timeframe at current price is chancy given current resistance, and a H4 bearish candlestick configuration to boot.
Despite H4 resistance, though, higher-timeframe buyers, which should take precedence over lower-timeframe counterparts, appear on a strong footing. For that reason, should traders observe the 1.27 handle hold ground (which also effectively represents daily support at 1.2697) and price action chalk up a reasonably solid bullish candlestick formation, a long in this market could still be worth considering (entry/stop parameters can be defined according to this pattern).
Today’s data points: US ISM Non-Manufacturing PMI.
AUD/USD:
Weekly Gain/Loss: +1.03%
Weekly Close: 0.7114
Weekly perspective:
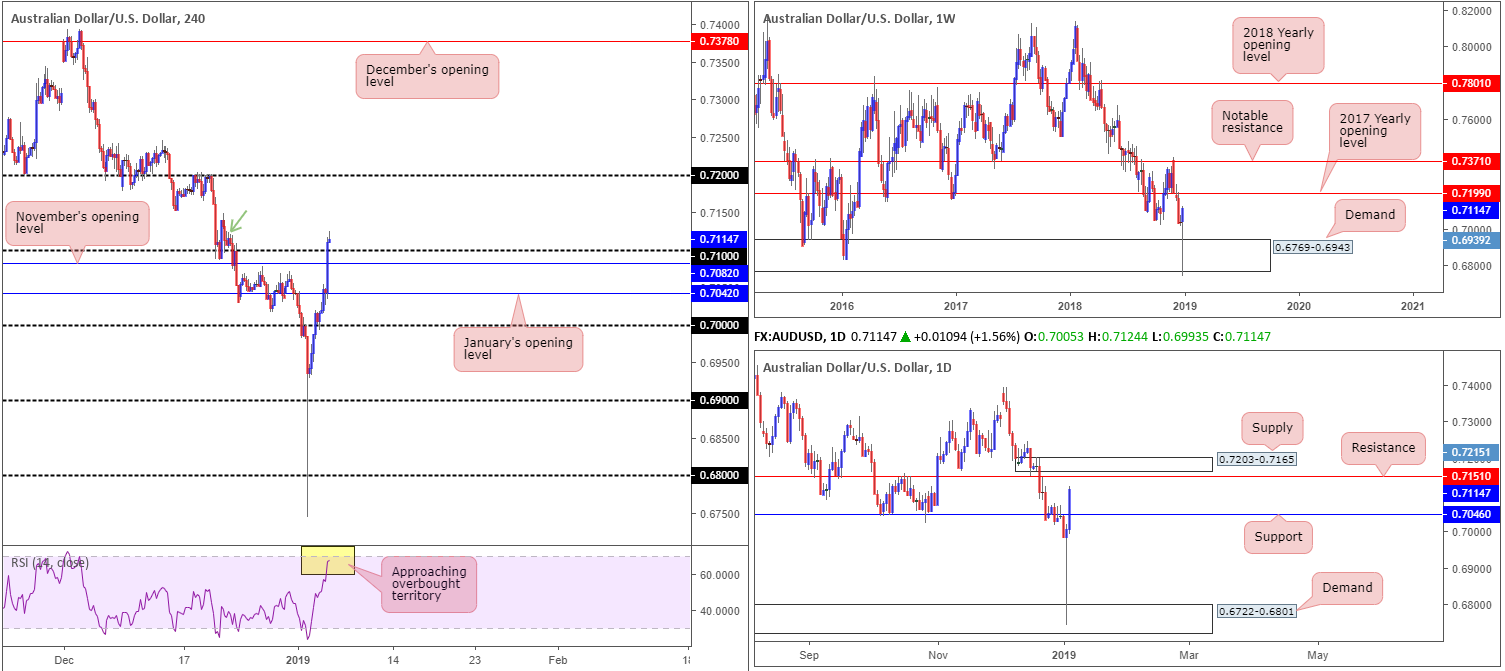
By way of a mammoth bullish pin-bar formation out of demand priced in at 0.6769-0.6943, the Australian dollar kicked off the year on a high note. Recent movement has also potentially set the stage for further buying this week at least until we cross swords with the 2017 yearly opening level coming in at 0.7199.
Daily perspective:
In similar fashion to weekly structure, the daily candles are free of any obvious resistance until shaking hands with 0.7151, followed closely by a supply zone pictured at 0.7203-0.7165. Before reaching these areas, however, traders may want to pencil in the possibility of a pullback developing towards support at 0.7046.
H4 perspective:
After turning slightly negative around 0.7040ish following strong employment data out of the United States Friday, the AUD/USD rose sharply as the greenback came under heavy selling pressure on Fed Powell’s relatively dovish comments. The move, as you can see, pulled the H4 candles above 0.71, reaching highs of 0.7124 on the day.
While a number of traders will have eyes on 0.72 (represents the 2017 yearly opening level at 0.7199 on the weekly timeframe) as the next upside target on this scale, potential sellers reside around supply at 0.7148-0.7113 (green arrow), coupled with the RSI indicator seen fast approaching overbought territory (yellow).
Areas of consideration:
On account of the above reading, the research team notes price action could simply continue to press for higher ground today/early week and eventually test 0.72ish, which, as we already know, denotes higher-timeframe resistance.
On the other hand, there’s also a chance we could be in for a pullback given the current H4 supply and RSI overbought signal. The question is, however, a pullback to where? At first glance, 0.71 appears optimal, though January’s opening level at 0.7042 is also an appealing support knowing it converges closely with daily support at 0.7046.
In the event price does indeed rotate lower, longs from 0.71 or 0.7042 are attractive. In order to secure a trade, the research team recommends waiting for additional candlestick confirmation to form. That way, you’ll be able to identify which level is of interest to buyers, as well as having a structure offering defined entry/stop parameters.
As far as upside targets are concerned, 0.7151 (daily resistance) and the 0.72 handle are both logical take-profit zones.
Today’s data points: US ISM Non-Manufacturing PMI.
USD/JPY:
Weekly Gain/Loss: -1.65%
Weekly Close: 108.50
Weekly perspective:
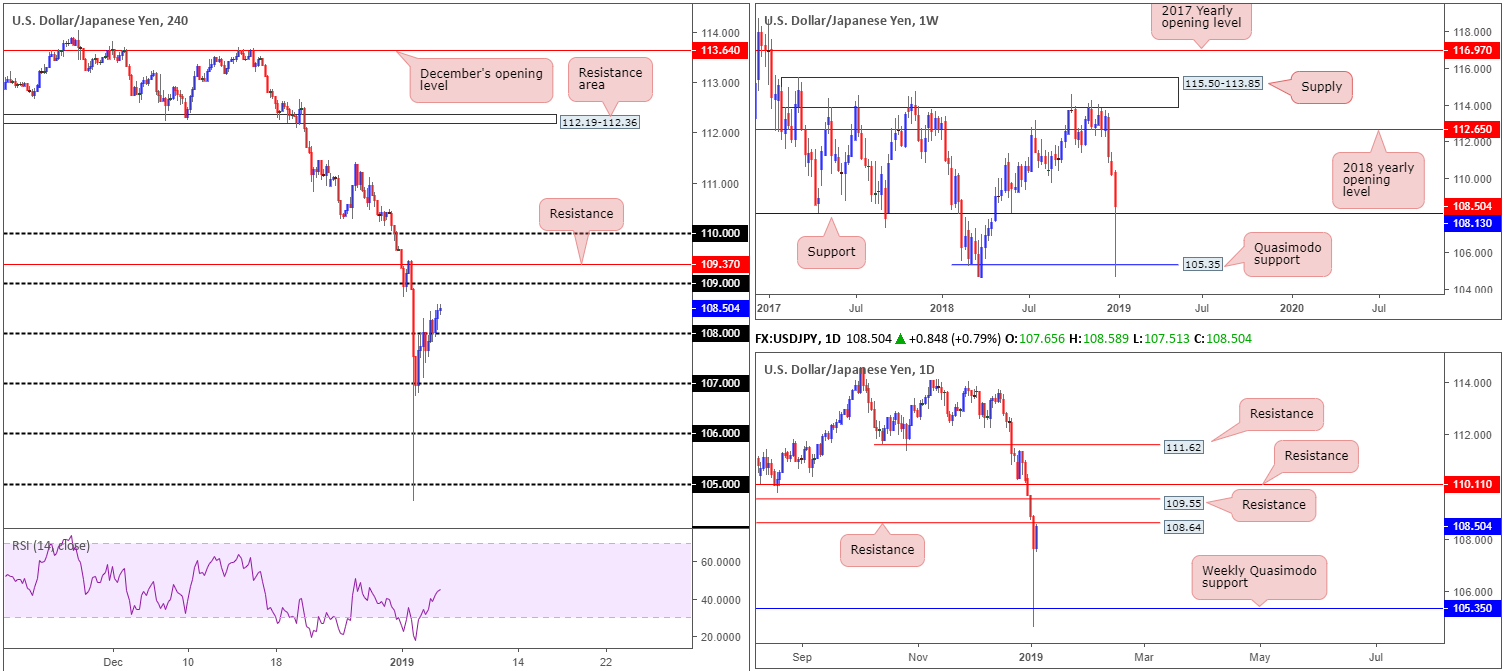
Having seen the pair range a whopping 580 pips on the week, the USD/JPY managed to reclaim position above support at 108.13 after finding willing buyers off Quasimodo support carved from 105.35. On this timeframe, the research team notes a relatively clear path to the upside over the coming weeks until connecting with the 2018 yearly opening level at 112.65.
Daily perspective:
The story on the daily timeframe, nevertheless, appears to be throwing up a few red flags. As you can see from the chart, the unit wrapped up the week closing within striking distance of a resistance level at 108.64 – essentially a Quasimodo support-turned resistance. Another layer of resistance in the same form is seen directly above this at 109.55, shadowed closely by another point at 110.11.
H4 perspective:
Friday’s price action on the H4 timeframe was reasonably subdued considering upbeat US employment figures hit the wires, along with dovish comments seen aired from Federal Reserve Chairman Jerome Powell. The candles did, however, manage to conquer 108 to the upside in early Asia and found willing buyers defending the level as support amid the London open. Price action remained protective of 108 into the closing bell, settling mi-way between 108 and 109.
Areas of consideration:
With daily price yet to connect with resistance at 108.64, our technical studies still shows a possible retest play developing at 108 today/early week. If price should test daily resistance prior to pulling back to 108, this is then considered a chancy long as higher-timeframe sellers will likely be involved.
Therefore, a retest of 108, preferably in the shape of a bullish candlestick formation (entry/stop parameters can be defined according to this pattern), targeting 108.64 as the initial port of call is on the radar going forward. Beyond 108.64, the 109 handle is next in the firing range, tailed by H4 resistance at 109.37 and then another daily resistance at 109.55.
Today’s data points: US ISM Non-Manufacturing PMI.
USD/CAD:
Weekly Gain/Loss: -1.96%
Weekly Close: 1.3370
Weekly perspective:
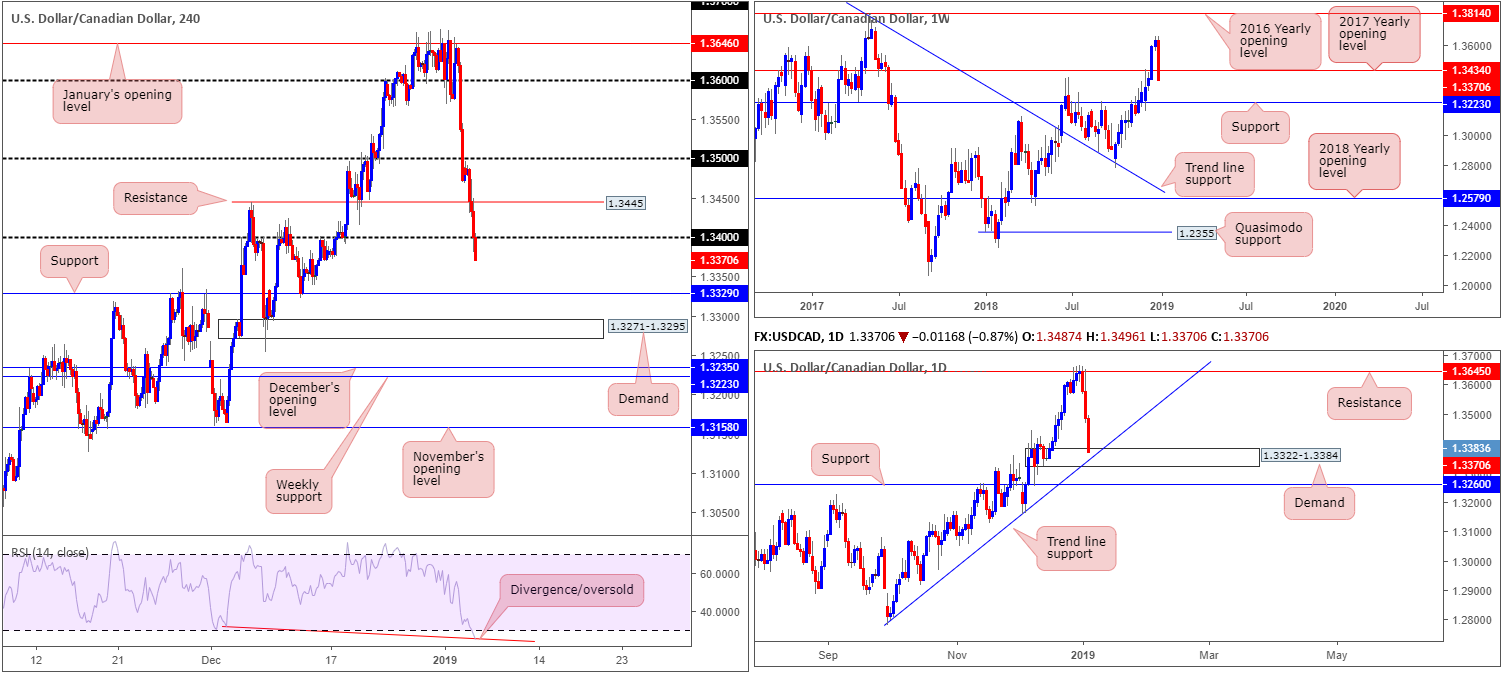
The US dollar surrendered considerable ground to its Canadian counterpart last week, closing on its lows and breaking a six-week bullish run. Such a strong bearish candle, coupled with the fact price action closed beneath its 2017 yearly opening level at 1.3434, has potentially set the stage for further selling this week towards support sited at 1.3223.
Daily perspective:
Contrary to weekly structure, price action on the daily timeframe wrapped up the week testing demand at 1.3322-1.3384, which happens to converge with a trend line support (etched from the low 1.2782). Let’s also be mindful to the fact potential support exists just south of this area at 1.3260.
H4 perspective:
The pair briefly spiked higher before returning to pre-announcement levels in the wake of the simultaneous Canadian and US jobs report Friday, with both showing a modest beat on headline readings. Comments from Fed’s Powell triggered further downside along with higher crude oil prices, ultimately pressuring the candles beneath 1.34 at the closing stages of the day. It may also be of interest to some traders to note the RSI indicator is seen displaying an oversold/divergence reading.
Beyond 1.34, the next support target in view can be seen at 1.3329, trailed closely by demand pictured at 1.3271-1.3295 and then December’s opening level at 1.3235/weekly support at 1.3223.
Areas of consideration:
- A bounce higher from H4 support at 1.3329 is a possibility given its relationship with daily demand at 1.3322-1.3384.
- The H4 demand zone mentioned above at 1.3271-1.3295 is also likely to provide a bounce to the upside, though do bear in mind this area is positioned beneath the aforementioned daily demand and just ahead of weekly support at 1.3223 and also daily support at 1.3260.
- Another area worthy of consideration for longs this week is December’s opening level at 1.3235, having seen its connection with weekly support.
Irrespective of which area you choose, if any, traders are urged to take into account risk/reward parameters before pulling the trigger.
Today’s data points: US ISM Non-Manufacturing PMI; CAD Ivey PMI.
USD/CHF:
Weekly Gain/Loss: +0.25%
Weekly Close: 0.9863
Weekly perspective:
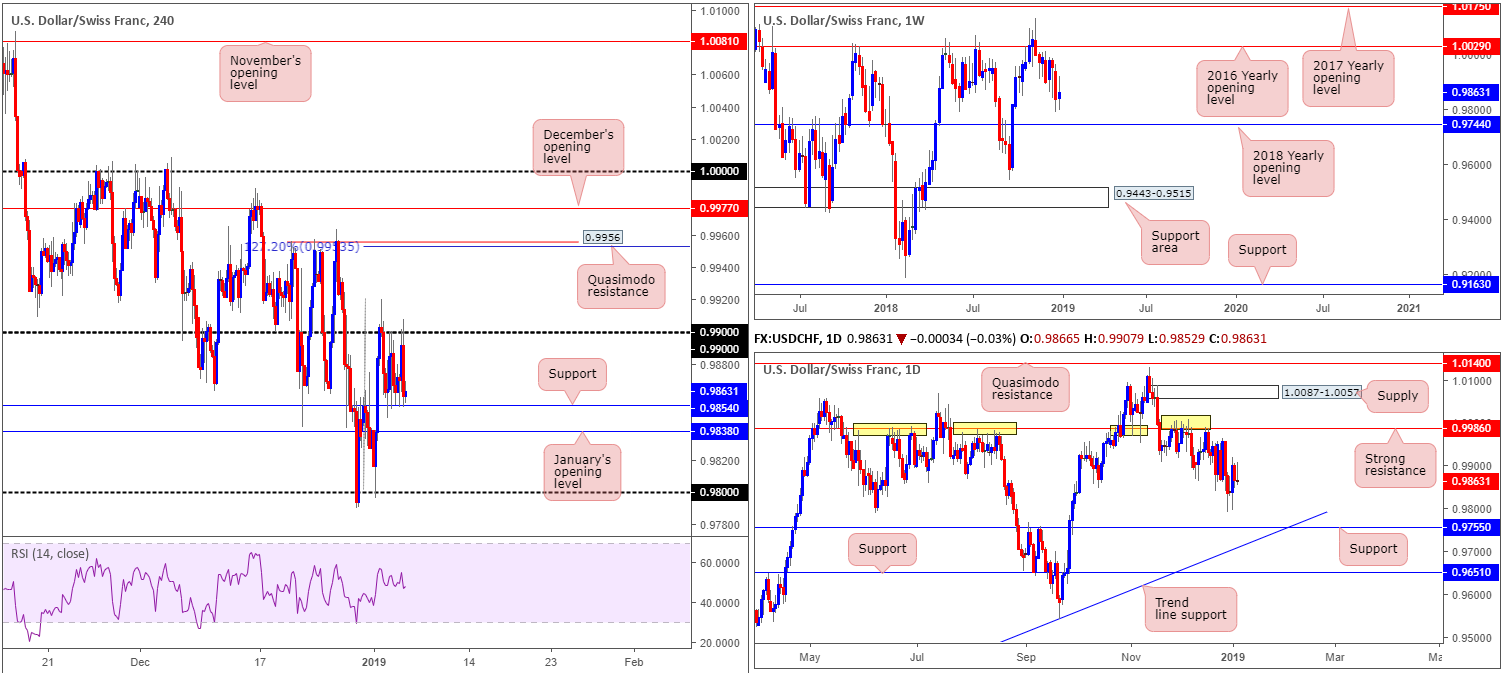
Our technical studies on the weekly timeframe reveal price action is seen meandering just north of the 2018 yearly opening level at 0.9744. What this tells us is there’s scope for a round of selling in this market at least until we reach this level of support. Beyond here, the team notes an absence of support until the 0.9524 September 17 low (2018), tailed closely by a support area visible at 0.9443-0.9515.
Daily perspective:
Sited ten pips above the 2018 yearly opening level is daily support at 0.9755. What’s notable from a technical perspective here is the connection this level has with trend line support (taken from the low 0.9187). As a result, this is certainly a number worth watching over the coming week.
H4 perspective:
Trading volume, as you can see, remained thin Friday as buyers and sellers continued to battle for position between the 0.99 handle and support priced in at 0.9854. Areas of interest outside of this intraday range fall in at a Quasimodo resistance carved from 0.9956 (also holds a 127.2% Fibonacci ext. point at 0.9953), January’s opening level at 0.9838 and the 0.98 handle.
It is likely intraday traders will still be looking to trade the limits of the current H4 range today. Overall, though, the research team believes price will eventually give way and look to discover lower ground, in view of what the higher-timeframe picture is currently telling us.
Areas of consideration:
Although scope for further downside is present on the bigger picture, selling this market on the H4 is particularly difficult. Even with a H4 close printed sub 0.9838, traders are left with little room for maneuver before possible buying emerges out of 0.98.
A H4 close above 0.99, on the other hand, is interesting from a H4 perspective for possible longs towards 0.9956, though do bear in mind by attempting to trade this move you’re potentially trading against higher-timeframe flow here.
Today’s data points: US ISM Non-Manufacturing PMI.
Dow Jones Industrial Average:
Weekly Gain/Loss: +1.48%
Weekly Close: 23387
Weekly perspective:
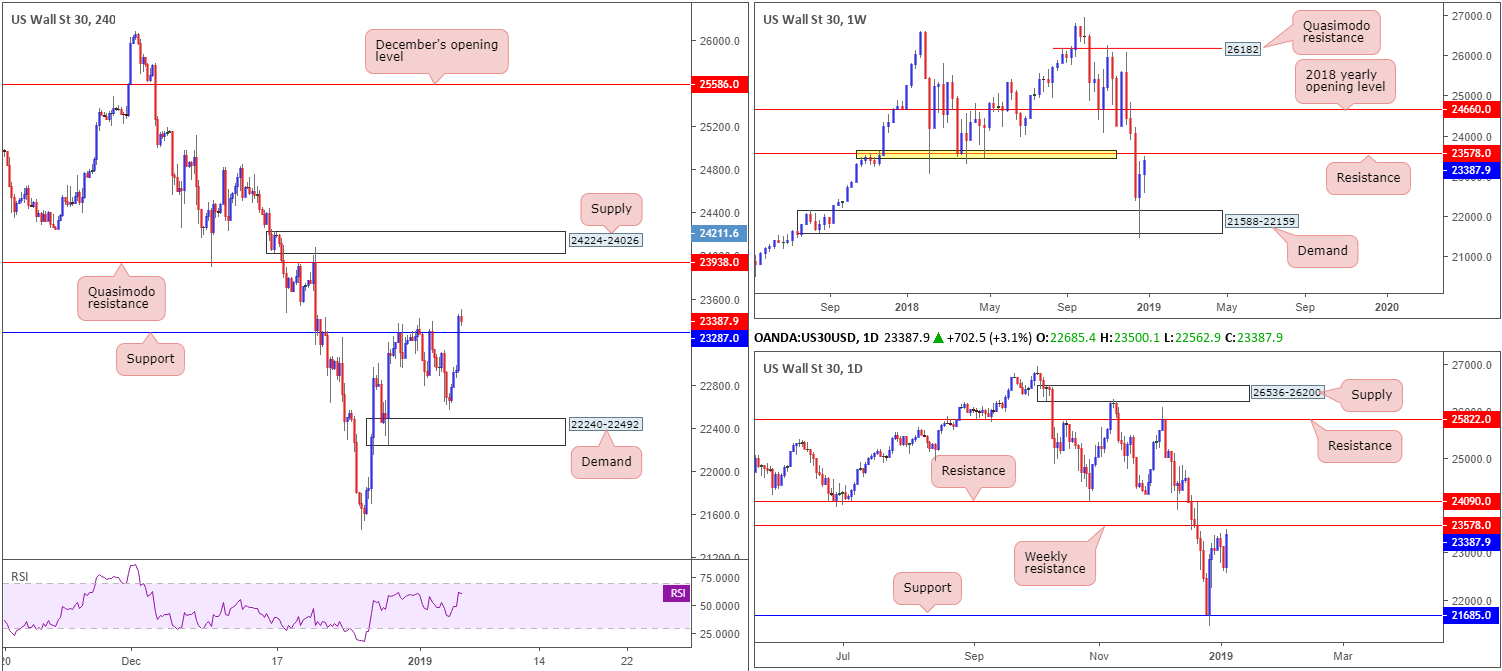
US equities started 2019 on firm footing, extending the prior week’s upside move out of nearby demand registered at 21588-22159. According to this timeframe, though, further buying is problematic having seen the unit conclude recent trade within close proximity to resistance coming in at 23578. As is evident from its history (yellow), the level once provided strong support, which could, theoretically, be mirrored as resistance this week.
Daily perspective:
As of current price, not much difference is seen between the weekly and daily timeframes at the moment. The only points worth penciling in is daily resistance resting above weekly resistance at 24090, and Friday’s strong bullish engulfing formation.
H4 perspective:
Market sentiment received fresh impetus Friday on Fed Chairman Powell’s remarks, reiterating FOMC policy is not on a pre-set path and that the Fed will be patient in watching data. Powell added that amid mixed signals, Fed policy would be about risk management.
This, as you can see, lifted the index above resistance at 23287 (now acting support), attacking levels not seen since December 20, 2018. Why we chose 23287 is simply down to its historical significance dating as far back as November 2017. What this move has also likely accomplished, on this timeframe at least, is possibly clear the runway north towards Quasimodo resistance at 23938, shadowed closely by supply at 24224-24026.
Areas of consideration:
Despite an indication H4 price likely wants higher levels, buying this market on the retest of H4 support at 23287 is awkward knowing you’re effectively buying into higher-timeframe structure (see above). Therefore, exercise caution here, fellow traders.
In regard to selling this market on the H4 timeframe, we see very little on the radar until the resistance at 23938 and supply drawn from 24224-24026 enters the mix. What we like about these two areas is the close connection they have with daily resistance plugged in at 24090. As such, should H4 action chalk up a bearish candlestick formation from the H4 resistances this week (entry/stop parameters can be defined according to this pattern), a short would be considered high probability according to our technical interpretation, targeting H4 support at 23287 as the initial port of call.
Today’s data points: US ISM Non-Manufacturing PMI.
XAU/USD (Gold):
Weekly Gain/Loss: +0.36%
Weekly Close: 1284.8
Weekly perspective:
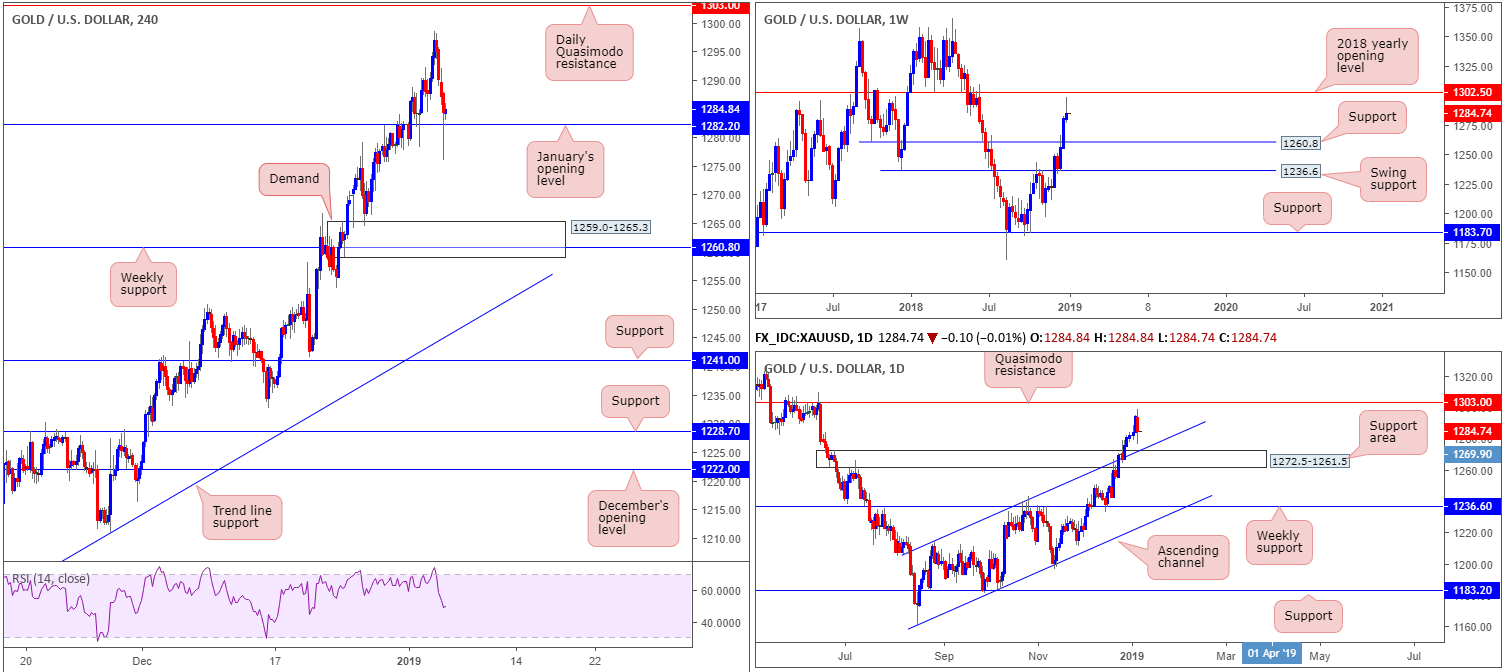
Leaving its 2018 yearly opening level at 1302.5 unopposed, the price of gold curved lower against its US counterpart last week. Though still managing to wrap up the session in the green, the closing weekly candle printed a nice-looking bearish pin-bar formation, which could entice sellers into the market over the coming week towards support at 1260.8.
Daily perspective:
Alongside our weekly bearish pin-bar pattern, Friday’s movement on the daily timeframe concluded in the shape of a bearish engulfing configuration. While these two patterns may be enough to draw in further selling, downside on the daily timeframe appears restricted given a visible support area lurking nearby at 1272.5-1261.5 that’s bolstered by a channel resistance-turned support (taken from the high 1214.3).
H4 perspective:
Topping at 1298.5 in early trade Friday and retreating lower throughout the day, this enabled the H4 candles to reconnect with January’s opening level drawn from 1282.2.
While some traders may view this as an opportunity to buy this market, targeting the 2018 yearly opening level mentioned above on the weekly timeframe at 1302.5/daily Quasimodo resistance at 1303.0, let’s keep in mind 1282.2 lacks higher-timeframe support. In addition to this, it is also worth remembering both the weekly and daily timeframes recently printing bearish candlestick signals.
Areas of consideration:
In light of the above reading, the research team has eyes on the H4 demand zone coming in at 1259.0-1265.3 as a possible area for longs this week. Not only is the area connected to weekly support at 1260.8, it is also housed within the lower limits of the current daily support area at 1272.5-1261.5.
With stop-loss orders tucked beneath the lower edge of the current H4 demand (1259.0), a rotation from this area is high probability, given the overall market picture.
The use of the site is agreement that the site is for informational and educational purposes only and does not constitute advice in any form in the furtherance of any trade or trading decisions.
The accuracy, completeness and timeliness of the information contained on this site cannot be guaranteed. IC Markets does not warranty, guarantee or make any representations, or assume any liability with regard to financial results based on the use of the information in the site.
News, views, opinions, recommendations and other information obtained from sources outside of www.icmarkets.com.au, used in this site are believed to be reliable, but we cannot guarantee their accuracy or completeness. All such information is subject to change at any time without notice. IC Markets assumes no responsibility for the content of any linked site. The fact that such links may exist does not indicate approval or endorsement of any material contained on any linked site.
IC Markets is not liable for any harm caused by the transmission, through accessing the services or information on this site, of a computer virus, or other computer code or programming device that might be used to access, delete, damage, disable, disrupt or otherwise impede in any manner, the operation of the site or of any user’s software, hardware, data or property.


