Waiting for lower timeframe confirmation is our main tool to confirm strength within higher timeframe zones, and has really been the key to our trading success. It takes a little time to understand the subtle nuances, however, as each trade is never the same, but once you master the rhythm so to speak, you will be saved from countless unnecessary losing trades. The following is a list of what we look for:
- A break/retest of supply or demand dependent on which way you’re trading.
- A trendline break/retest.
- Buying/selling tails/wicks – essentially we look for a cluster of very obvious spikes off of lower timeframe support and resistance levels within the higher timeframe zone.
- Candlestick patterns. We tend to stick with pin bars and engulfing bars as these have proven to be the most effective.
We typically search for lower-timeframe confirmation between the M15 and H1 timeframes, since most of our higher-timeframe areas begin with the H4. Stops are usually placed 1-3 pips beyond confirming structures.
EUR/USD:
Weekly gain/loss: + 24 pips
Weekly closing price: 1.1773
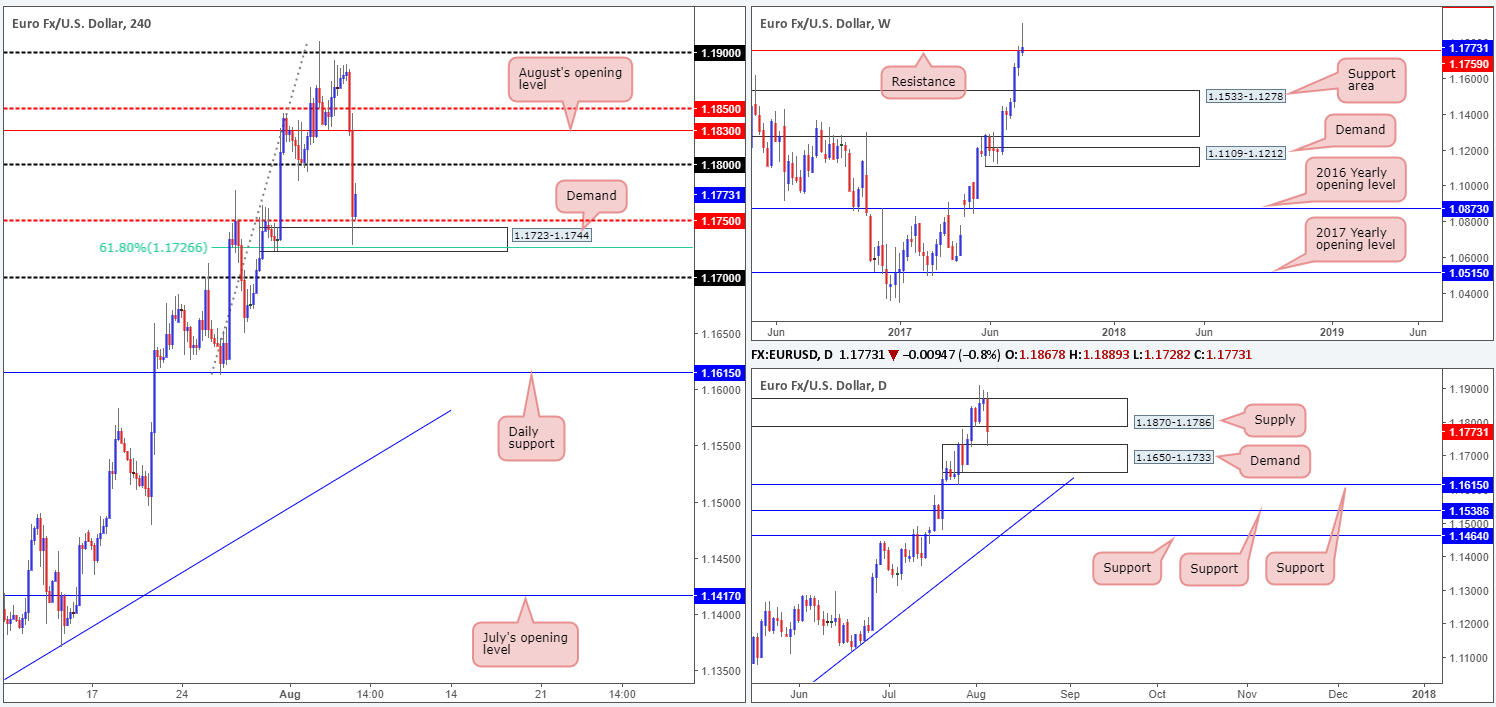
Following three consecutive weekly bullish candles, the shared currency stamped in an eye-catching weekly selling wick during the course of last week’s trading. Could this, even though price closed the week a tad beyond weekly resistance at 1.1759, be enough to encourage further selling this week? If this turns out to be the case, the next downside target can be seen at a major weekly support area carved from 1.1533-1.1278.
Zooming in and looking at the daily picture, we can see that supply drawn from 1.1870-1.1786 held firm, despite suffering multiple upside breaks. The move dragged the major down to the top edge of a daily demand base marked at 1.1650-1.1733, which, as you can see, saw the unit print a minor end-of day correction.
On Friday, The US non-farm payrolls number came in hotter than expected at 209k jobs, beating a market consensus of 182k jobs. The release triggered a violent selloff, taking out both the H4 mid-level support at 1.1850 and the 1.18 handle. It was only once price whipsawed through the H4 mid-level number at 1.1750 and challenged the H4 demand at 1.1723-1.1744 (converges with a H4 61.8% Fib support at 1.1726 taken from the low 1.1612 and also glued to the top edge of the said daily demand) did the market begin to show signs of bottoming.
Our suggestions: While the weekly selling wick may spark interest among the candlestick community, we feel selling into both the aforesaid H4 and daily demands (in such a strong trending environment) is not a trade we’d label high probability. On the other side of the coin, there’s unfortunately also little room for buys at this time, given how close daily price is trading to the underside of daily supply at 1.1786.
With the above notes in mind, neither a long nor short seems attractive at this time.
Data points to consider: FOMC member Kaskari takes the stage at 6.25pm GMT+1.

Levels to watch/live orders:
- Buys: Flat (stop loss: N/A).
- Sells: Flat (stop loss: N/A).
GBP/USD:
Weekly gain/loss: – 98 pips
Weekly closing price: 1.3033
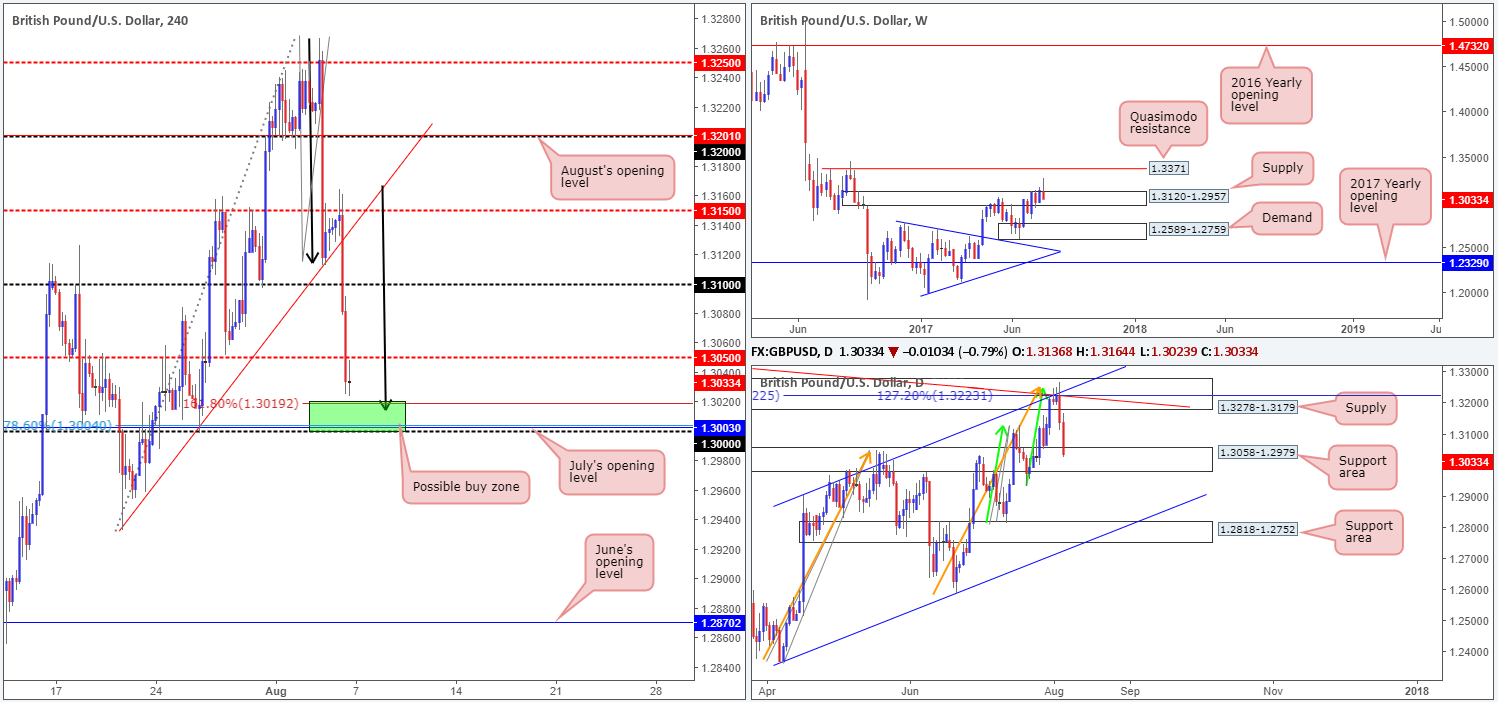
Despite weekly price violently piercing through the top edge of a weekly supply at 1.3120-1.2957, last week’s action concluded by chalking up a strong-looking selling wick that managed to firmly close back within the walls of the noted supply. Providing that the bears continue to dominate here, this would likely place the weekly demand at 1.2589-1.2759 back in view.
Daily supply at 1.3278-1.3179, as you can see, managed to hold firm and send the candles south last week. Why were we banging the drum for this zone so much over the past week? Well, not only was the supply a strong-looking base, it also boasted a daily trendline resistance taken from the high 1.3477, a daily channel resistance drawn from the high 1.2903 and two converging daily AB=CD (green/orange arrows) 127.2 Fib extensions at 1.3222/1.3223 (taken from the lows 1.2811/1.2365). Also, for you RSI fans, there was daily divergence in motion, as well.
Those who follow our reports on a regular basis may recall that our team entered into a short position from 1.3209, with conservative stops planted above the aforementioned daily supply at 1.3280. With the BoE keeping its monetary policy unchanged on Thursday as well as Friday’s US job’s report coming in stronger than expected, we witnessed two consecutive bearish days. As a result, the daily support area at 1.3058-1.2979 was tested going into the week’s end. Initially, we were only going to take partial profits around the 1.3050 neighborhood, but instead decided to liquidate the position here for a little over two times our risk, ending the week on a high.
Our suggestions: Moving forward, H4 price ended the week closing in the shape of an indecision candle just ahead of an interesting (green) buy zone. Comprised of July’s opening level at 1.3003, the large psychological boundary at 1.30, an AB=CD (black arrows) 161.8% Fib ext. at 1.3019, a 78.6% Fib retracement at 1.3004 and also being encased within the said daily support area, this H4 zone, in our humble view, has the potential to bounce price today.
Our only concern, of course, is the fact that weekly price is trading from supply (see above). For that reason, you may want to consider waiting for additional H4 candle confirmation i.e. a full, or near-full bullish rotation candle, before pulling the trigger.
Data points to consider: FOMC member Kaskari takes the stage at 6.25pm GMT+1.
Levels to watch/live orders:
- Buys: 1.30/1.3019 ([waiting for a H4 bullish candle to form [preferably a full-bodied candle] before committing to a trade is advised] stop loss: ideally beyond the candle’s tail).
- Sells: Flat (stop loss: N/A).
AUD/USD:
Weekly gain/loss: – 57 pips
Weekly closing price: 0.7929
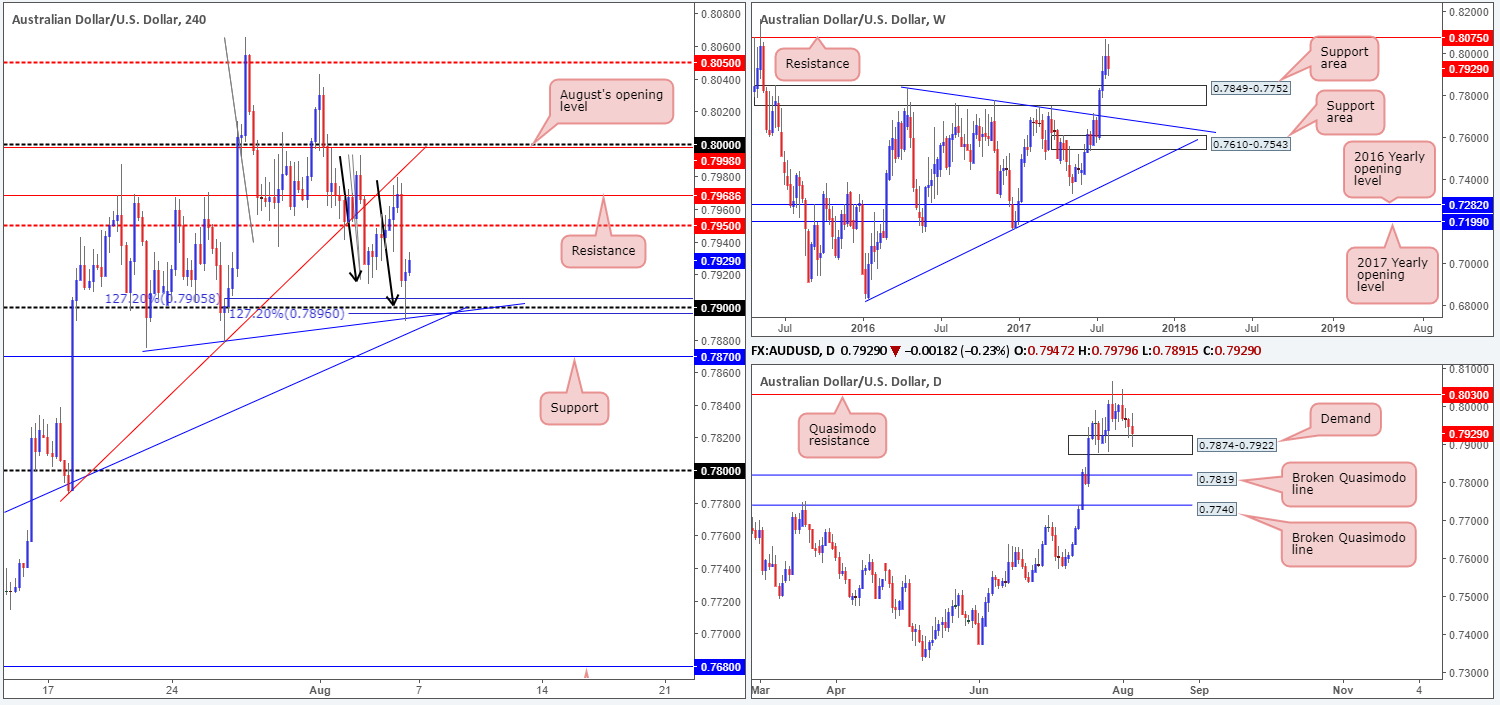
As can be seen from the weekly chart this morning the commodity currency experienced some selling pressure last week, breaking a three-week bullish phase. Consequent to this, price is now seen trading mid-range between resistance pegged at 0.8075 and a support area located at 0.7849-0.7752. Both barriers, in our view, carry equal weight due to the unshaken history each area possesses.
The story on the daily chart, however, shows that the unit is testing a demand base coming in at 0.7874-0.7922. So, by definition, we cannot rule out the possibility of an upside move being seen back up to the Quasimodo resistance level planted at 0.8030.
A quick recap of Friday’s trading on the H4 chart reveals that the Aussie dollar fell to lows of 0.7891 following a better-than-expected US job’s report. The move probed the 0.79 handle, which was also bolstered by a trendline support taken from the low 0.7874 and two AB=CD 127.2% extensions at 0.7905/0.7896 (taken from the highs 0.8065/0.7992). Technically speaking, we see no reason why the bounce from the 0.79 region will not lift the candles up to the mid-level number 0.7950, followed closely by resistance at 0.7968: the origin of Friday’s selloff.
Our suggestions: Technically speaking, a long at current price is precarious. While this may seem bizarre given that there’s a supporting daily demand present, we have to take into account that the H4 resistances mentioned above (0.7968/0.7950) are positioned within touching distance. Not only this, there’s little seen (on the weekly timeframe) stopping the pair from descending as far down as the 0.7849-0.7752 neighborhood.
As a result of the above findings, remaining on the sidelines may be the better path to take today.
Data points to consider: FOMC member Kaskari takes the stage at 6.25pm GMT+1.
Levels to watch/live orders:
- Buys: Flat (stop loss: N/A).
- Sells: Flat (stop loss: N/A).
USD/JPY:
Weekly gain/loss: – 1 pip
Weekly closing price: 110.68
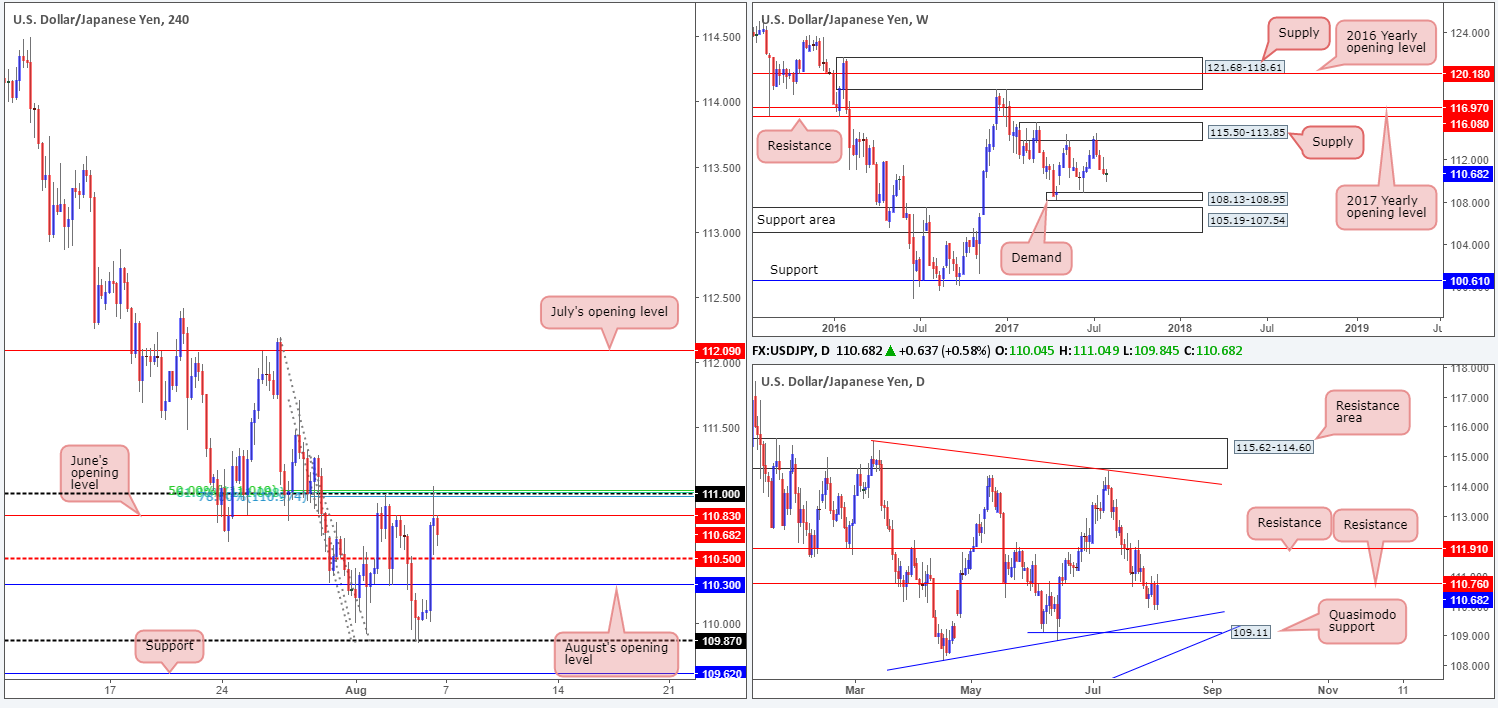
The USD/JPY is effectively unchanged this week, despite the pair’s range reaching 120 pips.
Since weekly price shook hands with supply at 115.50-113.85 five weeks ago, the market has been trading in the red. Through the lens of a technical trader, it looks as though price could continue to press lower until we reach the small demand base seen at 108.13-108.95.
Zooming in for a closer look, the daily candles are currently seen kissing resistance penciled in at 110.76. This level, as you can see, has a motivating history and therefore could hold the unit lower today and open up the pathway south down to a Quasimodo support at 109.11 (converges closely with a trendline support taken from the low 108.13).
The impact of Friday’s US job’s report which came in hotter than expected, drove prices skyward as a result. After taking out multiple H4 tech resistances, the pair ended the day stabbing the 111 handle that housed a H4 Fibonacci resistance cluster (50.0%/61.8%/78.6%) taken from the highs 112.19/111.71/111.28.
With the weekly timeframe showing the possibility of trading lower, as well as the daily chart interacting with resistance and also the H4 chart seen trading from a notable number (coupled with the pair being entrenched within a downtrend at the moment), our desk favors selling.
Our suggestions: Although selling is the more preferred strategy, H4 structure unfortunately doesn’t offer a clear runway for the bears to stretch their legs. Seen nearby is the mid-level support at 110.50, shadowed closely by August’s opening level at 110.30 and then the 110 handle which has held price higher on two occasions in recent trading.
On account of this, we will not be taking part in any selling for the time being.
Data points to consider: FOMC member Kaskari takes the stage at 6.25pm GMT+1.
Levels to watch/live orders:
- Buys: Flat (stop loss: N/A).
- Sells: Flat (stop loss: N/A).
USD/CAD:
Weekly gain/loss: + 214 pips
Weekly closing price: 1.2649
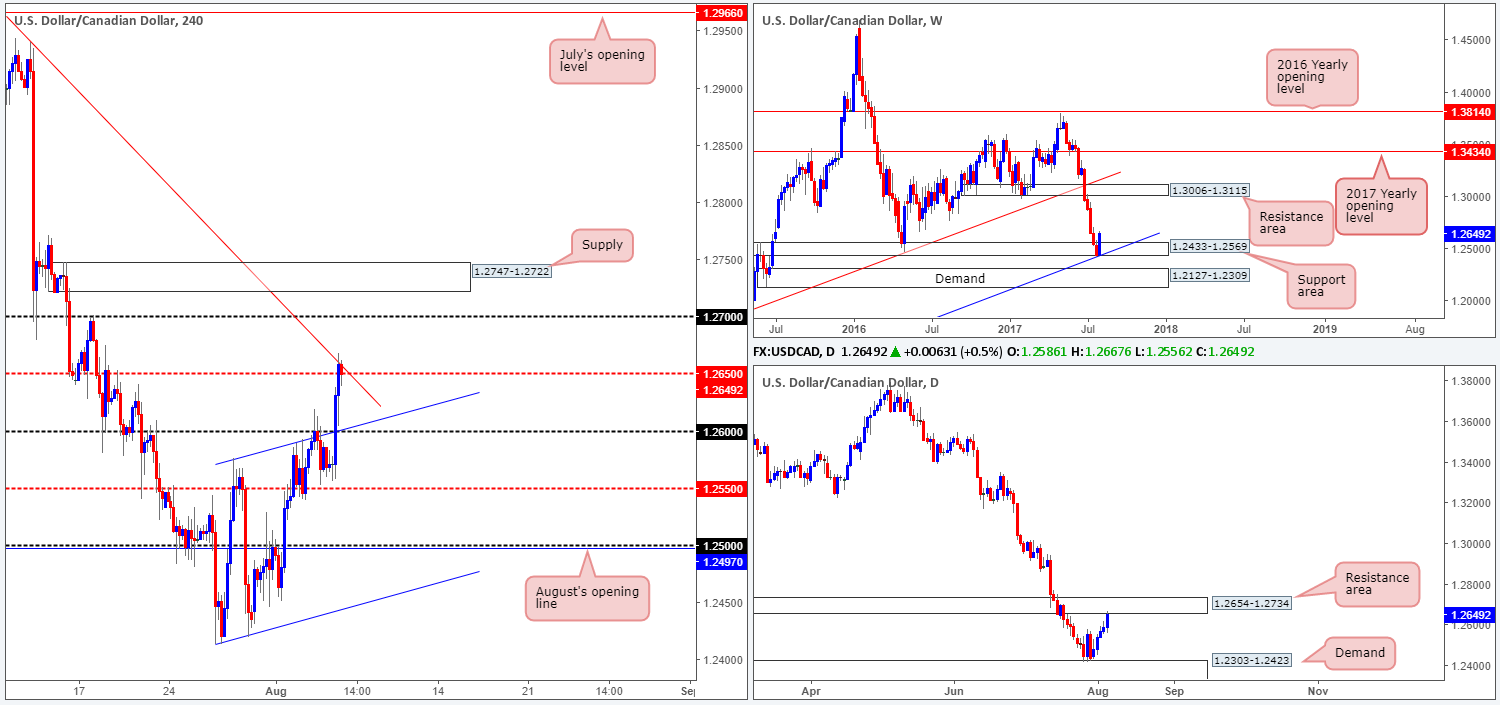
Following a precipitous downward move stretched out over the past couple of months, weekly price staged a stronger-than-expected bounce last week from a support area seen at 1.2433-1.2569. Should this move (which managed to engulf two prior weekly bearish candles) continue to gather momentum, the next upside target is not visible on the radar until we reach the resistance zone at 1.3006-1.3115.
Turning over a page to the daily timeframe, we can see that the unit recently came into contact with a resistance area at 1.2654-1.2734. If one were looking only at this scale, you may conclude that this is simply a correction into structure within the current downtrend. While this could very well be the case, it’s still a daring sell zone given the recent move from the aforesaid weekly support area.
The aftermath of Friday’s US and Canadian employment report sent H4 price northbound. The 1.26 handle was quickly engulfed, allowing the piece to connect with a converging trendline resistance extended from the high 1.2993 and a mid-level resistance number at 1.2650. With this area also seen fusing with the underside of the aforementioned daily resistance area, the loonie could revisit the 1.26 neighborhood today, which happens to unite closely with a H4 trendline support etched from the high 1.2576.
Our suggestions: To become buyers in this market, we would like to see a clear break above the current daily resistance area. Selling from the 1.2650 region, nonetheless, is interesting considering the confluence the number holds, but it is, as we mentioned above, somewhat clouded by recent weekly action (see above). This is a tad disappointing since a short from 1.2650 is very attractive. For us though, the risk of selling into potential weekly flow is just too great.
Data points to consider: FOMC member Kaskari takes the stage at 6.25pm GMT+1.
Levels to watch/live orders:
- Buys: Flat (stop loss: N/A).
- Sells: Flat (stop loss: N/A).
USD/CHF:
Weekly gain/loss: + 42 pips
Weekly closing price: 0.9727
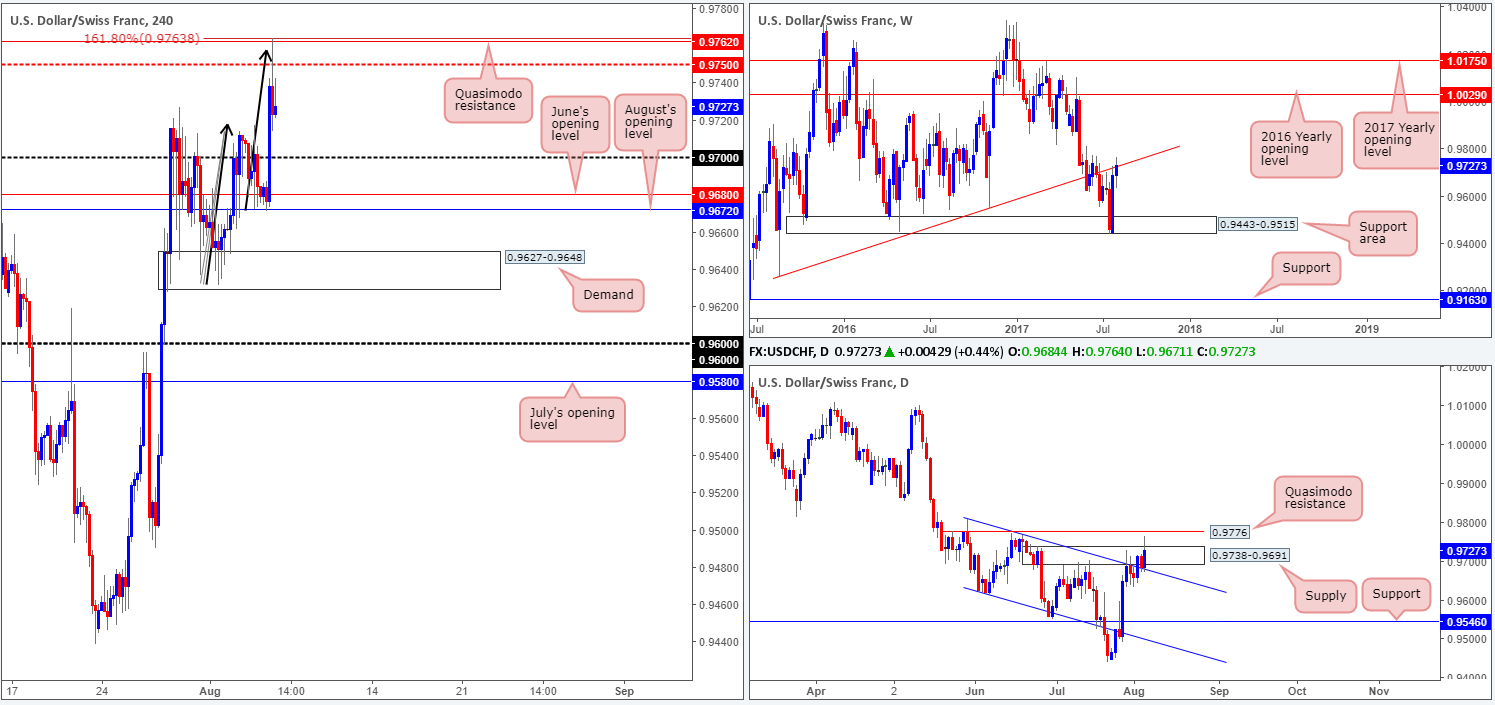
Over the past week, the USD/CHF edged higher, extending the prior week’s bounce from the weekly support area at 0.9443-0.9515. As of current price, the major weekly trendline resistance extended from the low 0.9257 remains in play.
Daily supply at 0.9738-0.9691, as you can see, suffered an upside break on Friday after price retested a recently broken daily channel resistance taken from the high 0.9808. The stop-loss orders sited above the supply have more than likely been filled, thus potentially opening up the path north to a nearby daily Quasimodo resistance at 0.9776.
The after-effects of Friday’s upbeat US job’s report brought the pair to highs of 0.9763. Traders may have also noticed that the move connected with a H4 Quasimodo resistance level at 0.9762 and also a H4 AB=CD (black arrows) 161.8% Fib ext. at 0.9763.
Our suggestions: The weekly trendline resistance, coupled with the noted H4 resistances in play, may force the US dollar to retest the 0.97 handle, and quite possibly June/August’s opening levels at 0.9680/0.9672 today.
Of course, Friday’s move above daily supply is concerning for a sell trade, but given the location of weekly and H4 price at the moment, we would be comfortable shorting this market if the unit retests the 0.9763/0.9750 region. Still, to be on the safe side, waiting for a H4 bearish candle to form, preferably in the shape of a full, or near-full-candle, is advised before pulling the trigger, since the daily Quasimodo resistance is positioned only 14 pips above the H4 sell zone.
Data points to consider: FOMC member Kaskari takes the stage at 6.25pm. Swiss CPI figures at 8.15am GMT+1.
Levels to watch/live orders:
- Buys: Flat (stop loss: N/A).
- Sells: 0.9763/0.9750 ([waiting for a H4 bearish candle to form, preferably either a full, or near-full-bodied candle, is advised] stop loss: ideally beyond the candle’s wick).
DOW 30:
Weekly gain/loss: + 249 points
Weekly closing price: 22071
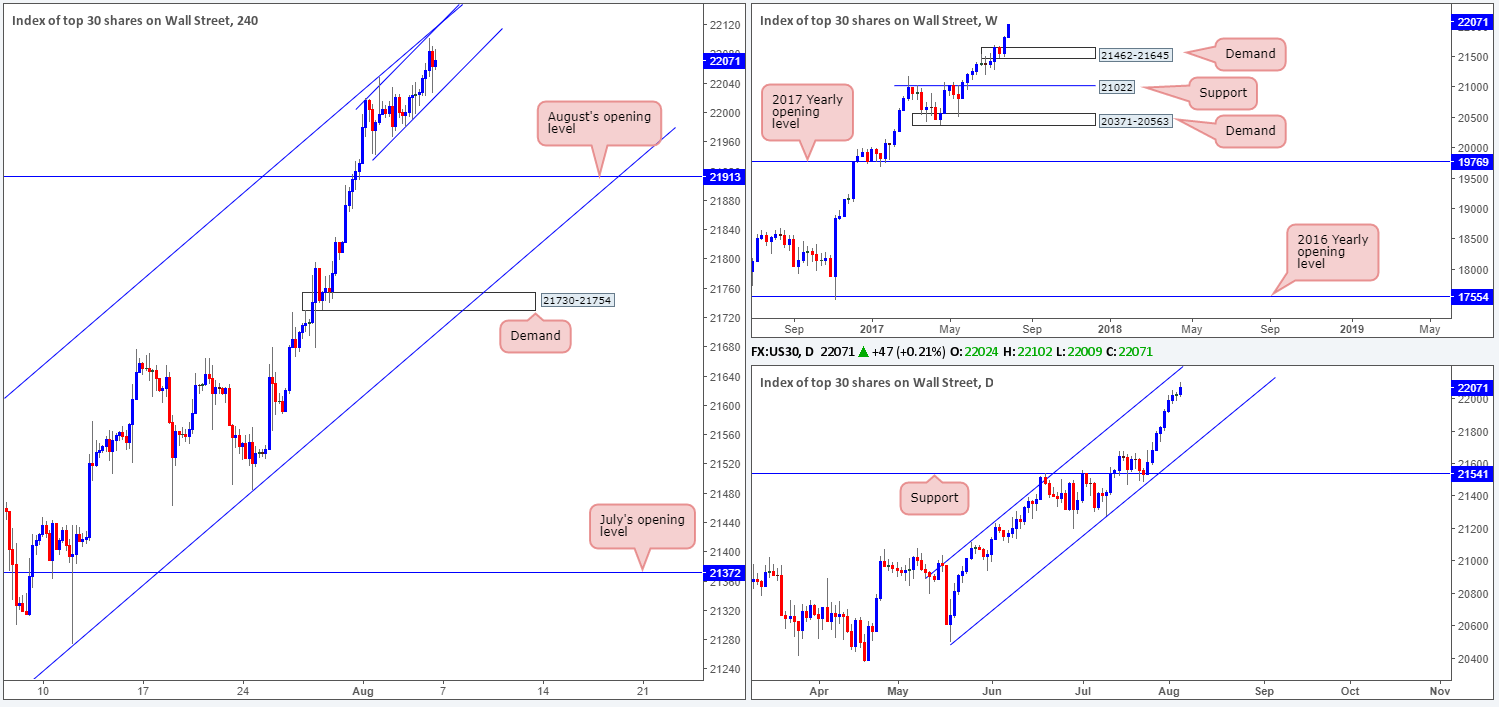
US equities put in another dominant performance last week, printing a solid weekly bullish candle that managed to close beyond the 22000 landmark. From the weekly timeframe, it is clear to see that this market’s underlying trend remains strong. However, should the index pullback, the demand base positioned at 21462-21645 is likely the area where we’ll see the bulls recover from.
Daily action on the other hand, is currently embedded within a rather large ascending channel formation (20494/21112). Assuming that the index continues to gravitate higher, we’ll likely see price lock horns with the channel resistance in the near future.
Bouncing over to the H4 timeframe, price is seen clinging to two ascending channel resistances at the moment. The first, the bigger of the two, can be extended from low/high 21273/21556. The second, the smaller version, can be drawn from low/high 21942/22019.
Although this market is entrenched within an incredibly strong uptrend at present, we feel, given the convergence of the two H4 channel resistance, we may see the H4 candles pull back to test neighboring channel supports today/this week.
Our suggestions: Though there’s a chance that the unit could turn bearish this week, we would not have the confidence to sell into current market strength! Now, if we had the daily channel resistance line also in motion, then that’d be a different matter, and we’d likely consider, with additional candle confirmation, a short. But as things stand, the odds of a break north is still higher, in our humble opinion.
Data points to consider: FOMC member Kaskari takes the stage at 6.25pm GMT+1.
Levels to watch/live orders:
- Buys: Flat (stop loss: N/A).
- Sells: Flat (stop loss: N/A).
GOLD:
Weekly gain/loss: – $10.3
Weekly closing price: 1258.4
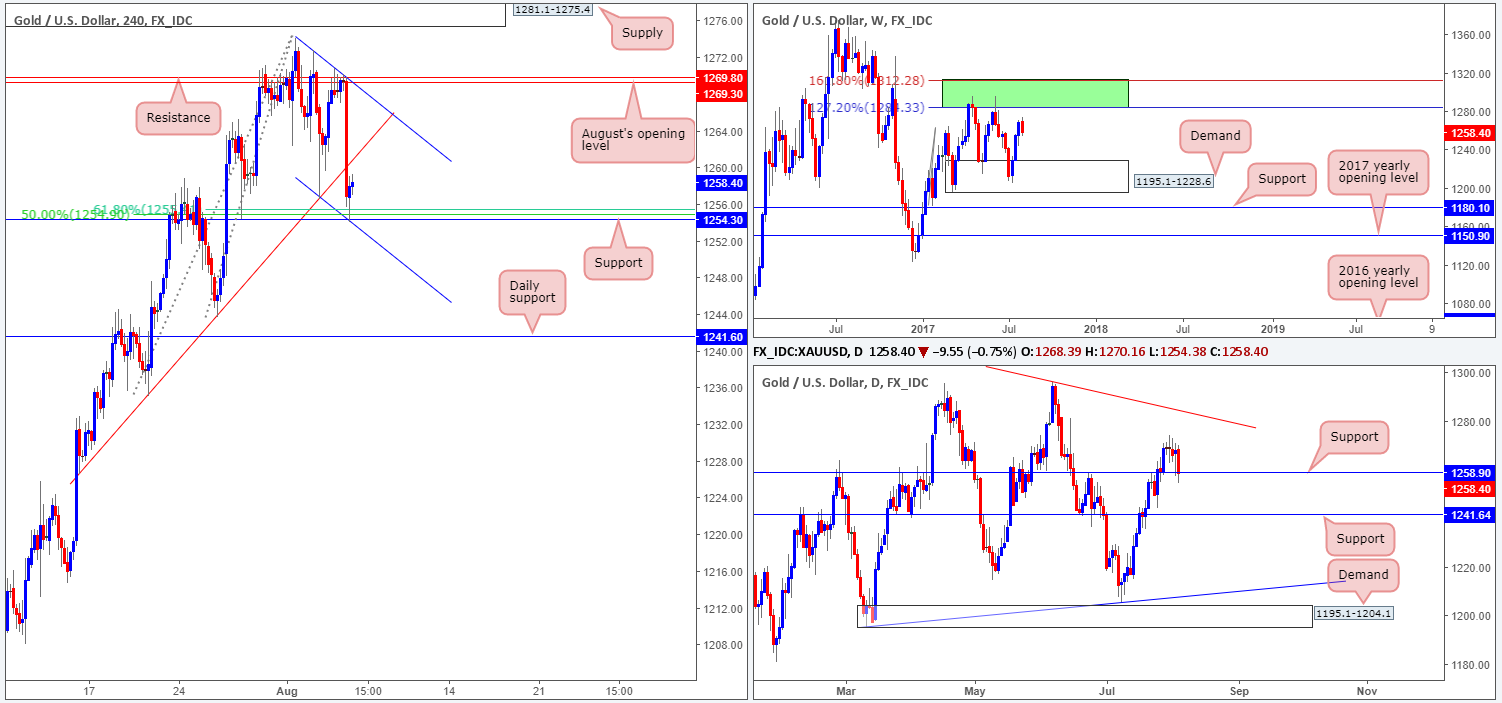
After three solid weeks of buying the sellers finally made an appearance last week, erasing the majority of the prior week’s gains. From a technical standpoint, we still feel there is room for the metal to extend higher since price has yet to unite with the green weekly resistance zone comprised of two Fibonacci extensions 161.8/127.2% at 1312.2/1284.3 taken from the low 1188.1.
Turning our attention to the daily timeframe, support at 1258.9 is currently being challenged. If the unit respects this boundary, the next upside hurdle in the firing range is a daily trendline resistance extended from the high 1337.3. What’s also notable here is the daily trendline intersects beautifully with the weekly resistance area mentioned above.
A closer look at price action on the H4 timeframe shows price bouncing off of a channel support line taken from the low 1256.5, following Friday’s NFP-induced selloff. Also of particular interest here is the 61.8% Fib support at 1255.3 drawn from the low 1243.6, alongside a 50.0% support value at 1254.9 extended from the low 1235.1 and the H4 support at 1254.3.
Although there is a nearby H4 trendline resistance (marked from the low 1235.1) seen lurking nearby, it is likely, considering the H4 confluence and daily support in play, that the yellow metal will advance today and touch gloves with the neighboring H4 channel resistance.
Our suggestions: With both the weekly and daily timeframes showing room for the bulls to stretch their legs, we are looking to buy from current price. However, before pulling the trigger, it’d be nice to see a H4 bullish candle take shape in the form of a full-bodied candle.
Levels to watch/live orders:
- Buys: 1254.3 region ([waiting for a H4 bullish candle to form, preferably either a full, or near-full-bodied candle, is advised] stop loss: ideally beyond the candle’s tail).
- Sells: Flat (stop loss: N/A).


