
DXY:
The DXY (US Dollar Index) is currently demonstrating a bearish momentum on the chart, which is driven by its position below a major descending trend line, indicating a potential continuation of the bearish movement.
Considering the prevailing bearish momentum, the price has the potential to further decline, potentially reaching the first support level at 99.77. This support level gains significance as it corresponds to a multi-swing low, making it an essential level to watch.
An intermediate support is also in place at 101.16, supported by its role as a pullback support, which could potentially provide some temporary relief during the downward movement.
On the other side, the market faces resistance levels that may hinder any significant upward movement. The first resistance level stands at 102.53 and holds importance due to its identification as a swing high resistance point.
Furthermore, a 2nd resistance level is observed at 103.64, which gains strength from its status as an overlap resistance level.

EUR/USD:
The EUR/USD currency pair is currently experiencing a bullish momentum, as indicated by its position above a rising trendline, suggesting the potential for upward movement in the price.
In the short term, there might be a pullback, and the first support level to watch is at 1.0950. This support level is significant due to its “Fibonacci confluence,” which means that multiple Fibonacci levels converge at this point, reinforcing its strength as a potential support level.
Upon recovery from the pullback, the price may target the intermediate resistance at 1.1063. This resistance level is characterized by “overlap protection,” indicating the presence of historical price levels or technical indicators clustering at this point, making it an important barrier to further price advances.
The first resistance level at 1.1231 is another key level to watch, known for its “high multi-swing resistance.” This level has acted as a strong barrier to price movement during various bullish swings in the past, making it a significant reference point for potential profit-taking or consolidation signals.

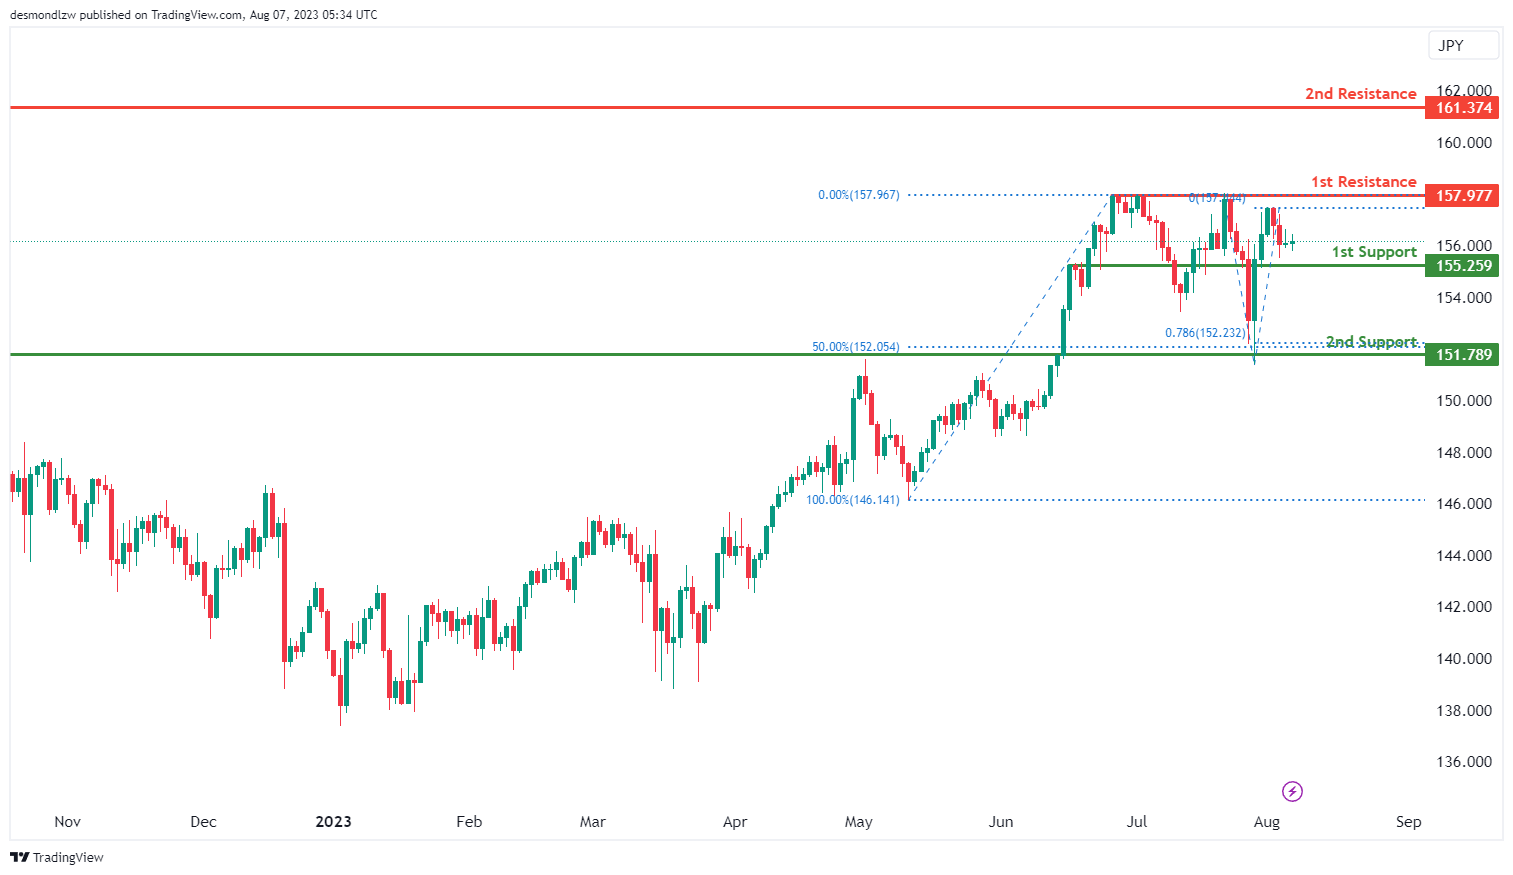
EUR/JPY:
The EUR/JPY chart is currently showing a bullish momentum, and this is attributed to the fact that the price is positioned above the bullish Ichimoku cloud, which indicates positive sentiment.
There is a potential for a bullish continuation towards the first resistance level. The first support at 155.25 is considered strong due to its overlap support. Additionally, the 2nd support at 151.78 is reinforced by being a pullback support and coinciding with the 50% Fibonacci Retracement level, making it an important level of interest.
On the resistance side, the first level at 157.97 is significant as it represents a multi-swing high resistance, indicating potential selling pressure at that level. The 2nd resistance at 161.37 is also noteworthy, being an overlap resistance, suggesting potential obstacles to further price movement beyond this point.
EUR/GBP:
The EUR/GBP instrument is currently showing a bearish overall momentum on the chart. The price could potentially make a bearish reaction off the first resistance level at 0.8661 and drop to the first support level at 0.8522.
The first support level at 0.8522 is notable due to its role as a multi-swing low support. The 2nd support, located at 0.8393, is identified as an overlap support.
On the resistance side, the first resistance level at 0.8661 is significant because of its role as a pullback resistance. The 2nd resistance, situated at 0.8742, is marked by a pullback resistance and aligns with a 50% Fibonacci Retracement.

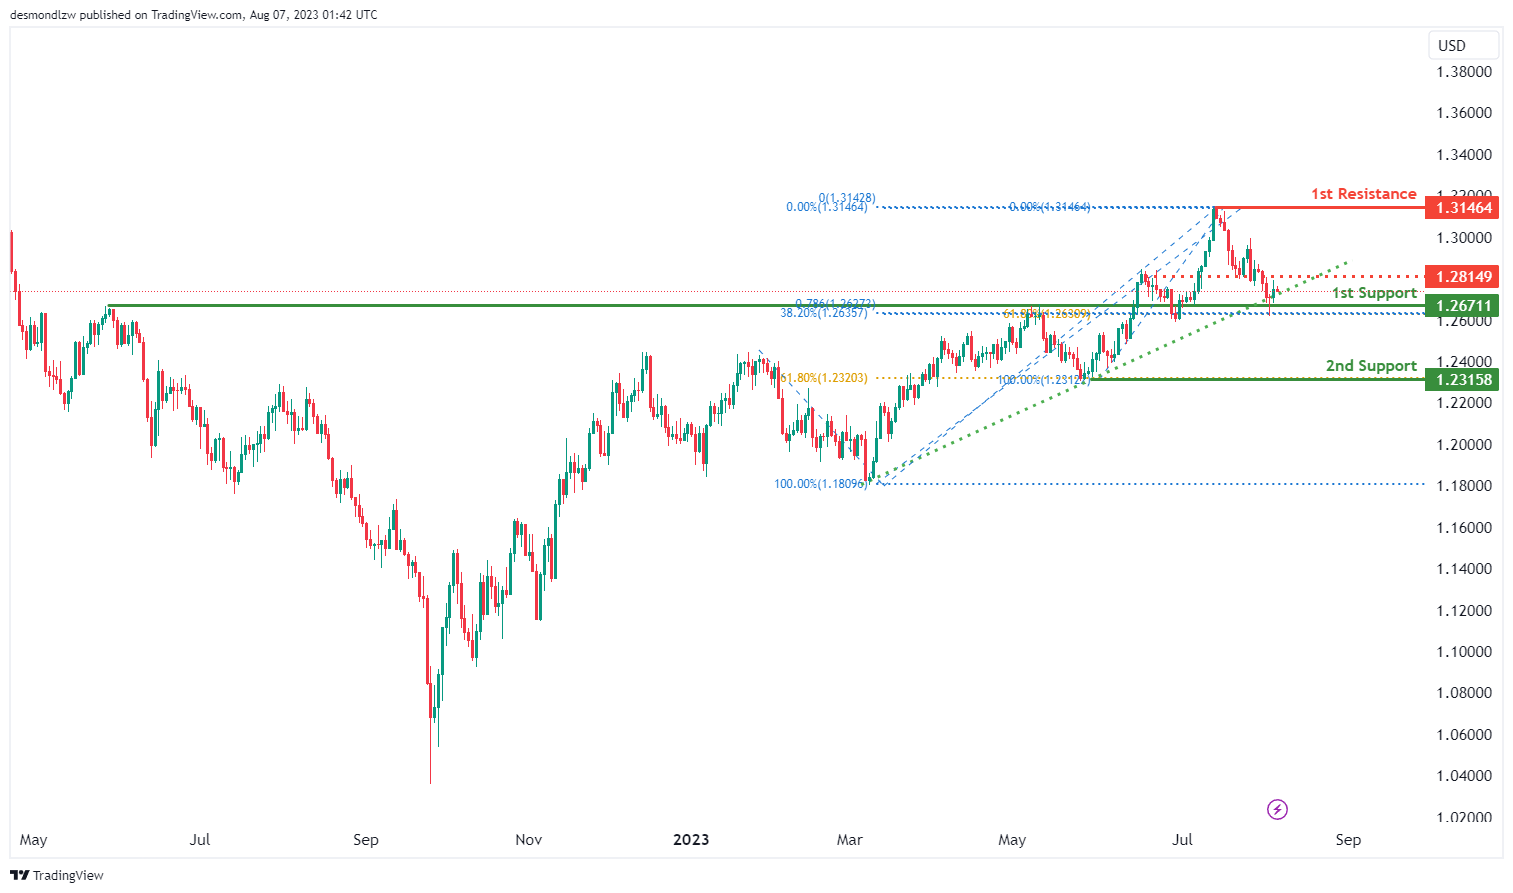
GBP/USD:
The GBP/USD chart currently displays a bullish momentum, which is supported by a rising trend line, indicating a positive trend in the price movement.
On the support side, there are two crucial levels to watch. The first support level is at 1.2671, and it holds significance as it aligns with both the “38.20% Fibonacci retracement” and the “61.80% Fibonacci projection.” This convergence of Fibonacci levels reinforces the strength of this support level
The 2nd support level is at 1.2315 and is characterized by both “low swing support” and a “61.80% Fibonacci retracement.” This level has previously provided support during bullish swings, making it a key area to watch for potential price reactions.
On the resistance side, two significant levels stand out. The first resistance level is at 1.3146 and is identified as a “multi-swing high.” This level has acted as a strong barrier to price movement during various bullish swings in the past, adding to its importance as a resistance level.
Additionally, an intermediate resistance is observed at 1.2814, characterized by “overlap resistance.” This level is significant because it indicates the presence of historical price levels or technical indicators clustering at this point, potentially acting as another barrier to further price advances.
GBP/JPY:
The GBP/JPY chart is showing a bullish overall momentum, suggesting a positive sentiment in the market.
There is a potential for a bullish continuation towards the first resistance level. The first support at 179.90 is considered strong as it represents an overlap support and aligns with the 50% Fibonacci Retracement level, making it a significant level for potential buyers.
Additionally, the 2nd support at 178.20 is reinforced by being a swing low support, and it also coincides with the confluence of the 78.60% and 23.60% Fibonacci Retracement levels, further enhancing its importance as a support level.
On the resistance side, the first level at 182.37 is significant due to its overlap resistance, indicating potential selling pressure at that level. The 2nd resistance at 183.77 is also noteworthy as it represents a multi-swing high resistance and is further strengthened by being at the 50% Fibonacci Retracement level, suggesting a potential obstacle to further price movement beyond this point.

USD/CHF:
The USD/CHF’s overall momentum is bearish, with the price below a significant declining trend line, indicating an imminent bearish momentum.
Price is expected to potentially make the following moves: a bearish reaction off the first resistance and drop to the first support level.
This support level at 0.8558 is considered significant due to “Low multi-swing support.” It has previously acted as a reliable support during various bearish swings, making it an essential level to watch for potential price reactions.
The first resistance level at 0.8769 is noteworthy for two reasons. Firstly, it has a “Fibonacci projection” with a “61.80% overlap resistance.” The presence of historical price convergence and technical significance at this level suggests it may act as a strong barrier to further price advances.
The 2nd resistance level at 0.8902 is significant due to its “Fibonacci retracement resistance of 100% projection.” This level’s technical significance implies that it may serve as a formidable barrier to price movement during bullish swings.

USD/JPY:
The USD/JPY’s overall momentum is bullish, indicating a positive trend in the price movement.
Price is expected to potentially make a bullish continuation towards the first resistance level.
This support level at 137.98 is considered significant due to “Overlap assistance.” Historical price convergence and technical indicators align at this point, reinforcing its strength as a reliable support level..
The 2nd support level at 134.57 holds importance as “Pullback assistance.” This level has shown its ability to provide support during price pullbacks in the past..
The first resistance level at 145.00 is noteworthy due to its status as a “High resistance swing.” This level has acted as a strong barrier to price movement during previous bullish swings.The 2nd resistance level at 143.44 is significant as a “High multi-swing resistance.” In the past, this level has proved to be a formidable barrier during various bullish swings

USD/CAD:
The USD/CAD pair is currently displaying a bearish momentum, indicating a possible bearish reaction off the first resistance and then dropping to the first support level.
The first support level is at 1.3117, identified as an overlap support where price has previously found both support in the past. The 2nd support level at 1.2987 which represents a pullback support that is reinforced by the 50% Fibonacci retracement level.
On the upside, the first resistance level is at 1.3377 which is identified as an overlap resistance, making it a potential obstacle for an upward price movement. Should the price break above this level, the 2nd resistance at 1.3470 may come into play. This is a resistance level that aligns with the 127.20% Fibonacci extension level which could potentially act as a barrier for further upside movement.

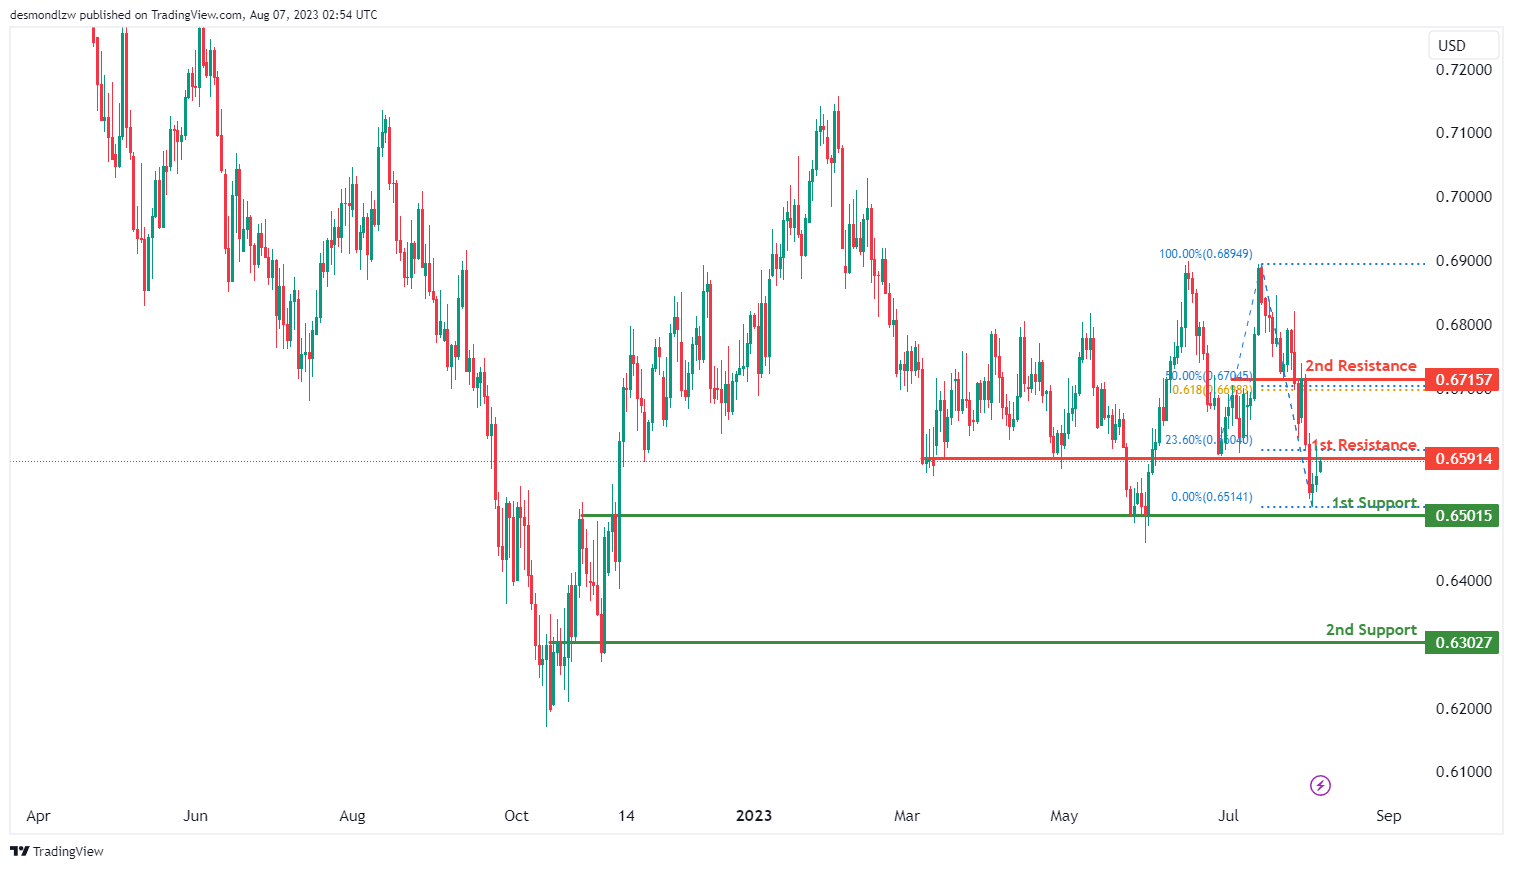
AUD/USD:
The AUD/USD pair is currently demonstrating a weak bullish trend with low confidence. The expectation is for a bullish break through off the first resistance level leading towards the 2nd resistance level.
The first resistance level at 0.6591 is an overlap resistance that aligns with the 23.60% Fibonacci retracement level. Should the price break above this level, the 2nd resistance at 0.6716 may come into focus. This level is recognized as an overlap resistance that aligns with a confluence of Fibonacci levels i.e. the 50.00% retracement and 61.80% projection levels.
To the downside, the first support level at 0.6502 is recognized as an overlap support. If the price breaches this level, the 2nd support level is at 0.6303. This level has also been identified as an overlap support.
NZD/USD
The NZD/USD pair is currently demonstrating a weak bullish trend with low confidence. Price has bounced off the intermediate support level and the expectation is for a bullish break above the ascending trendline.
The intermediate support level at 0.6063 is an overlap support level. Should price breach this level, the
first support level is at 0.5985. This level is identified as a swing-low support that aligns close to the 127.20% Fibonacci extension level, suggesting a significant support barrier.
On the other hand, if the bullish trend continues, the intermediate resistance level is at 0.6243. This level is identified as a pullback resistance and is further reinforced by the 50% Fibonacci retracement level. Should the price surpass this level, the first resistance is at 0.6390. This level is recognized as an overlap resistance, suggesting that it could be a tough level for the bullish momentum to overcome.

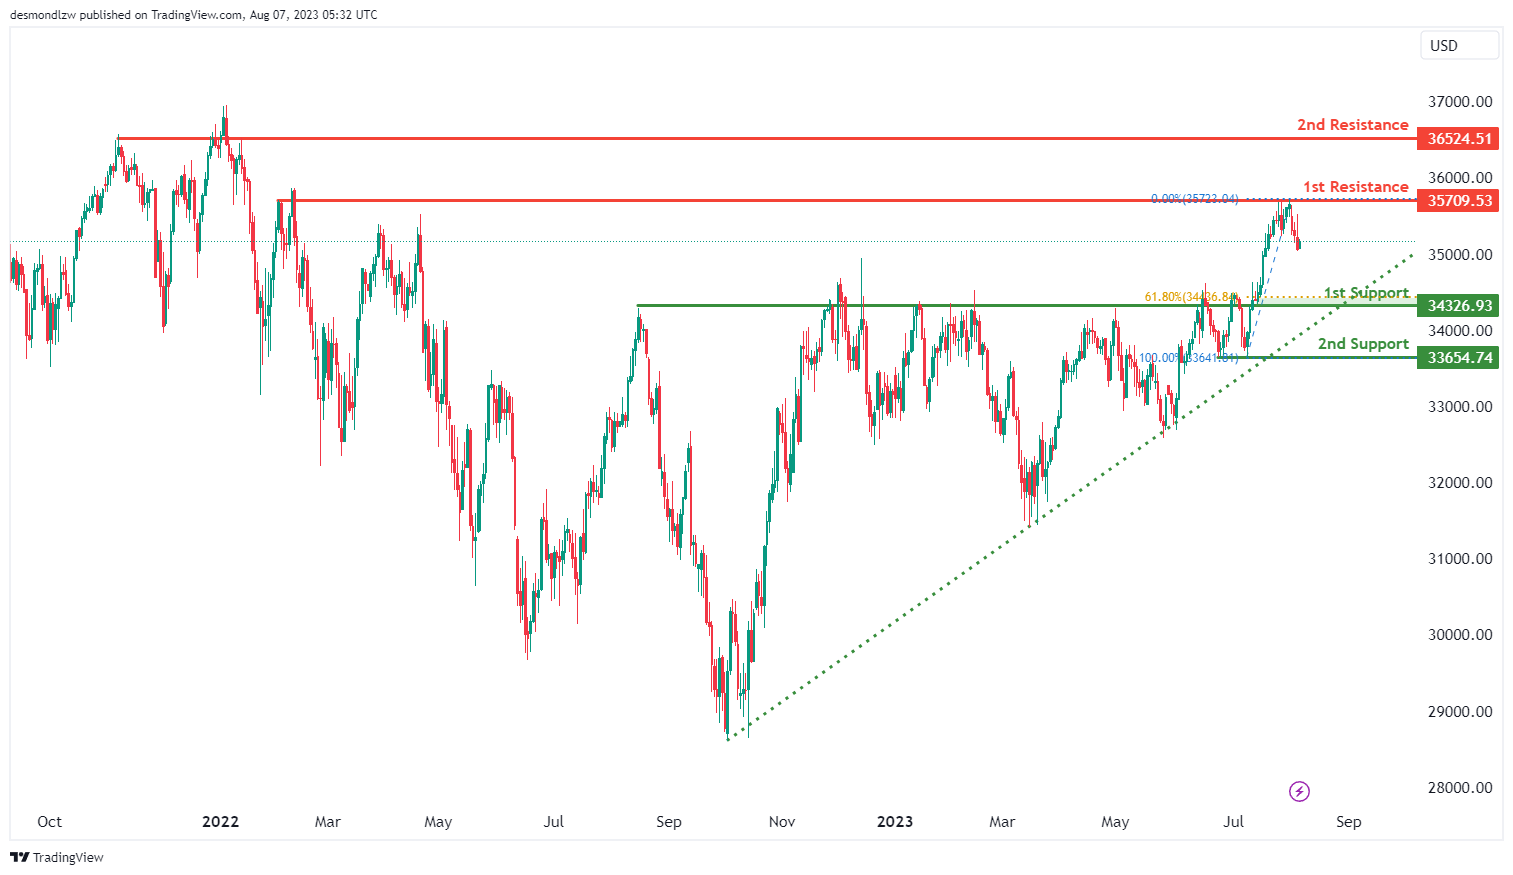
DJ30:
The DJ30 instrument is currently showing a bullish overall momentum on the chart. One of the factors contributing to this momentum is that the price is above the bullish Ichimoku cloud. In the short term, the price could potentially drop further to the first support level at 34326.93 before bouncing from there and rising to the first resistance level at 35709.53.
The first support level at 34326.93 is significant as it acts as a pullback support and corresponds with a 61.80% Fibonacci Retracement. The 2nd support, located at 33654.74, is identified by a multi-swing low support.
On the resistance side, the first resistance level at 35709.53 is notable due to its status as a multi-swing high resistance. The 2nd resistance, situated at 36524.51, is marked by an overlap resistance.
GER30:
The GER30 instrument is currently showing a bullish overall momentum on the chart. The price could potentially make a bullish bounce off the first support level at 15707.42 and head towards the first resistance level at 16443.94.
The first support level at 15707.42 is notable for its role as an overlap support and coincides with a 78.60% Fibonacci Retracement. The 2nd support, located at 15277.18, is also identified as an overlap support and is at a 23.60% Fibonacci Retracement.
On the resistance side, the first resistance level at 16443.94 is marked by a multi-swing high resistance. Additionally, an intermediate support level at 15432.92 is worth noting for its role as a swing low support.

US500
The US500 instrument is currently showing a bullish overall momentum on the chart. A contributing factor to this momentum is that the price is above a major ascending trend line, which suggests further bullish momentum may be on the horizon. The price could potentially continue in a bullish direction towards the first resistance level at 4603.2.
The first support level at 4326.7 is notable due to its role as a pullback support and its alignment with a 38.20% Fibonacci Retracement. The 2nd support, located at 4164.0, is identified as another pullback support.
On the resistance side, the first resistance level at 4603.2 is significant for its role as a swing high resistance. The 2nd resistance, situated at 4749.9, is marked by a multi-swing high resistance.
Additionally, an intermediate support level at 4452.4 is worth noting due to its function as a pullback support.

BTC/USD:
The BTC/USD instrument is currently demonstrating a neutral overall momentum on the chart. The price is predicted to fluctuate between the first resistance level at 29853 and the first support level at 28474.
The first support level at 28474 is notable because it serves as a pullback support and also aligns with a 50% Fibonacci Retracement. The 2nd support, located at 27276, is marked by an overlap support and a 61.80% Fibonacci Retracement.
On the other hand, the first resistance level at 29853 is identified by an overlap resistance and a 38.20% Fibonacci Retracement. The 2nd resistance, at 31386, is significant due to its role as a multi-swing high resistance.

ETH/USD:
The ETH/USD instrument is currently displaying a bullish overall momentum on the chart. The price could potentially make a bullish bounce off the first support level at 1829.07 and head towards the first resistance level at 2028.15.
The first support level at 1829.07 is noteworthy because it represents a multi-swing low support and coincides with a 50% Fibonacci Retracement. The 2nd support, situated at 1712.99, is characterized by an overlap support and a 78.60% Fibonacci Retracement.
Meanwhile, the first resistance level at 2028.15 is identified by an overlap resistance and a 78.60% Fibonacci Retracement. The 2nd resistance, located at 2143.59, is significant due to its status as a swing high resistance.

WTI/USD:
The WTI Crude Oil (West Texas Intermediate) is currently demonstrating a bearish momentum. It is anticipated that price could potentially react off the first resistance level and drop towards the first support.
The first support level is situated at 73.60 which represents an overlap support level. Should the price fall below this first support level, the 2nd support is at 67.22. This level serves as an overlap support and could potentially serve as a significant support barrier.
To the upside, the first resistance level lies at 82.87 which is identified as an overlap resistance. Beyond this point, the 2nd resistance level is at 92.32. This level is an overlap resistance that was tested a couple of times in the past. If the price reaches this level, it could face significant resistance.

XAU/USD (GOLD):
The XAU/USD (Gold/US Dollar) instrument is currently experiencing a bearish overall momentum, represented by a descending bearish channel, which indicates a downtrend in the price movement.
In the immediate term, there is a prediction of a short-term rise before a potential reversal to the first support level at 1935.01. This support level is significant due to its historical importance as a “swing low support.” It has acted as a reliable level where the price found support during previous bearish trends
Additionally, the chart presents a 2nd support level at 1891.41, which also holds historical significance as a “swing low support.” This level reinforces its importance as a potential area where the price may find support and possibly reverse its downward movement.
On the resistance side, two key levels stand out. The first resistance level is at 1979.68 and is characterized by “Overlap resistance” and a “50% Fibonacci retracement.” This level is critical because historical price levels and technical indicators cluster at this point, making it a significant barrier to further price advances. Moreover, the 50% Fibonacci retracement level adds to the importance of this resistance level, often indicating potential trend reversals.
The 2nd resistance level at 2048.81 is identified as a “multi-swing high resistance.” This level has played a notable role in obstructing price movement during various bullish swings.

The accuracy, completeness and timeliness of the information contained on this site cannot be guaranteed. IC Markets does not warranty, guarantee or make any representations, or assume any liability regarding financial results based on the use of the information in the site.
News, views, opinions, recommendations and other information obtained from sources outside of www.icmarkets.com, used in this site are believed to be reliable, but we cannot guarantee their accuracy or completeness. All such information is subject to change at any time without notice. IC Markets assumes no responsibility for the content of any linked site.
The fact that such links may exist does not indicate approval or endorsement of any material contained on any linked site. IC Markets is not liable for any harm caused by the transmission, through accessing the services or information on this site, of a computer virus, or other computer code or programming device that might be used to access, delete, damage, disable, disrupt or otherwise impede in any manner, the operation of the site or of any user’s software, hardware, data or property.


