
EUR/USD:
Weekly gain/loss: +0.55%
Weekly close: 1.1200
Weekly perspective:
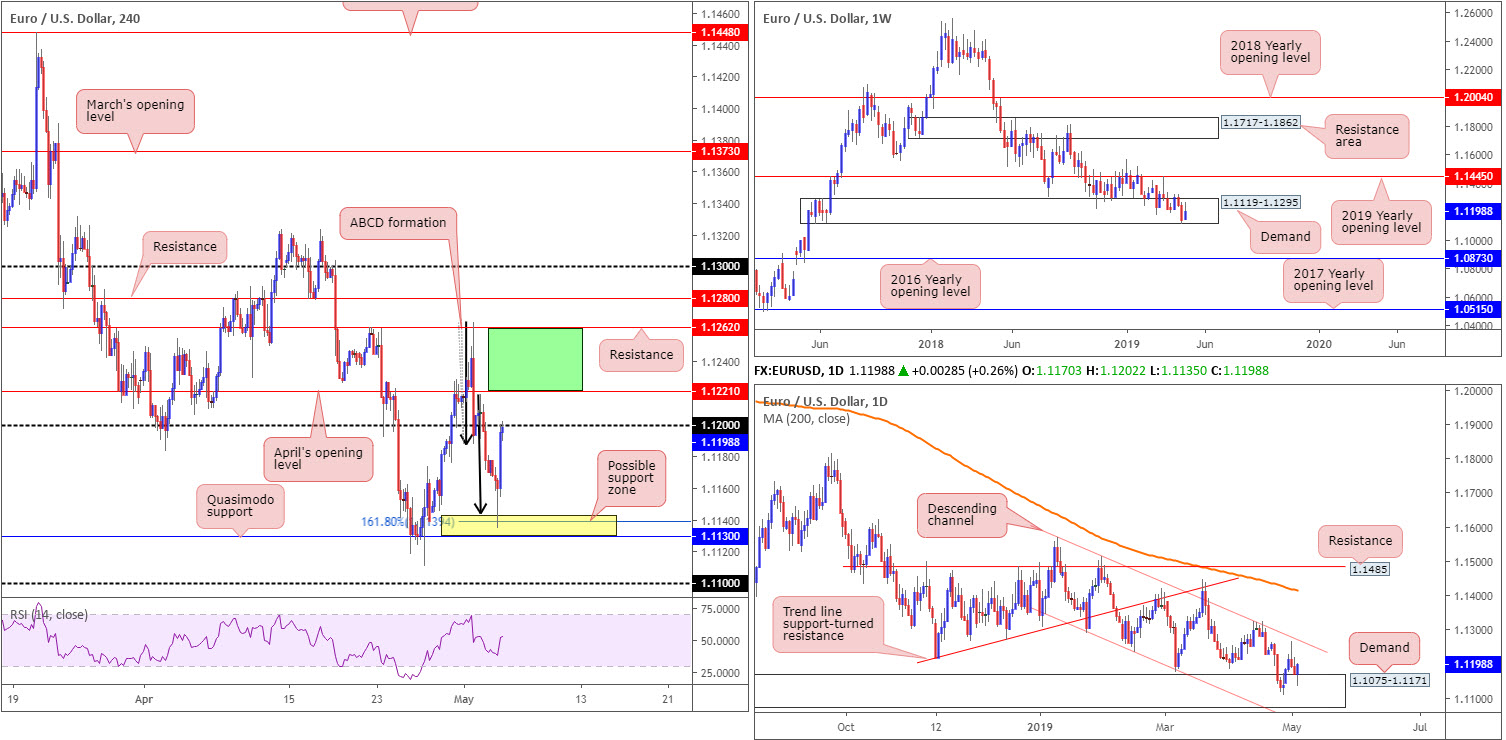
Violating a two-week bearish phase within the parapets of a long-standing demand zone at 1.1119-1.1295, the EUR/USD recovered in reasonably strong fashion last week. Continued buying may call for a test of notable resistance plotted at 1.1445, the 2019 yearly opening level, whereas a break lower has the 2016 yearly opening level at 1.0873 in sight.
Daily perspective:
Daily activity continues to dip its toes into demand priced at 1.1075-1.1171 (glued to the underside of the current weekly demand area). Note price action concluded the week rebounding strongly from the top edge of the zone on this timeframe, potentially setting the stage for an approach to nearby channel resistance taken from the high 1.1569.
H4 perspective:
Total non-farm payroll employment increased by 263,000 in April; the unemployment rate declined by 0.2% to 3.6% in April, the lowest rate since December 1969 and Average hourly earnings for April ticked lower to 0.2% vs. expected 0.3%, the US Bureau of Labor Statistics reported Friday.
The after-effects of the job’s report weighed on the greenback, consequently propping up the euro. Interestingly, the EUR/USD’s H4 candles tested a strong base of support between 1.1130/1.1143 (comprised of a Quasimodo support at 1.1130, a 161.8% AB=CD pattern at 1.1394 and the symmetrical AB=CD [black arrows] completion point at 1.1143) before turning higher. Well done to any of our readers who managed to jump aboard the move as this was a noted area to watch in Friday’s morning brief.
Areas of consideration:
Going forward, H4 price is testing 1.12, shadowed closely by April’s opening level at 1.1221. Both levels may provide resistance and potentially hamper profits harvested from the recent upsurge. However, as both weekly and daily charts suggest further upside could still be in store, a move above the said H4 resistances are a possibility towards at least H4 resistance priced in at 1.1262, which happens to align closely with the descending channel resistance highlighted above on the daily timeframe.
Short-term traders may, therefore, be interested in the space between 1.1221/1.1262 (green) on the H4 timeframe for potential long opportunities this week.
Today’s data points: FOMC Member Williams Speaks.
GBP/USD:
Weekly gain/loss: +2.03%
Weekly close: 1.3171
Weekly perspective:
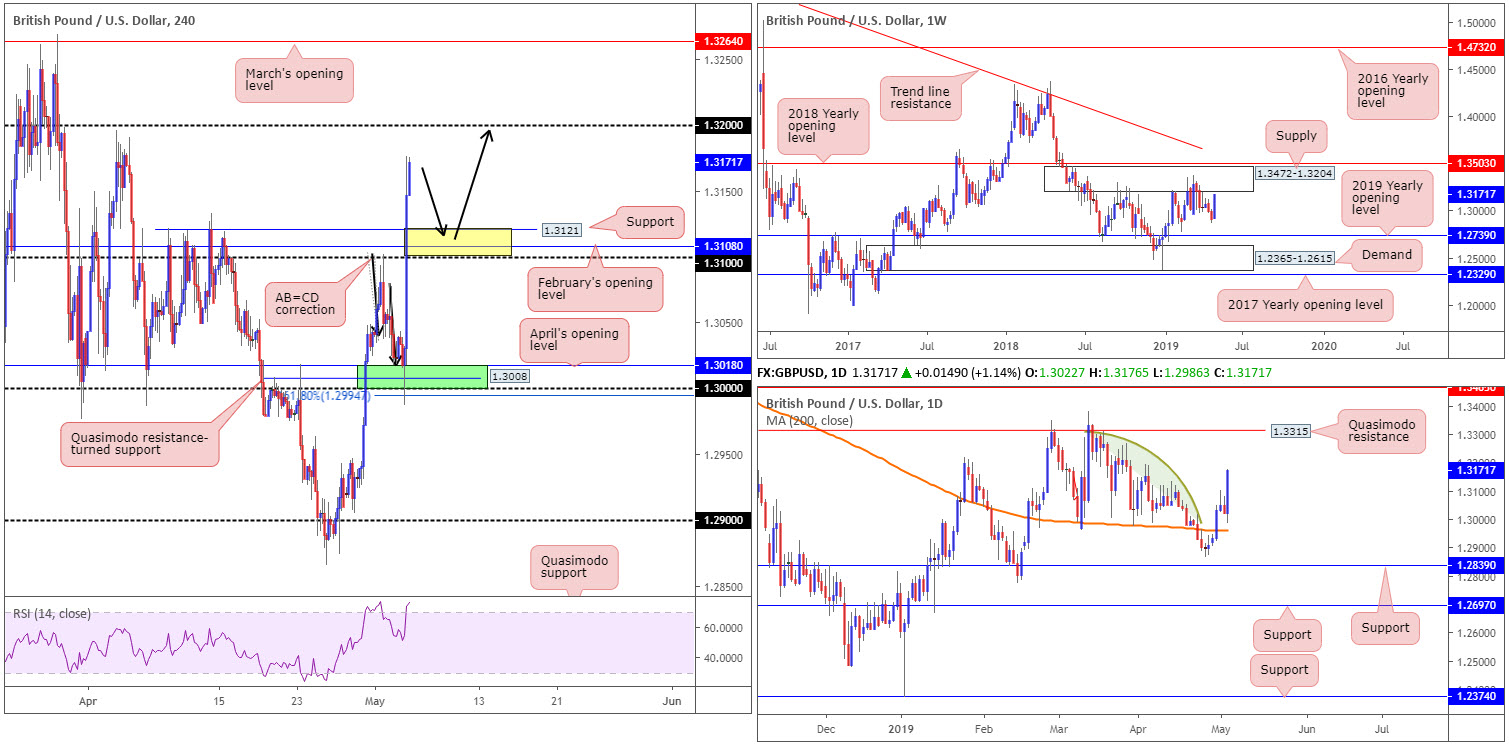
GBP/USD bulls went on the offensive in recent trading, drawing weekly price towards the underside of supply at 1.3472-1.3204, situated a few points south of the 2018 yearly opening level at 1.3503. Having observed this area hold price action lower on a number of occasions in the past, history has a good chance of repeating itself here should the area be tested this week.
Daily perspective:
Having seen the daily candles establish a firm position above its 200-day SMA, as well as limited supply plotted to the left of current price until reaching Quasimodo resistance at 1.3315 (the green arc pattern is there to mark consumed supply – notice price action filled each supply before turning lower), additional buying may materialise this week.
H4 perspective:
Sterling witnessed a pivotal recovery emerge Friday, with US non-farm payrolls seemingly the catalyst amid a lack of other fundamental drivers. Technical action shows the unit tested 1.30 as support and, in the shape of a near-full-bodied bullish candle, price reclaimed 1.31+ status into the close.
For those who read Friday’s morning brief you may recall the piece underscored 1.30 as being an area buyers may find interest in. What gave this number extra credibility was Quasimodo resistance-turned support at 1.3008 and April’s opening level at 1.3018 – green. In addition to this, the approach formed by way of an AB=CD correction (black arrows) which boasted a Fibonacci extension point (161.8%) at 1.2994. Well done to any of our readers who took advantage of 1.30/1.3018 – incredible risk/reward trade.
The next port of call in terms of resistance on the H4 timeframe falls in around the 1.32 handle. Note this is roughly where the underside of the weekly supply resides (1.3204).
Areas of consideration:
With price action showing room to reach 1.32ish, a pullback to the yellow zone on the H4 timeframe between 1.31/1.3121 (comprised of the round number 1.31, February’s opening level at 1.3108 and a support level at 1.3121), is eyed. There is a cautionary point to include, however, and that’s the threat of a fakeout occurring through 1.31, which is common viewing around psychological numbers to run stops. For that reason, waiting for additional confirmation to form before pulling the trigger is recommended (entry and risk parameters can be determined according to the selected confirmation technique).
Today’s data points: UK banks are closed in observance of May Day; FOMC Member Williams Speaks.
AUD/USD:
Weekly gain/loss: -0.22%
Weekly close: 0.7020
Weekly perspective:
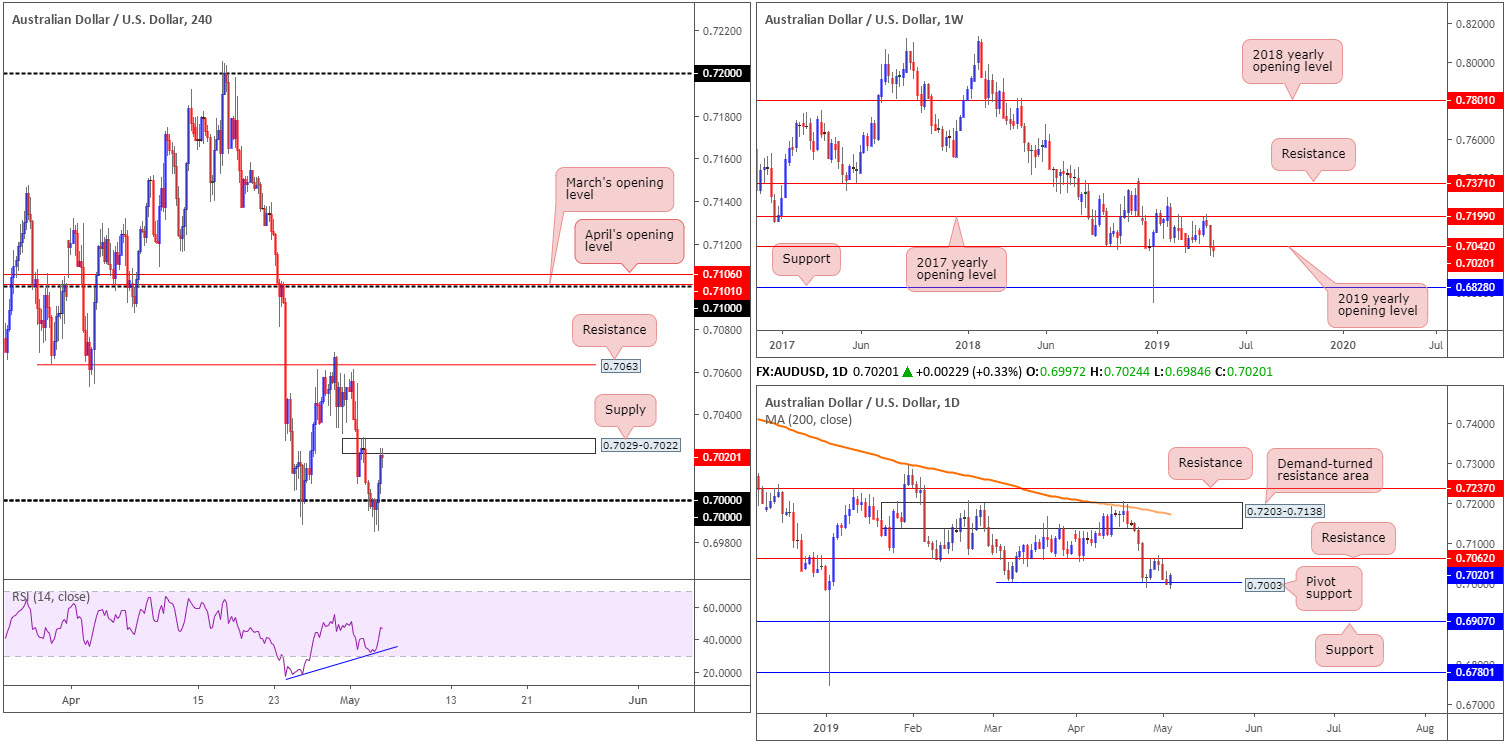
The Australian dollar weakened further against the US dollar over the course of last week, marginally dipping beneath the 2019 yearly opening level at 0.7042. Subject to sellers remaining in the driving seat below 0.7042, the pair is effectively starved of support until shaking hands with 0.6828 – more than 200 points.
Daily perspective:
Pivot support coming in at 0.7003 on the daily timeframe is, despite a mild close forming below this level Thursday last week, still a barrier worthy of attention. Traders may want to acknowledge the next upside target from this level coming in at 0.7062, whereas a move back to the downside could potentially stretch as far south as support at 0.6907.
H4 perspective:
Confirmed by positive bullish divergence from the RSI indicator (blue line), and influenced by mixed US employment figures, Friday’s movement reclaimed 0.70 to the upside and concluded the session challenging the underside of a small, albeit fresh, supply zone at 0.7029-0.7022. In the event this area is overthrown, the next resistance to be aware of is 0.7063. It might also be of interest to some traders, given the position of weekly price, the research team sees limited support in view beneath 0.70 until 0.69.
Areas of consideration:
A break beyond 0.70 on a H4 closing basis will likely clear the runway south to 0.69. Note, however, the higher timeframes suggest price action could possibly drop as far south as weekly support priced in at 0.6828.
On account of this, traders are urged to keep eyes open for a strong H4 close beneath 0.70 this week that’s followed up with a retest (preferably by way of a H4 bearish candlestick formation [entry/risk parameters can be defined according to this structure] – more of a conservative route than selling the breakout candle). This, given the higher-timeframe setting, will likely draw in additional shorts that traders can take advantage of.
Entering long above the current H4 supply area may appear enticing on the H4 timeframe, though working with multiple timeframes we can see that although daily support is in play at 0.7003, a long above the supply has traders buying into weekly resistance: the underside of the 2019 yearly opening level. For that reason, trade any longs with caution.
Today’s data points: China Caixin Services PMI; FOMC Member Williams Speaks.
USD/JPY:
Weekly gain/loss: -0.41%
Weekly close: 111.07
Weekly perspective:
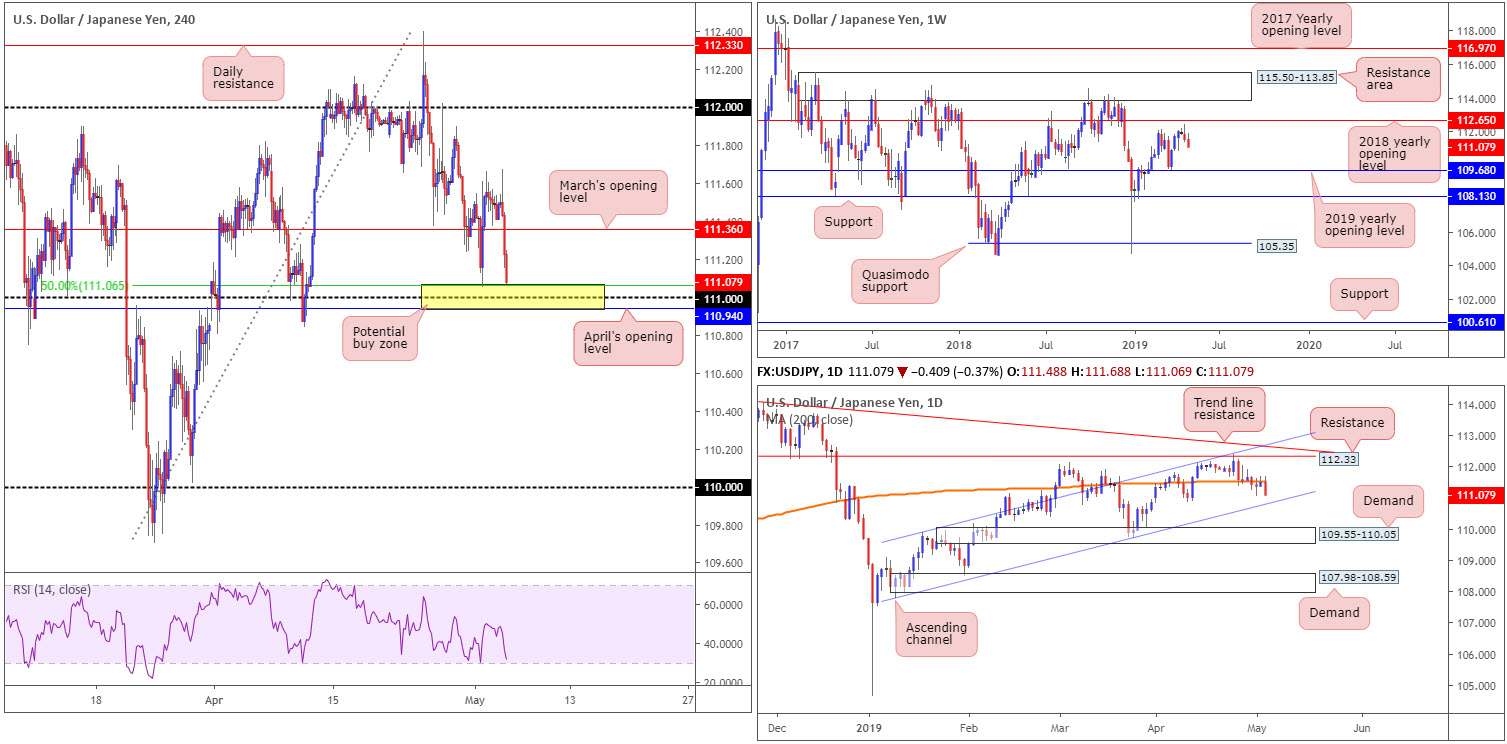
Leaving the 2018 yearly opening level at 112.65 unopposed, two back-to-back bearish candles formed, both closing nearby their respective lows. Further selling from this point is a possibility and has the 2019 yearly opening level at 109.68 to target. Traders may also want to note the long-standing resistance area positioned at 115.50-113.85, in the event we eventually push for higher ground.
Daily perspective:
In conjunction with weekly flow, the 200-day SMA on the daily timeframe served well as resistance into the closing stages of the week, with price action poised to challenge nearby channel support etched from the low 107.77 today/early week.
H4 perspective:
The US dollar sunk vs. the Japanese yen Friday following mixed US employment data. Peaking around 111.67, the pair dethroned March’s opening level at 111.36 and cleared the runway for an approach to a support area (yellow) pencilled in at 110.94/111.06 (made up of April’s opening level at 110.94, the round number 111 and the 50.0% support value drawn from 111.06). What’s also notable from a technical standpoint is the daily channel support underscored above is seen located a few points beneath the said H4 support zone.
Areas of consideration:
In view of Wednesday’s response from the top edge of the H4 support zone at 110.94/111.06, along with the threat of a possible fakeout to daily channel support and weekly price showing room to press lower, the H4 support area is not a zone the research team labels high probability. At the very least, traders should consider waiting for additional confirmation to form before marking this zone valid. A Hammer candlestick pattern, for example, not only identifies buyer intent, but also provides entry and risk levels to work with.
Today’s data points: FOMC Member Williams Speaks; Japanese banks are closed in observance of Children’s Day.
USD/CAD:
Weekly gain/loss: -0.26%
Weekly close: 1.3419
Weekly perspective:
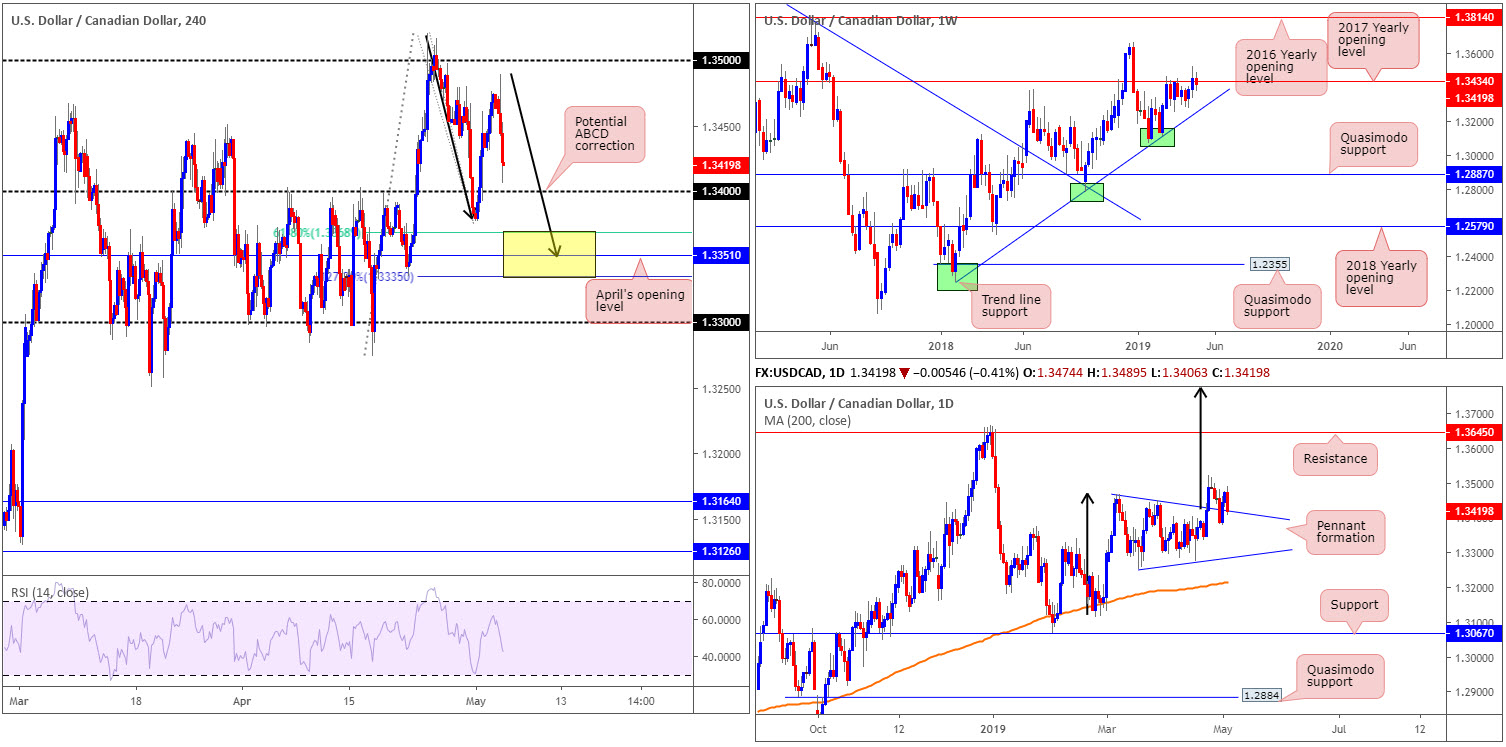
Although longer-term flows broke out to the upside the week prior, conquering the 2017 yearly opening level at 1.3434, price action failed to generate much follow-through momentum since. In fact, last week’s movement ended by way of an inside candle pattern (bearish) that closed below 1.3434, which could signal further selling in this market, targeting trend line support taken from the low 1.2247. In the event the current candlestick signal fails and we push higher, however, this could eventually lead to a move materialising in the direction of the 2018 yearly high of 1.3664.
Daily perspective:
In the shape of a bearish engulfing candle formation, the daily candles wrapped up the week revisiting the top edge of a bullish pennant formation. Although the traditional price target (calculated by taking the distance from the beginning of the preceding move and adding it the breakout price) will remain on the chart (black arrows), the next upside target from a structural standpoint falls in around resistance at 1.3645.
H4 perspective:
A brief recap of Friday’s session on the H4 timeframe witnessed the USD/CAD spike to a session high of 1.3489 in response to April’s job’s numbers out of the US. Unable to preserve its momentum, the pair turned lower and concluded the session within touching distance of the 1.34 handle.
1.34 could hold price action higher early week, though the more appealing area of support (in terms of H4 confluence) resides lower down on the chart between (yellow) at 1.3335/1.3368. Comprised of April’s opening level at 1.3351 as the centre line, a 61.8% Fibonacci support value at 1.3368 and a potential ABCD (black arrows) 127.2% Fibonacci ext. point at 1.3335, this zone offers reasonably strong local confluence.
Areas of consideration:
On account of our technical studies, 1.34 is a level of support to watch today given its close connection with the top edge of the daily pennant pattern. However, do bear in mind by entering long from here you are potentially competing against weekly sellers from an inside candle formation and a daily bearish engulfing signal. Therefore, trade cautiously. The yellow H4 zone highlighted above at 1.3335/1.3368 is likely to offer a bounce this week, though suffers from the same problems as a long from 1.34.
Irrespective of which area is chosen (if any), traders may want to consider waiting and seeing if the H4 candles chalk up a bullish candlestick signal (entry and risk can then be determined according to the pattern’s rules) before pulling the trigger.
Today’s data points: FOMC Member Williams Speaks; BoC Gov Poloz Speaks.
USD/CHF:
Weekly gain/loss: -0.32%
Weekly close: 1.0163
Weekly perspective:
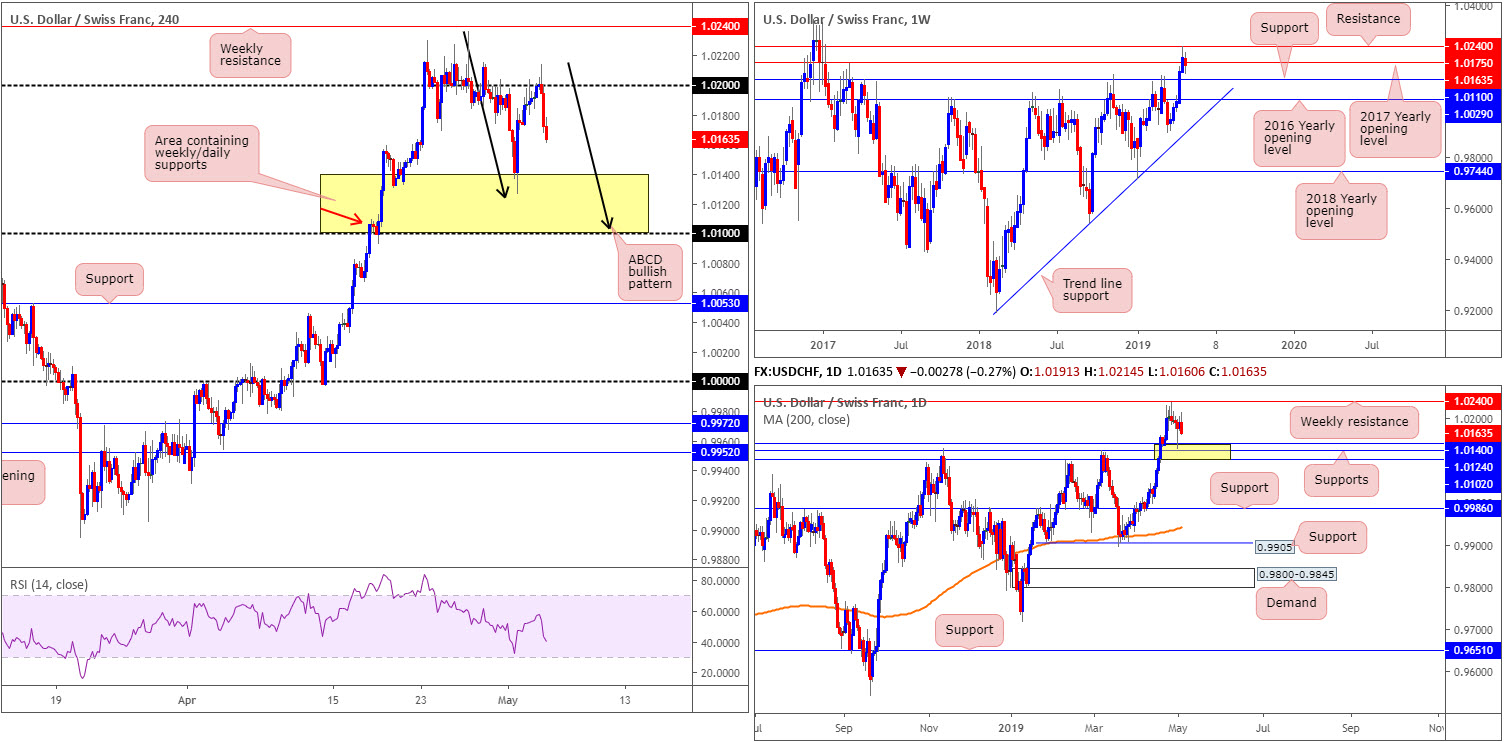
Following a five-week advance, renewed selling interest emerged last week after recently coming into close contact with resistance at 1.0240, consequently hauling price action marginally beneath its 2017 yearly opening level at 1.0175. Though the chart shows signs of seller intent, traders may want to recognise support resting close by at 1.0110, followed by the 2016 yearly opening level at 1.0029.
Daily perspective:
By way of a bearish engulfing pattern, daily movement ended the week facing a possible test of three nearby layers of support coming in at 1.0102/1.0140. Note this area also happens to hold the weekly support mentioned above at 1.0110 within. A move below here, nonetheless, exhibits scope to press as far south as support coming in at 0.9986.
H4 perspective:
The after-effects of Friday’s employment release saw the dollar immediately rally to a high just north of the 1.02 handle at 1.0214. However, the bulls swiftly lost their flavour and turned lower as focus turned to the average earnings growth miss and the participation rate surprisingly declining.
According to H4 structure, the pair is in the process of chalking up an ABCD bullish symmetrical correction (black arrows) that terminates a few points north of 1.01. The yellow zone enveloping the ABCD termination point represents the area of daily supports between 1.0102/1.0140.
Areas of consideration:
Keeping it as simple as possible this week, the research has eyes on the yellow area of daily supports, in particular the lower boundary of the zone: the H4 ABCD termination point around 1.0103. Without waiting for additional confirmation, traders are likely looking to enter at 1.0103 and position stops just south of nearby H4 demand (red arrow) at 1.0093-1.0108.
Today’s data points: FOMC Member Williams Speaks.
Dow Jones Industrial Average:
Weekly gain/loss: +0.09%
Weekly close: 26490
Weekly perspective:
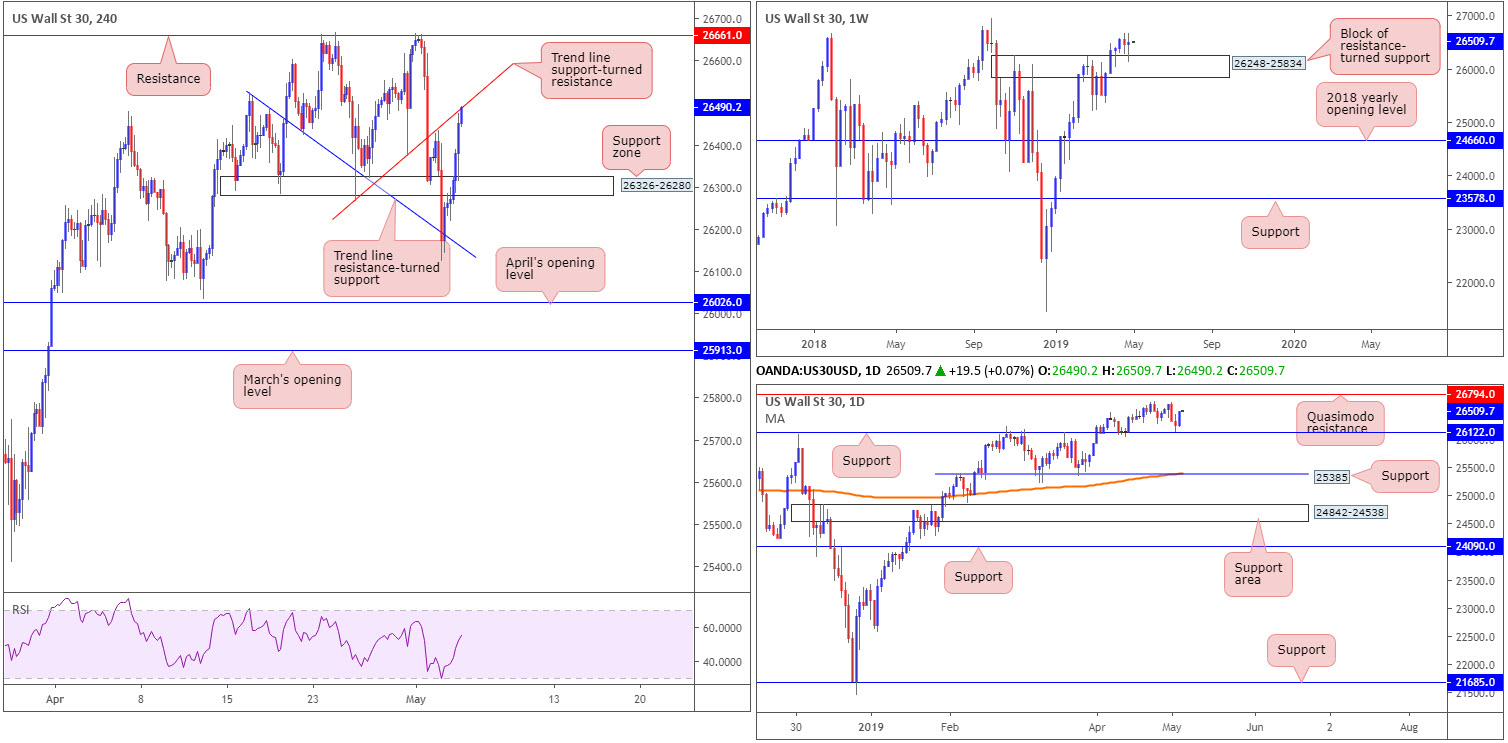
Formed by way of an indecision candle (Doji), price action revisited the top edge of a resistance-turned support area at 26248-25834 last week. In the event further buying develops this week, the next port of call to the upside on this timeframe can be seen around the all-time high of 26939.
Daily perspective:
Located within the top region of the current support zone on the weekly timeframe, daily structure displays support at 26122, which was brought into the mix Thursday. Before reaching the all-time high of 26939, as suggested on the weekly timeframe, price action on the daily timeframe has Quasimodo resistance at 26794 to contend with beforehand.
H4 perspective:
US stocks rallied Friday, flipping the Dow Jones Industrial Average positive for the week, after data showed the US labour market added more jobs than expected in April.
Technically speaking, price action extended Thursday’s rebound off trend line resistance-turned support taken from the high 26525 and rallied to a session high of 26491. As you can see, the day ended with price testing the underside of a trend line support-turned resistance taken from the low 26265. Beyond here, the research team has eyes on resistance plotted at 26661.
Areas of consideration:
With both weekly and daily action portending higher moves this week, selling from the current H4 trend line support-turned resistance may only produce a small bounce at best. Therefore, this is not a line the research team labels high probability.
An area that does likely spark interest among technicians this week is the H4 support area at 26326-26280, plotted just north of the weekly support area mentioned above at 26248-25834. A retest of the H4 area in the shape of a H4 bullish candlestick pattern (entry and risk parameters can be defined according to the candlestick pattern selected) would, in light of its connection with nearby higher-timeframe support, likely be enough to draw in buyers this week and print reasonable gains.
Today’s data points: FOMC Member Williams Speaks.
XAU/USD (GOLD):
Weekly gain/loss: -0.54%
Weekly close: 1278.9
Weekly perspective:
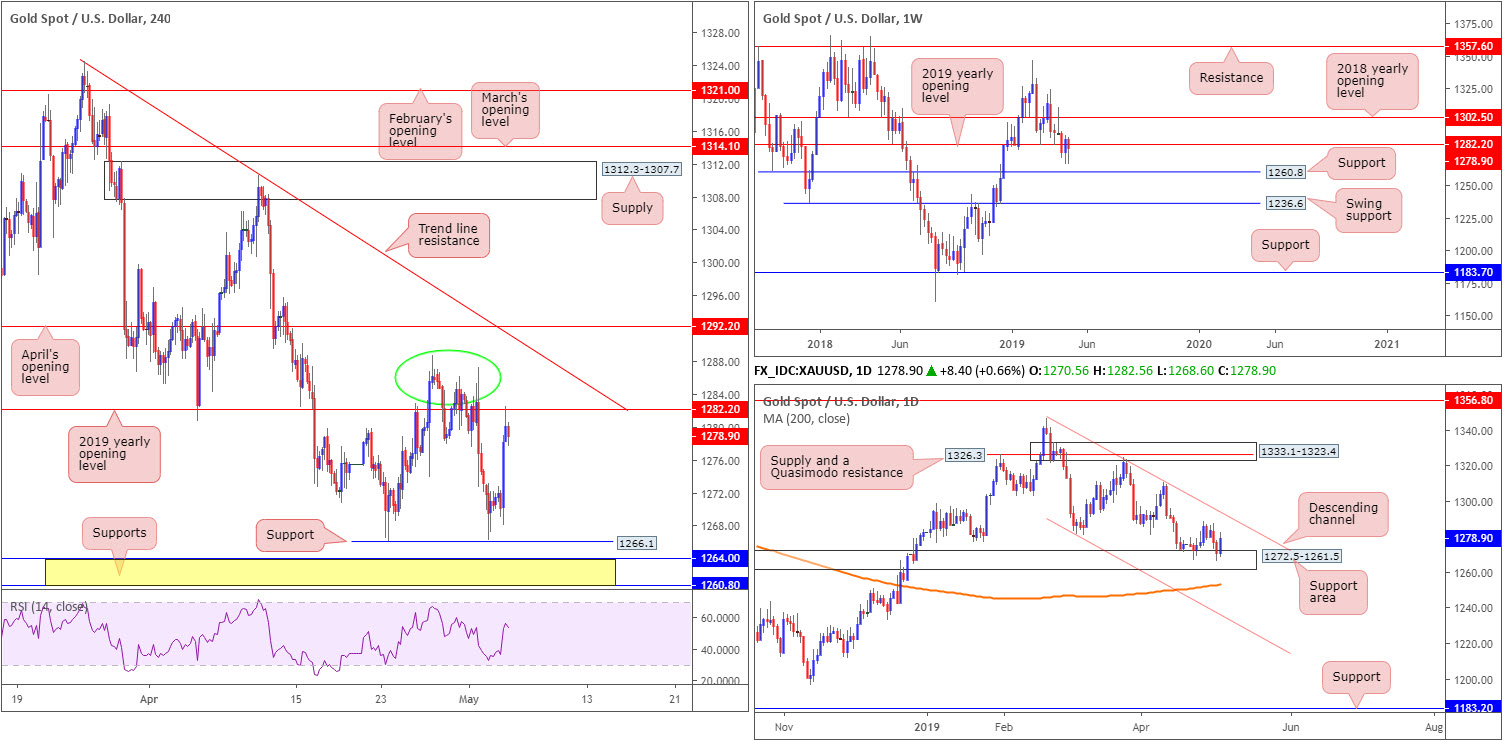
Weekly price, as is evident from the chart, continues to languish beneath its 2019 yearly opening level at 1282.2. Further selling from this point has support coming in at 1260.8 to target, whereas a move back above 1282.2 may call for a move in the direction of the 2018 yearly opening level at 1302.5.
Daily perspective:
Contrary to weekly structure suggesting a move lower may be on the cards, daily flow is seen shaking hands with a support area coming in at 1272.5-1261.5, Supported since mid-April, the next upside target from here can be seen around channel resistance drawn from the high 1346.7.
H4 perspective:
Friday’s US job’s data provided bullion fresh impetus, after the US dollar index sank 0.36%. The H4 candles now face possible resistance emerging around the 2019 yearly opening level on the weekly timeframe at 1282.2, followed by a lump of resistance around the 1284.0ish region (green circle). Not too far above here, traders may also recognise trend line resistance extended from the high 1324.5, shadowed closely by April’s opening level at 1292.2.
Areas of consideration:
In essence, we have a somewhat cluttered market, according to our technical studies.
Weekly price suggests we may be heading for lower ground this week, as does H4 structure. Rivalling this theory, however, the yellow metal is rebounding from a daily support area.
With daily action struggling to make headway off its support area since mid-April, the odds of price action respecting the 2019 yearly opening level at 1282.2/H4 resistance points between 1292.2 and 1284.0 this week is high. As such, traders can ‘expect’ a move lower this week, targeting H4 support at 1266.1 as the initial port of call (positioned within the walls of the current daily support area at 1272.5-1261.5).
The accuracy, completeness and timeliness of the information contained on this site cannot be guaranteed. IC Markets does not warranty, guarantee or make any representations, or assume any liability with regard to financial results based on the use of the information in the site.
News, views, opinions, recommendations and other information obtained from sources outside of www.icmarkets.com.au, used in this site are believed to be reliable, but we cannot guarantee their accuracy or completeness. All such information is subject to change at any time without notice. IC Markets assumes no responsibility for the content of any linked site. The fact that such links may exist does not indicate approval or endorsement of any material contained on any linked site.
IC Markets is not liable for any harm caused by the transmission, through accessing the services or information on this site, of a computer virus, or other computer code or programming device that might be used to access, delete, damage, disable, disrupt or otherwise impede in any manner, the operation of the site or of any user’s software, hardware, data or property.


