
A note on lower-timeframe confirming price action…
Waiting for lower timeframe confirmation is our main tool to confirm strength within higher timeframe zones, and has really been the key to our trading success. It takes a little time to understand the subtle nuances, however, as each trade is never the same, but once you master the rhythm so to speak, you will be saved from countless unnecessary losing trades. The following is a list of what we look for:
- A break/retest of supply or demand dependent on which way you’re trading.
- A trendline break/retest.
- Buying/selling tails/wicks – essentially we look for a cluster of very obvious spikes off of lower timeframe support and resistance levels within the higher timeframe zone.
- Candlestick patterns. We tend to stick with pin bars and engulfing bars as these have proven to be the most effective.
We typically search for lower-timeframe confirmation between the M15 and H1 timeframes, since most of our higher-timeframe areas begin with the H4. Stops are usually placed 3-5 pips beyond confirming structures.
EUR/USD:
Weekly gain/loss: + 62 pips
Weekly closing price: 1.0621
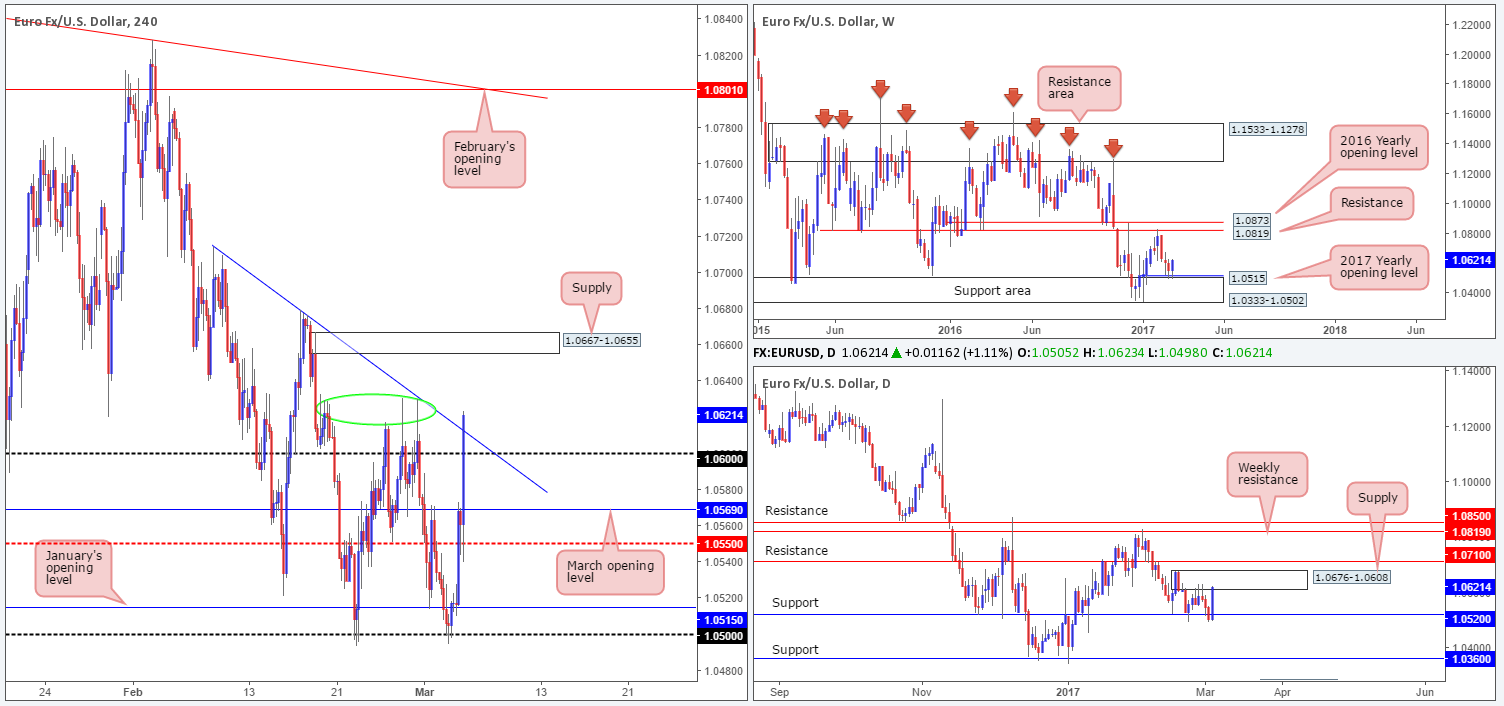
Following a three-week slide, renewed buying interest came into the market last week from the top edge of a major weekly support area at 1.0333-1.0502 that’s bolstered by the 2017 yearly opening level at 1.0515. In the event that the bulls continue to push forward this week, the next upside objective in view can be seen at 1.0819/1.0873 (weekly resistance/the 2016 yearly opening base).
Since the 22nd February, the daily candles have been sandwiched between a daily support hurdle coming in at 1.0520 and a daily supply area drawn from 1.0676-1.0608. If this daily supply is violated this week the next level on the horizon is a nearby daily resistance seen at 1.0710. On the other hand, a downside move through the daily support could set that stage for a continuation move south down to a daily support level pegged at 1.0360.
A quick recap of Friday’s action on the H4 chart shows that the pair ended the day on a positive tone, closing above the H4 trendline resistance extended from the high 1.0714. In spite of Janet Yellen’s recent comments regarding a potential rate hike in March, dollar bulls were clearly not impressed!
Our suggestions: On account of the above notes, we see the following:
- While the H4 candles did indeed close above a H4 trendline resistance, the bulls have to contend with not only the H4 resistance zone marked with a green circle around the 1.0630ish range, but also the daily supply mentioned above at 1.0676-1.0608!
- On the other side of the coin, the break above the H4 trendline resistance could be viewed as a mark of strength given where weekly price has just bounced from.
Both of the above points are valid, in our opinion. However, trading this market based on either, as you can see, would place you in direct conflict with opposite structure. Therefore, although it may not feel like the right move, sometimes trading flat is the more logical position to take.
Data points to consider: FOMC member Kashkari speaks at 8pm GMT.
Levels to watch/live orders:
- Buys: Flat (stop loss: N/A).
- Sells: Flat (stop loss: N/A).
GBP/USD:
Weekly gain/loss: – 161 pips
Weekly closing price: 1.2293
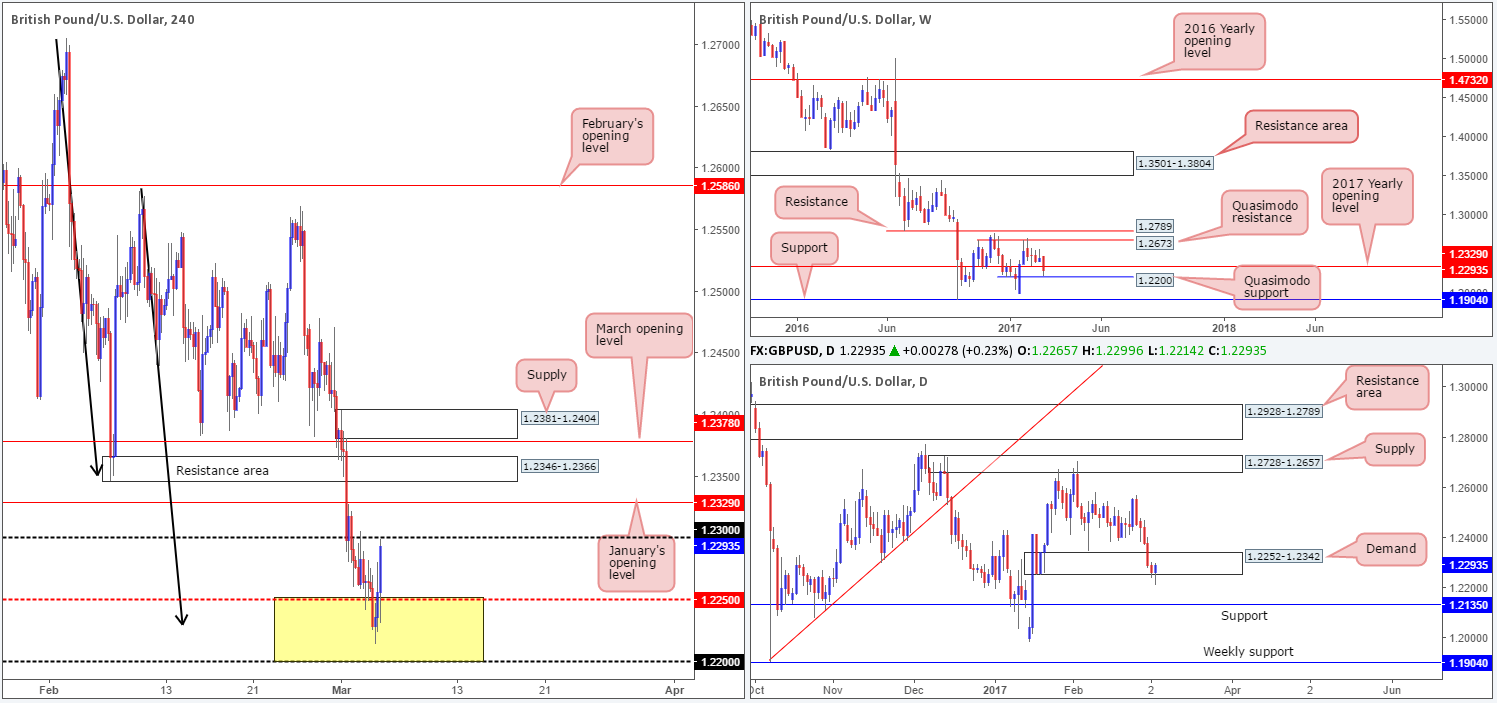
Over the last week we saw the GBP fall sharply, which led to price taking out the 2017 yearly opening base at 1.2329. Nevertheless, what is particularly notable from the weekly chart is the fact that the pair came within 15 pips of striking the weekly Quasimodo support level at 1.22.
Zooming in and looking at the daily picture, the pair printed a relatively nice-looking daily buying tail going into the week’s closing point, consequently breaking a five-day bearish phase. Of particular interest here is that the daily buying tail formed around the lower limits of a daily demand area seen at 1.2252-1.2342.
In previous writings, our desk highlighted the 1.22/1.2250 H4 area as a potential buy zone in this market. 1.2250 fuses with a H4 AB=CD (see black arrows) formation that completes around the 1.2229 neighborhood (taken from the high 1.2706). In addition to this, our zone was further bolstered by the 1.22 handle (yellow zone), which, as you can see, represents the weekly Quasimodo support line discussed above. Well done to any of our readers who managed to jump aboard Friday’s move from here, as price recently touched gloves with the underside of the 1.23 handle!
In our humble opinion, this may be a good place to reduce risk to breakeven and take some profits off the table, as beyond 1.23 we see a minefield of potentially troublesome zones. Of course, this is not to say that price will not rally higher today/this week, it just pays to be on the side of caution in this business!
Our suggestions: Unless price trades back into our above mentioned H4 buy zone, we see very little else to hang our hat on at the moment.
Data points to consider: MPC member Hogg speaks at 11.30am. FOMC member Kashkari speaks at 8pm GMT.
Levels to watch/live orders:
- Buys: 1.22/1.2250 ([wait for a reasonably sized H4 bull candle to form within the zone before looking to pull trigger here] stop loss: ideally beyond the trigger candle).
- Sells: Flat (stop loss: N/A).
AUD/USD:
Weekly gain/loss: – 73 pips
Weekly closing price: 0.7593
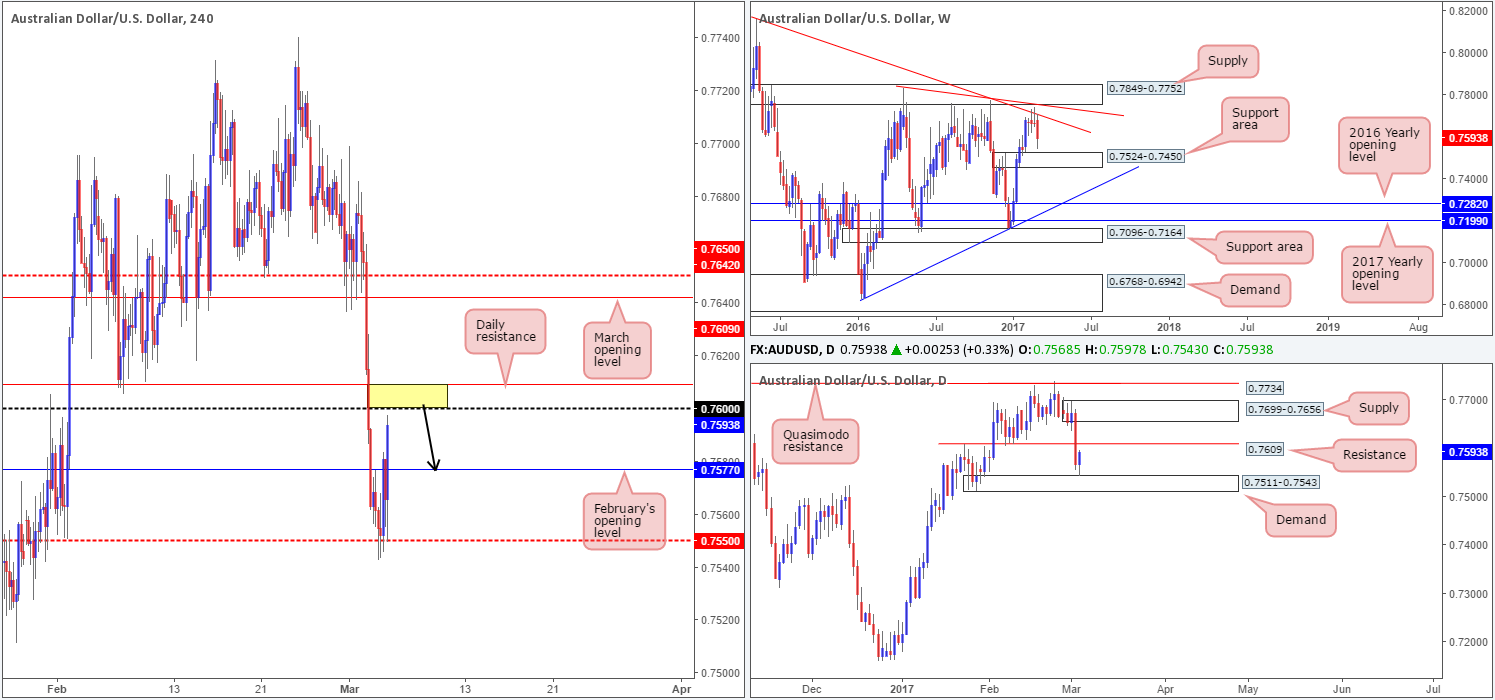
After two weeks of sluggish action seen around the weekly trendline resistance stretched from the high 0.8163, price eventually sold off last week and brought the unit to a low of 0.7543. As a result of this, our crosshairs will be fixed on the weekly support area at 0.7524-0.7450 this week.
Daily demand at 0.7511-0.7543 (positioned around the top edge of the above noted weekly support area) on the other hand remained firm on Friday, and by the looks of things will likely force price to cross swords with the nearby daily resistance at 0.7609 sometime today.
During the course of Friday’s sessions, Fed Chair Janet Yellen alluded to the possibility of a rate hike in March. Despite this strong signal for bullish dollar upside, the currency tumbled lower and sent the Aussie higher! As of the week’s close, the couple is seen lurking within touching distance of the 0.76 hurdle, which, as we’re sure you can already see, is located just below the aforementioned daily resistance base (yellow zone).
Our suggestions: Through the simple lens of a technical trader, the 0.76 region is likely going to hold this unit lower today. Therefore, we believe that between 0.7609/0.76 is a prime location to hunt for lower-timeframe shorting opportunities (see the top of this report for ideas on entry signals). The first take-profit line, at least for our team, will likely be February’s opening level at 0.7577, followed closely by the H4 mid-way support at 0.7550.
Data points to consider: Australian retail sales at 12.30am. FOMC member Kashkari speaks at 8pm GMT.
Levels to watch/live orders:
- Buys: Flat (stop loss: N/A).
- Sells: 0.7609/0.76 region ([wait for a lower-timeframe signal to form before looking to pull the trigger] stop loss: dependent on where one confirms the zone).
USD/JPY:
Weekly gain/loss: + 188 pips
Weekly closing price: 114.02
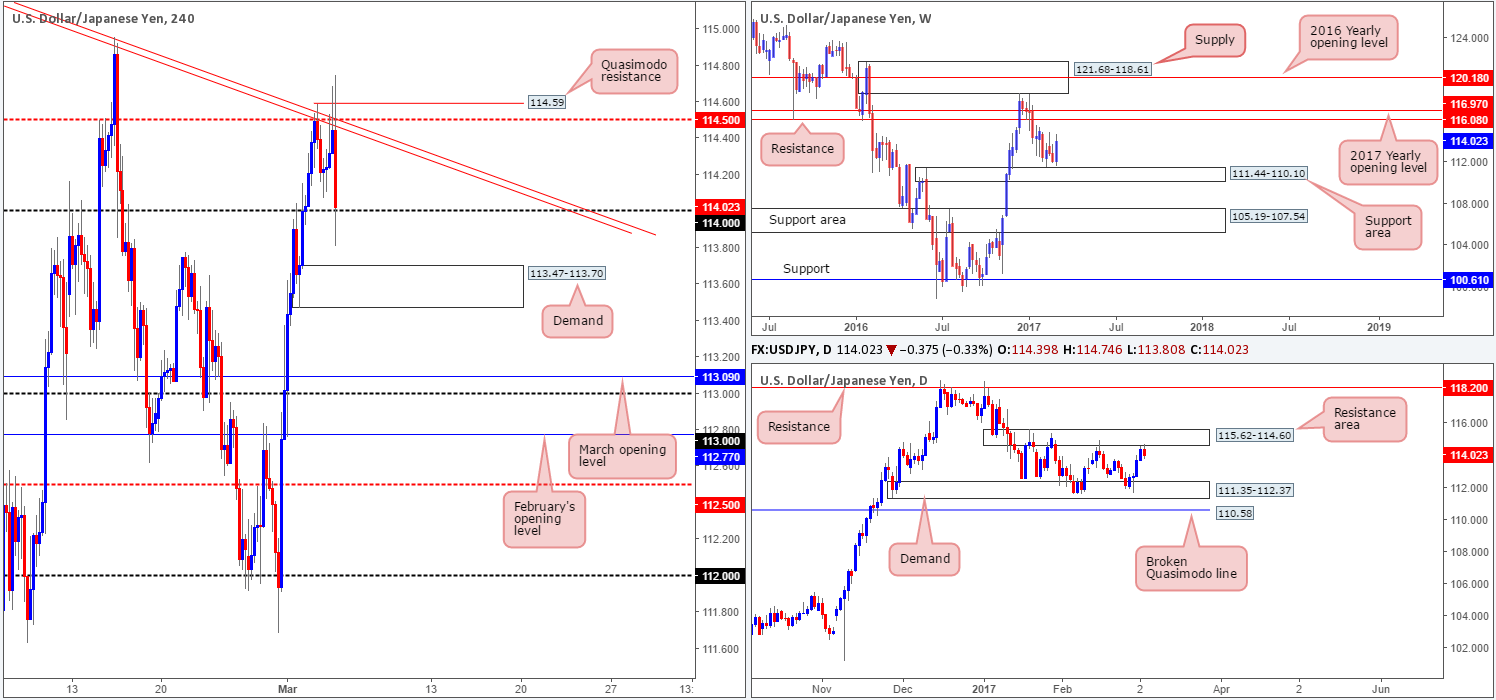
Twenty five or so pips ahead of the weekly support area at 111.44-110.10, a strong-looking weekly bullish engulfing candle took shape last week. On the assumption that the bulls remain in the driving seat here, the next area of value can be seen at 116.97/116.08 (the 2017 yearly opening level at 116.97 and weekly resistance at 116.08).
Since mid-January, the daily candles have been consolidating between a daily resistance area carved from 115.62-114.60 and a daily demand base seen at 111.35-112.37. Perhaps the most compelling factor here is that the daily bears recently connected with the top edge of this range. This, of course, poses a small problem as weekly action suggests further upside could be on the cards.
A brief look at recent dealings on the H4 chart shows that price immediately jumped to a high of 114.74 following the release of Yellen’s comments. However, as you can see, the rally was a short-lived one with price spending the remainder of the US segment tumbling lower.
Our suggestions: While H4 price did pierce through the 114 handle quite aggressively on Friday, it managed to hold firm into the closing bell. With that being said though, buying from here knowing that daily price is trading from a resistance area is not really something that our team would be comfortable with. On a similar note, a break below 114 boasts little wiggle room to the downside as a H4 demand area is seen lurking at 113.47-113.70. And, of course, not to mention the fact that you’d be selling against potential weekly buyers!
As far as we can see, technical elements are too mixed for the time being leaving us with little choice but to remain flat for now.
Data points to consider: FOMC member Kashkari speaks at 8pm GMT.
Levels to watch/live orders:
- Buys: Flat (stop loss: N/A).
- Sells: Flat (stop loss: N/A).
USD/CAD:
Weekly gain/loss: + 279 pips
Weekly closing price: 1.3375
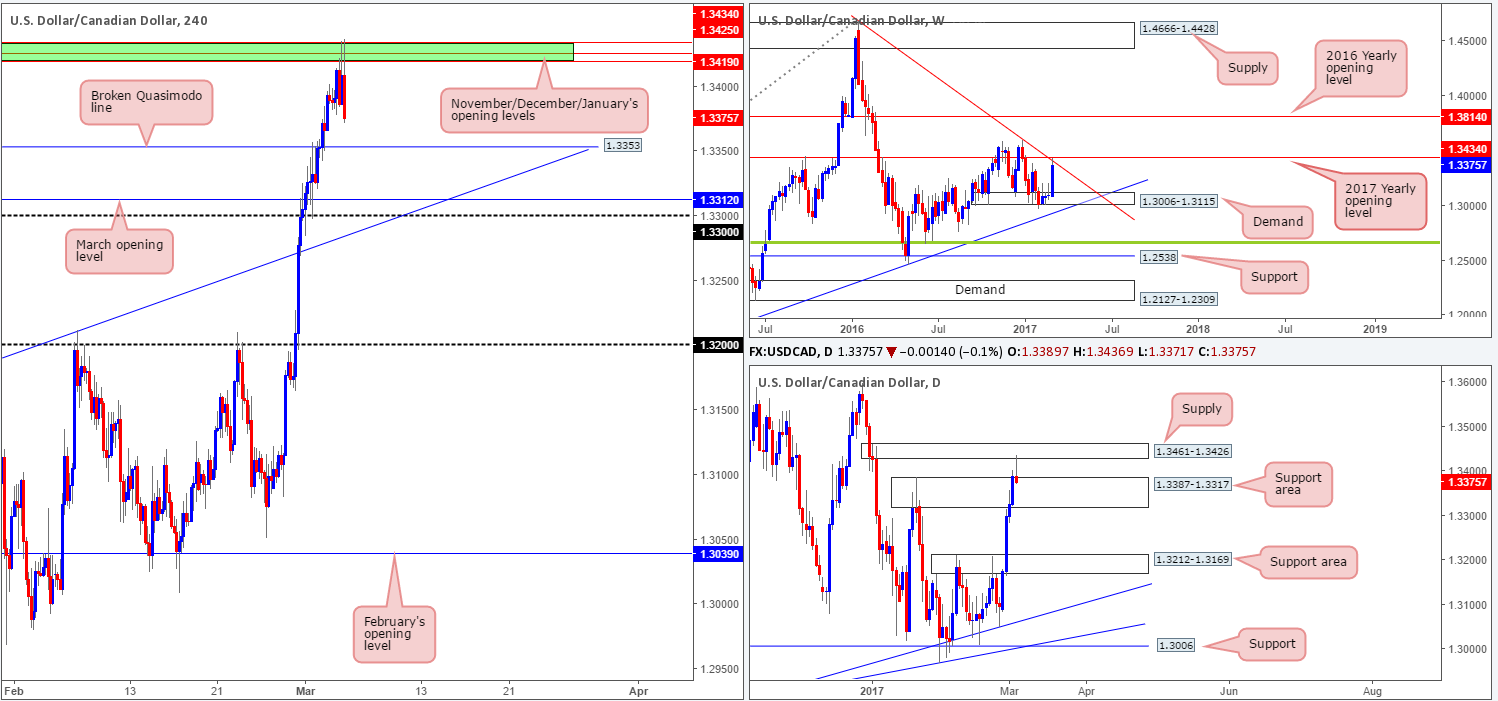
The US dollar made considerable ground against its Canadian counterpart last week, lifting weekly action up to the 2017 yearly opening level at 1.3434 which intersects beautifully with a weekly trendline resistance taken from the high1.4689.
In conjunction with the weekly timeframe, daily price caught an offer from the underside of a daily supply area logged in at 1.3461-1.3426 on Friday and chalked up a nice-looking daily selling wick. However, it may be worth noting that although both the weekly and daily charts present a rather bearish tone at the moment, there is a daily support area at 1.3387-1.3317 also now in play!
In Friday’s report, we mentioned to keep an eyeball on the H4 zone at 1.3434/1.3419 for shorting opportunities. This green area comprises of November, December and January’s opening levels! As can be seen from the H4 chart, this zone did in fact hold prices lower so well done to any of our readers who managed to net some green pips here!
Moving forward, we have the following H4 support structures ahead:
- The H4 broken Quasimodo line at 1.3353.
- March opening level at 1.3312.
- The 1.33 handle.
These three zones, coupled with the current daily support area, may pose problems for sellers this week.
Our suggestions: At current price, we would ideally need H4 price to close below the 1.33 region before our team would be comfortable looking for shorts again. Still, should the pair pullback today and retest the green H4 sell zone mentioned above, we would consider entering short from here on the basis that we’re able to pin down a lower- timeframe sell setup (see the top of this report for ideas on how to find such a signal).
Data points to consider: FOMC member Kashkari speaks at 8pm GMT.
Levels to watch/live orders:
- Buys: Flat (stop loss: N/A).
- Sells: 1.3434/1.3419 ([wait for a lower-timeframe signal to form before looking to pull the trigger] stop loss: dependent on where one confirms the zone).
USD/CHF:
Weekly gain/loss: + 5 pips
Weekly closing price: 1.0075
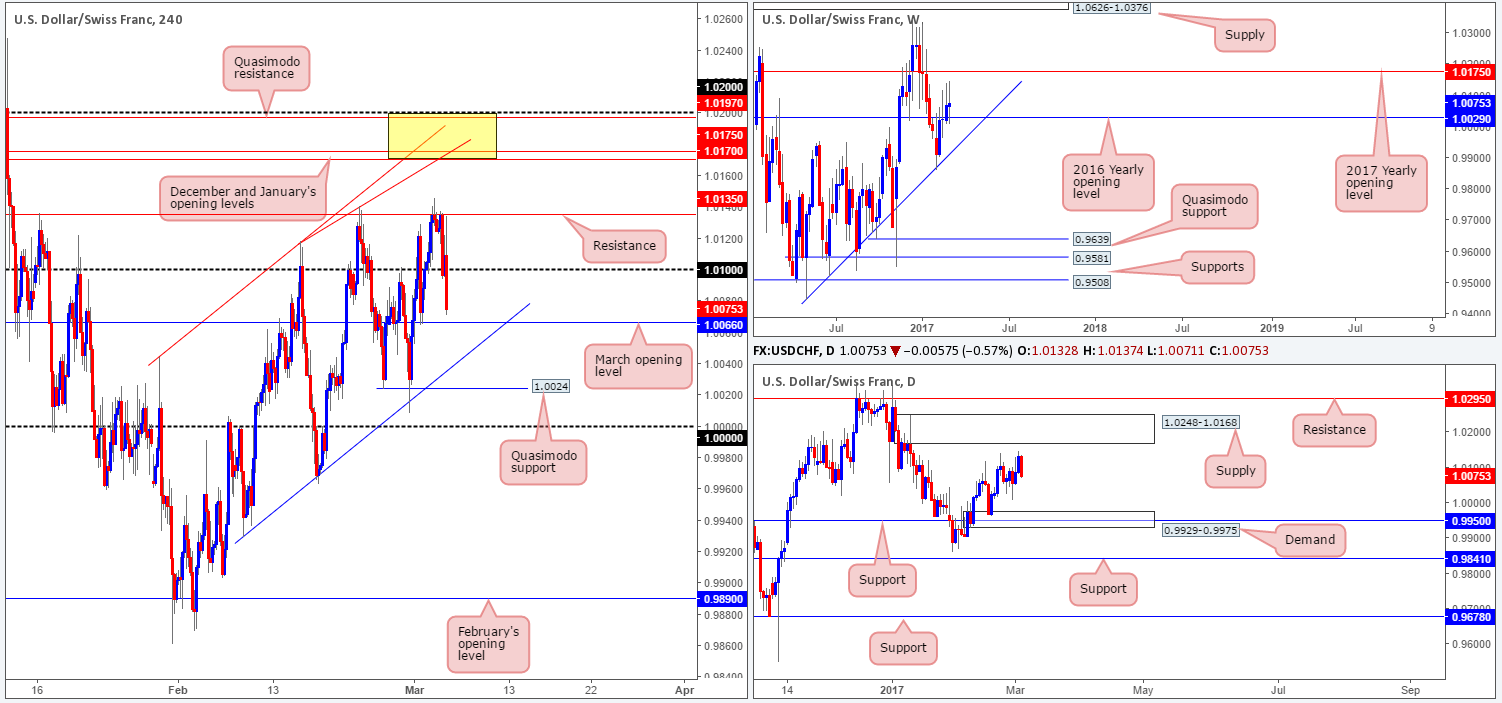
USD/CHF prices, as you can see, are little changed, with the pair seen penciling in a weekly indecision candle last week. Of particular significance here, however, is the fact that the tail of the above noted weekly indecision candle struck the 2016 yearly opening level at 1.0029. Providing that this base holds ground this week, there’s a chance that we may see weekly action shake hands with the 2017 yearly opening line coming in at 1.0175.
Looking down to the daily chart, we can see that price remains loitering mid-range between a daily supply at 1.0248-1.0168 (houses the 2017 yearly opening level mentioned above) and a daily demand base drawn from 0.9929-0.9975.
Reviewing Friday’s movement on the H4 chart shows that despite Janet Yellen’s recent comments regarding a potential rate hike in March, the pair generated little follow-through buying! Instead, the pair turned red and headed southbound, ending the week in bearish territory beyond the 1.01 handle.
Our suggestions: Based on the above notes, our desk has the following logged:
- For longs, the H4 Quasimodo support at 1.0024 looks in good shape. This level boasts: a H4 channel support line taken from the low 0.9929 and the 2016 yearly opening level marked above at 1.0029. However, there is one cautionary point to consider here! Notice that parity sits just below this barrier. This number is a closely watched level and could potentially drag the unit below our Quasimodo base. Therefore, waiting for a lower-timeframe confirming setup to form before pulling the trigger would, in our opinion, be the safer route to take.
- For shorts, our team still has their beady little eye on the 1.02/1.0170 (yellow zone) neighborhood. The area comprises of the following converging structures: both December and January’s opening levels at 1.0170/1.0175, a H4 trendline resistance pegged from the high 1.0118, a H4 Quasimodo resistance at 1.0197, a 1.02 psychological handle and let’s not forget that all of this is seen housed within the daily supply zone coming in at 1.0248-1.0168. In light of this confluence, our team will, dependent on the time of day, look to sell from the 1.0175 neighborhood, with stops placed a few pips above 1.02.
Data points to consider: FOMC member Kashkari speaks at 8pm GMT.
Levels to watch/live orders:
- Buys: 1.0024/1.0029 region ([wait for a lower-timeframe signal to form before looking to pull the trigger] stop loss: dependent on where one confirms the zone).
- Sells: 1.0175 region ([an area one could possibly trade at market] stop loss: 1.0205).
DOW 30:
Weekly gain/loss: + 187 points
Weekly closing price: 20990
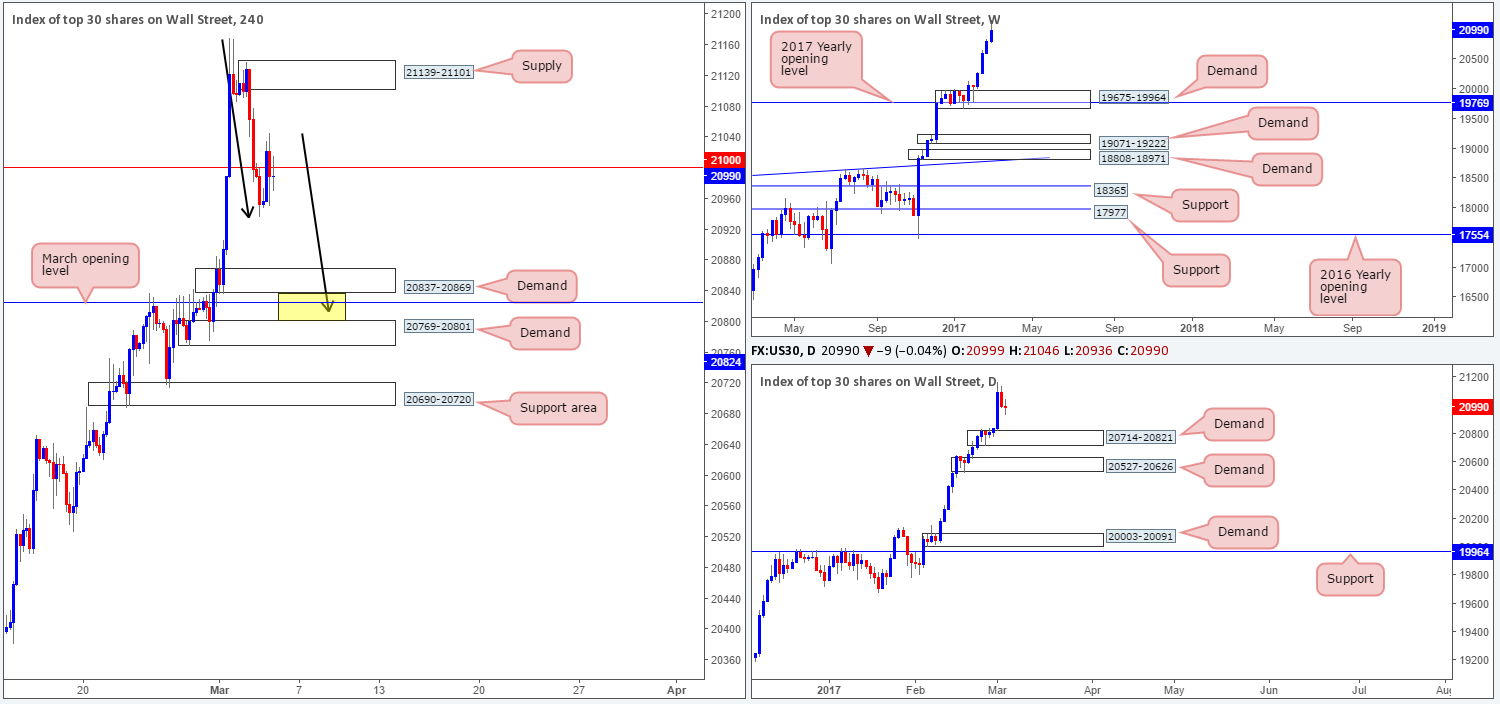
The US equity market continued to climb north last week, registering its fourth consecutive weekly gain! With equities now trading at record highs, where do we go from here? Well, given that there is absolutely no weekly resistance levels in sight, the best we can do for the time being is continue looking to ‘buy the dips’. The closest higher-timeframe area can be seen at 20714-20821: a daily demand zone.
Stepping across to the H4 candles, we can see that Friday’s action was fairly lackluster despite the Fed Chair Janet Yellen voicing intentions to hike rates in March. As is evident from the chart, the index closed the week below the 21000 mark, which could call for a continuation move south down to the H4 demand base drawn from 20837-20869.
Our suggestions: In light of the above points, we still have absolutely no intention of looking to short this unit.
We would rather look to buy from the above noted H4 demand, or even the H4 demand seen below it at 20769-20801, which happens to be positioned within the walls of the aforementioned daily demand zone! The interesting thing here is that in between these two H4 barriers (the yellow zone) is March’s opening level at 20824 and a possible H4 AB=CD completion point at 20813 (see black arrows). To that end, should we see price strike the yellow zone today/this week, our team would, assuming that a reasonably sized H4 bull candle took shape, look to buy from here with stops either placed below the trigger candle or below the H4 demand at 20769-20801.
Data points to consider: FOMC member Kashkari speaks at 8pm GMT.
Levels to watch/live orders:
- Buys: 20801/20837 region ([wait for a reasonably sized H4 bull candle to form before looking to pull trigger here] stop loss: ideally beyond the trigger candle).
- Sells: Flat (stop loss: N/A).
GOLD:
Weekly gain/loss: – $21.6
Weekly closing price: 1234.3
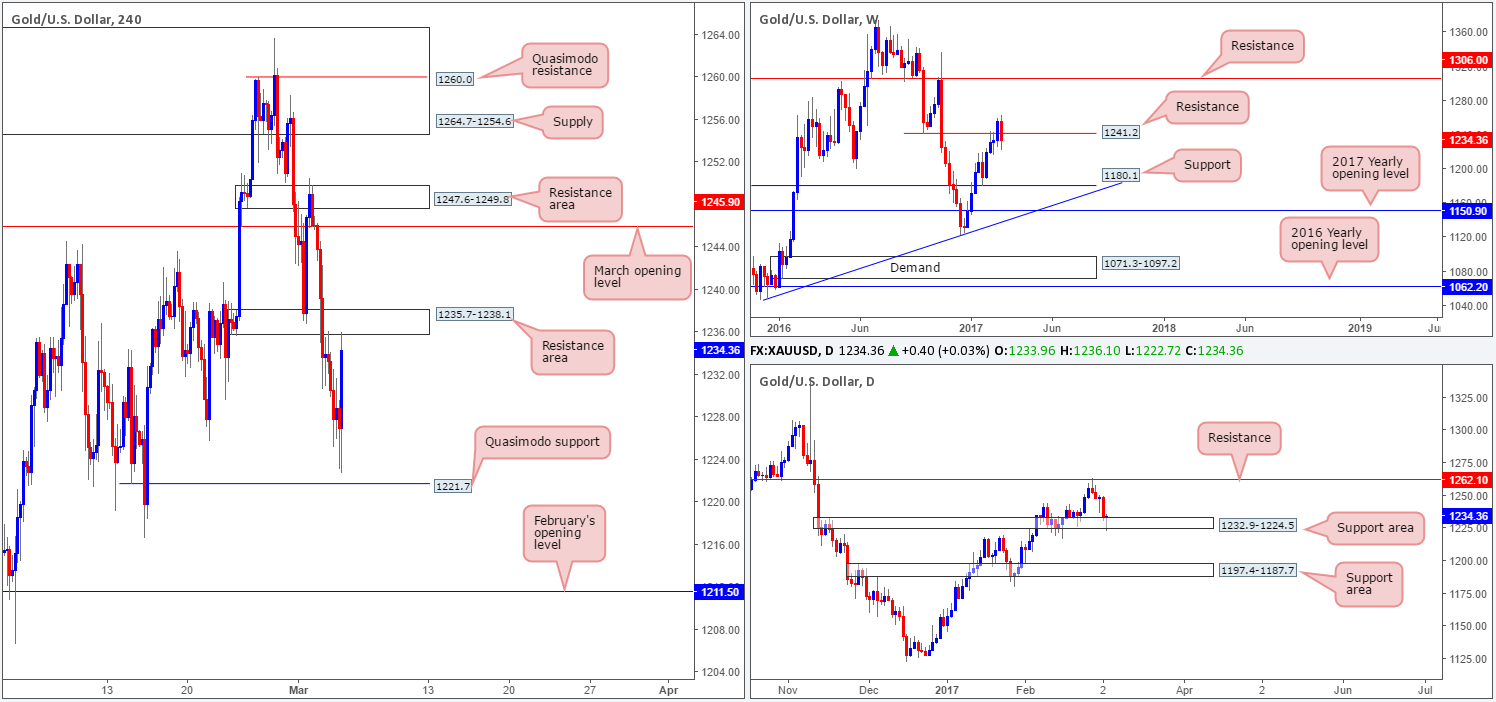
After four weeks of continuous buying the gold market took a turn for the worse last week, chalking up a beautiful-looking bearish engulfing candle! Further losses could be seen this week given that this bearish candle formation also formed around a weekly resistance barrier drawn from 1241.2. The next weekly support target on tap comes in at 1180.1: a long-term support and resistance level that stretches right back to mid-2013!
While the weekly bears look set to chase lower prices this week, the daily chart shows that Friday’s movement penciled in a daily buying tail out of a daily support area at 1232.9-1224.5. With this in mind, not only have we got two conflicting candlestick signals here, we also have two opposing structures!
Leaving the H4 Quasimodo support level at 1221.7 unchallenged, comments from the Fed Chair Janet Yellen sparked a round of buying on Friday and brought the yellow metal up to the underside of a H4 resistance zone at 1235.7-1238.1. Of course, a selloff from this area is a possibility today, given where price is positioned on the weekly timeframe at the moment. However, selling from here would involve trading against potential daily buyers! Along the same vein, a break above the current H4 resistance area may set the stage for a continuation move north to the March opening base at 1245.9. Nevertheless, in order to take advantage of this move you would need to be willing to trade against possible weekly sellers!
Our suggestions: In the absence of clearer price action, we have decided to remain flat during today’s trading.
Levels to watch/live orders:
- Buys: Flat (stop loss: N/A).
- Sells: Flat (stop loss: N/A).


