
Key risk events today:
US ISM Non-Manufacturing PMI; BoC Business Outlook Survey.
(Previous analysis as well as outside sources – italics).
EUR/USD:
Weekly gain/loss: +0.24%
Weekly close: 1.1243
Weekly perspective:
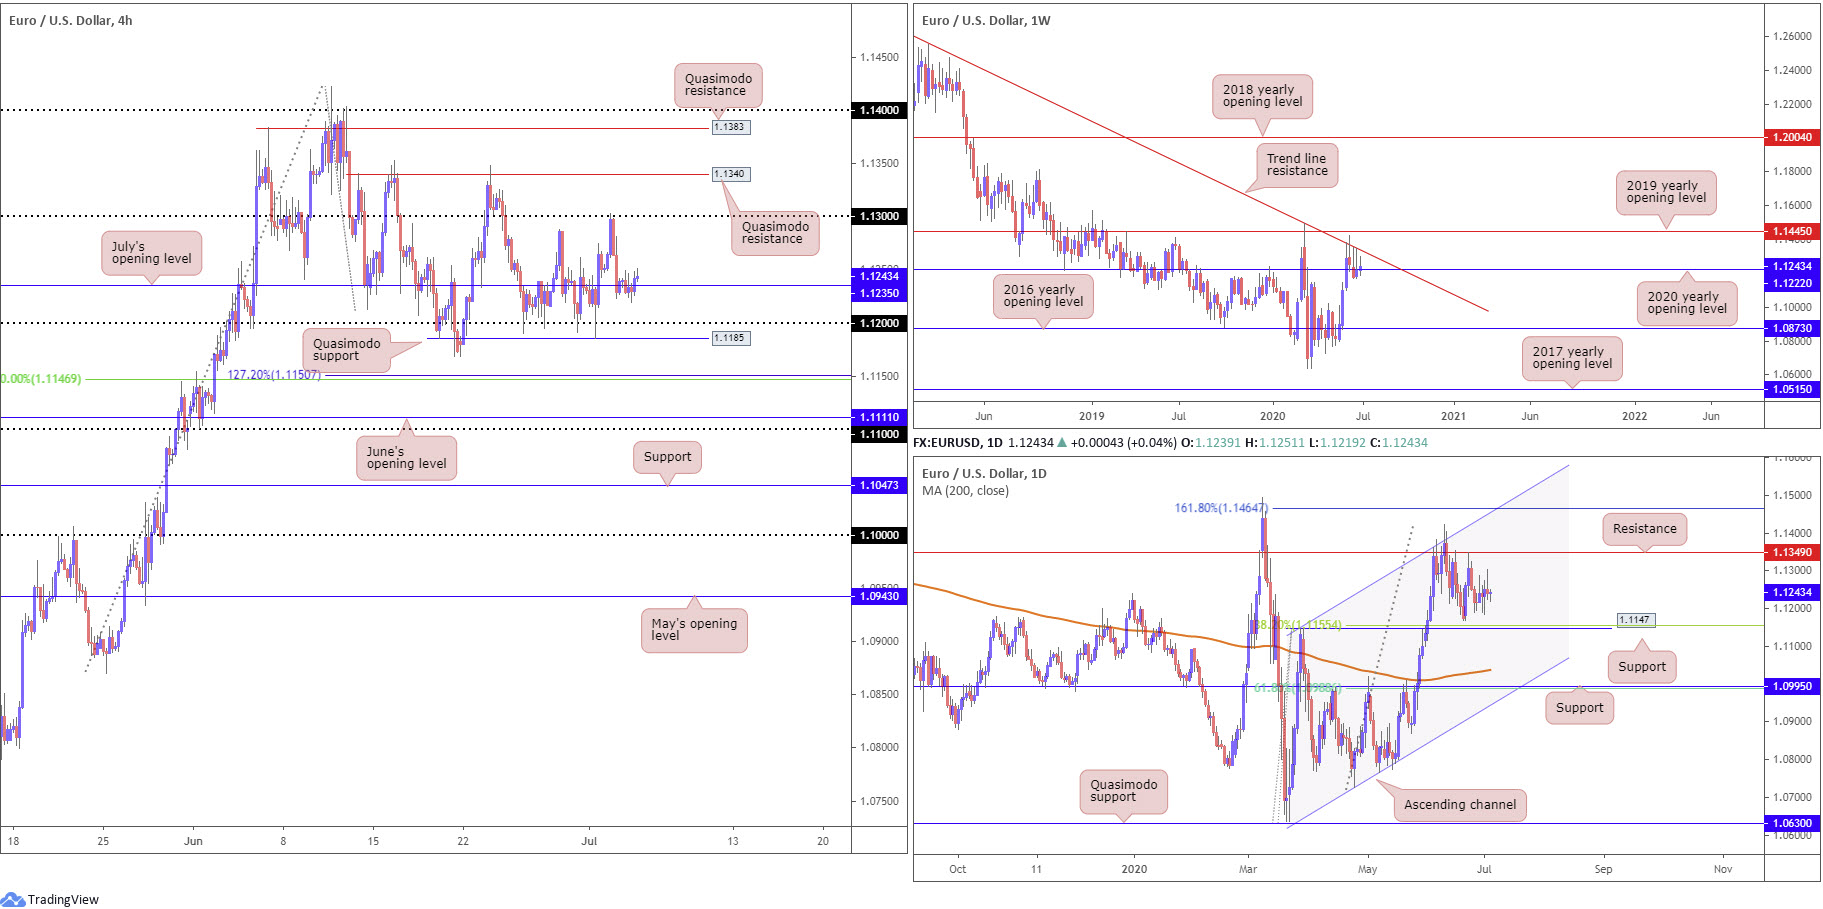
Trade on the weekly timeframe, despite numerous upside attempts, remains languishing south of long-standing trend line resistance, taken from the high 1.2555.
Consequently, the 2020 yearly opening level at 1.1222 is under fire.
Any sustained move below the aforementioned barrier this week seats the 2016 yearly opening level at 1.0873 on the hit list, while a EUR/USD bid shifts focus to the possibility of reaching the 2019 yearly opening level at 1.1445.
Daily perspective:
Since the beginning of June, channel resistance, extended from the high 1.1147, and resistance at 1.1349, has capped upside.
Support derived from the 1.1147 27 March high, therefore, could become a reality this week, a level that merges closely with a 38.2% Fibonacci retracement ratio at 1.1155.
Interestingly, breaching 1.1147 reveals the 200-day SMA (orange – 1.1037), closely followed by support at 1.0995 and a 61.8% Fibonacci retracement ratio at 1.0988.
H4 perspective:
Holiday-thinned trading conditions Friday had price action exhibit subdued movement, ranging between 1.1251/1.1219.
As a consequence, much of Friday morning’s briefing remains valid.
The aftermath of Thursday’s upbeat US employment data and declining unemployment rate witnessed the DXY hook a firm bid. This, following a retest at the underside of 1.13 (sited beneath Quasimodo resistance at 1.1340), directed EUR/USD lower, settling around July’s opening level at 1.1235.
Continued selling today may draw in 1.12 and Quasimodo support close by at 1.1185; a break, though, could have price approach a 127.2% Fibonacci extension point at 1.1150 and 50.00% retracement ratio at 1.1146.
Areas of consideration:
Clearing 1.12/1.1185 on the H4 would be interesting this week, potentially unlocking the door to healthy support.
The 127.2% Fibonacci extension point at 1.1150 and 50.00% retracement ratio at 1.1146 not only puts forward a potential H4 support area to consider this week, this base is strengthened further by daily support at 1.1147 and a 38.2% Fibonacci retracement ratio at 1.1155.
Breaching 1.13 to the upside, on the other hand, exposes H4 Quasimodo resistance at 1.1340. This level, given the test on June 23 likely consuming much of the barrier’s liquidity, is possibly brittle. Consequently, should trade establish a presence north of 1.13 this week, long positions may be favourable, targeting H4 Quasimodo resistance at 1.1383 and 1.14.
GBP/USD:
Weekly gain/loss: +1.23%
Weekly close: 1.2481
Weekly perspective:
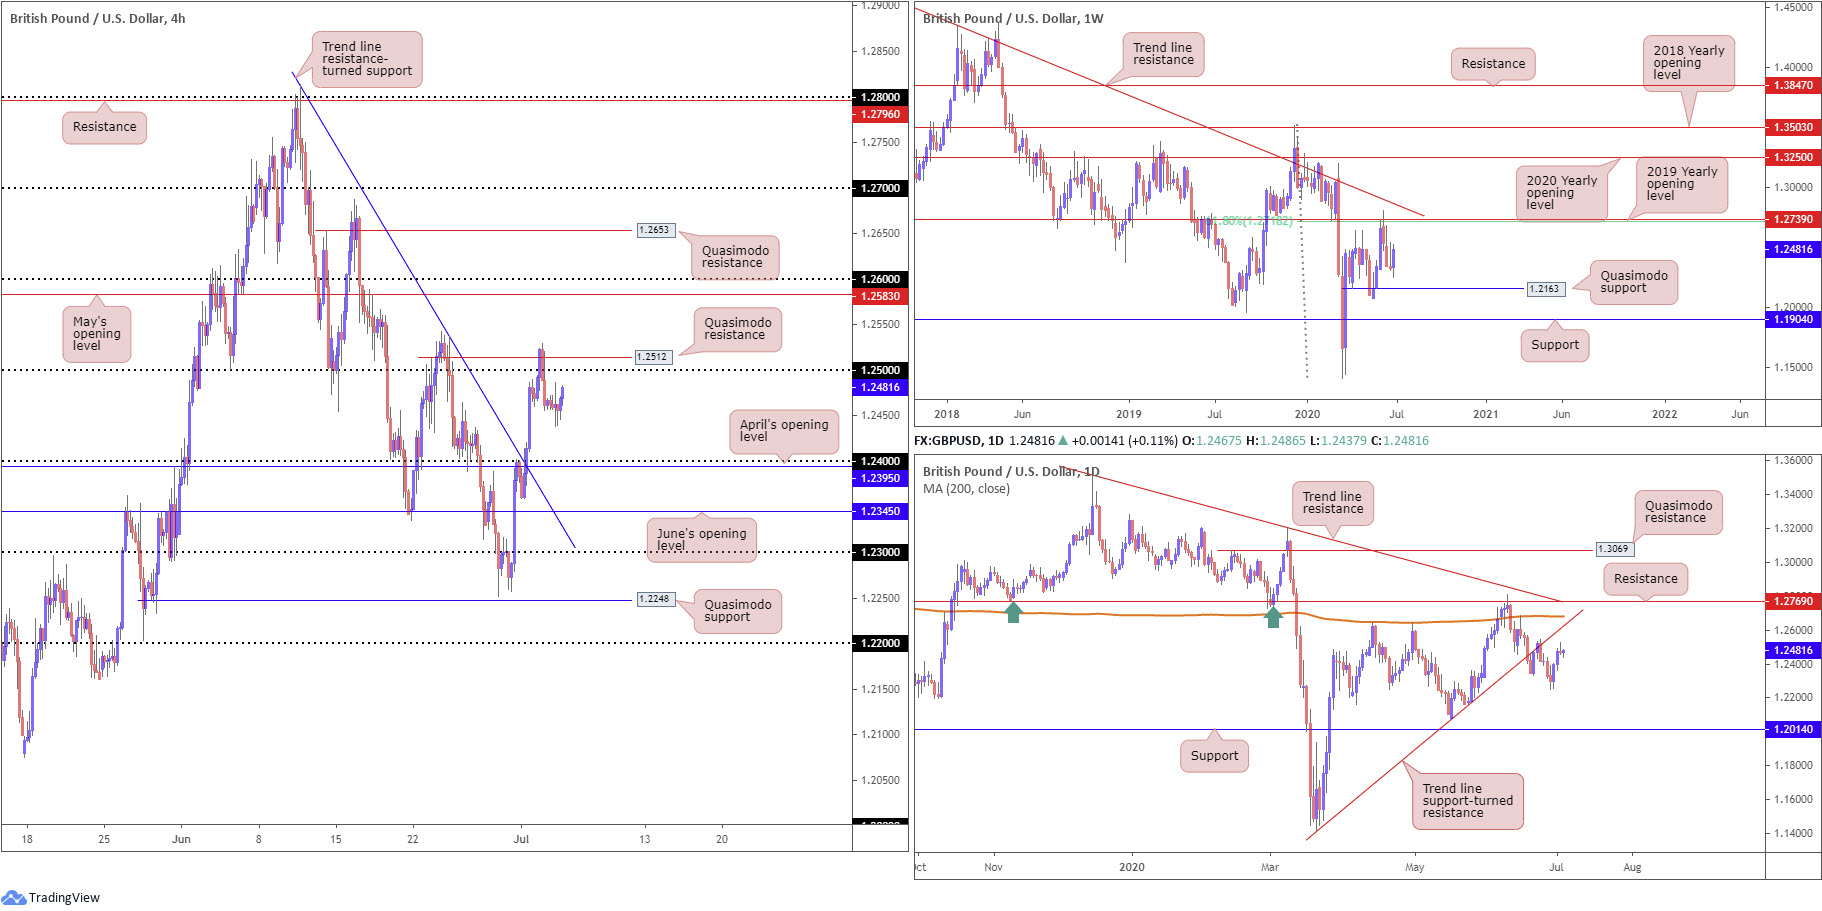
Snapping a three-week bearish phase, GBP/USD bulls went on the offensive last week and pencilled in healthy upside.
With respect to structure on this timeframe, support resides at 1.2163, a Quasimodo formation. Follow-through buying, nevertheless, may eventually see price shake hands with a 61.8% Fibonacci retracement ratio at 1.2718 and 2019 yearly opening level at 1.2739.
Daily perspective:
Price action on the daily timeframe, meanwhile, formed a shooting star candlestick pattern Thursday, yet limited follow-through selling was realised Friday.
Resistance on this scale can be found at trend line support-turned resistance, taken from the low 1.1409. In terms of support, aside from the 1.2251 June 29 low, there appears room for an approach to 1.2014, sited just south of the 1.2075 May 18 low. Before reaching this far south, nonetheless, weekly Quasimodo support must be absorbed at 1.2163.
H4 perspective:
Volatility diminished considerably Friday in observance of US bank closures. As a result of this, much of the following will echo thoughts put forward in Friday’s technical briefing.
Thursday had GBP/USD test the air above 1.25, fading nearby Quasimodo resistance at 1.2512 on the back of better-than-anticipated US jobs data. The combination of 1.25 psychological resistance and Quasimodo resistance was a noted base to watch in Thursday’s briefing – well done to any readers who managed to latch onto the move lower.
Chart studies reveal scope to explore lower levels on the H4 timeframe, shining the spotlight on 1.24 and April’s opening level at 1.2395.
In the event things turn this week and we takeover 1.25, we could be looking at May’s opening level at 1.2583/1.26 as a probable target.
Areas of consideration:
Technically, as highlighted above on the H4, there’s room to dip as far south as the 1.24 vicinity this week, no doubt a welcomed sight for those short 1.25/1.2512 resistance.
Fracturing 1.25 to the upside, on the other hand, will not only trip breakeven stops from those currently short, the move would likely appeal to breakout buyers, in pursuit of May’s opening level at 1.2583 and 1.26.
AUD/USD:
Weekly gain/loss: +1.19%
Weekly close: 0.6942
Weekly perspective:
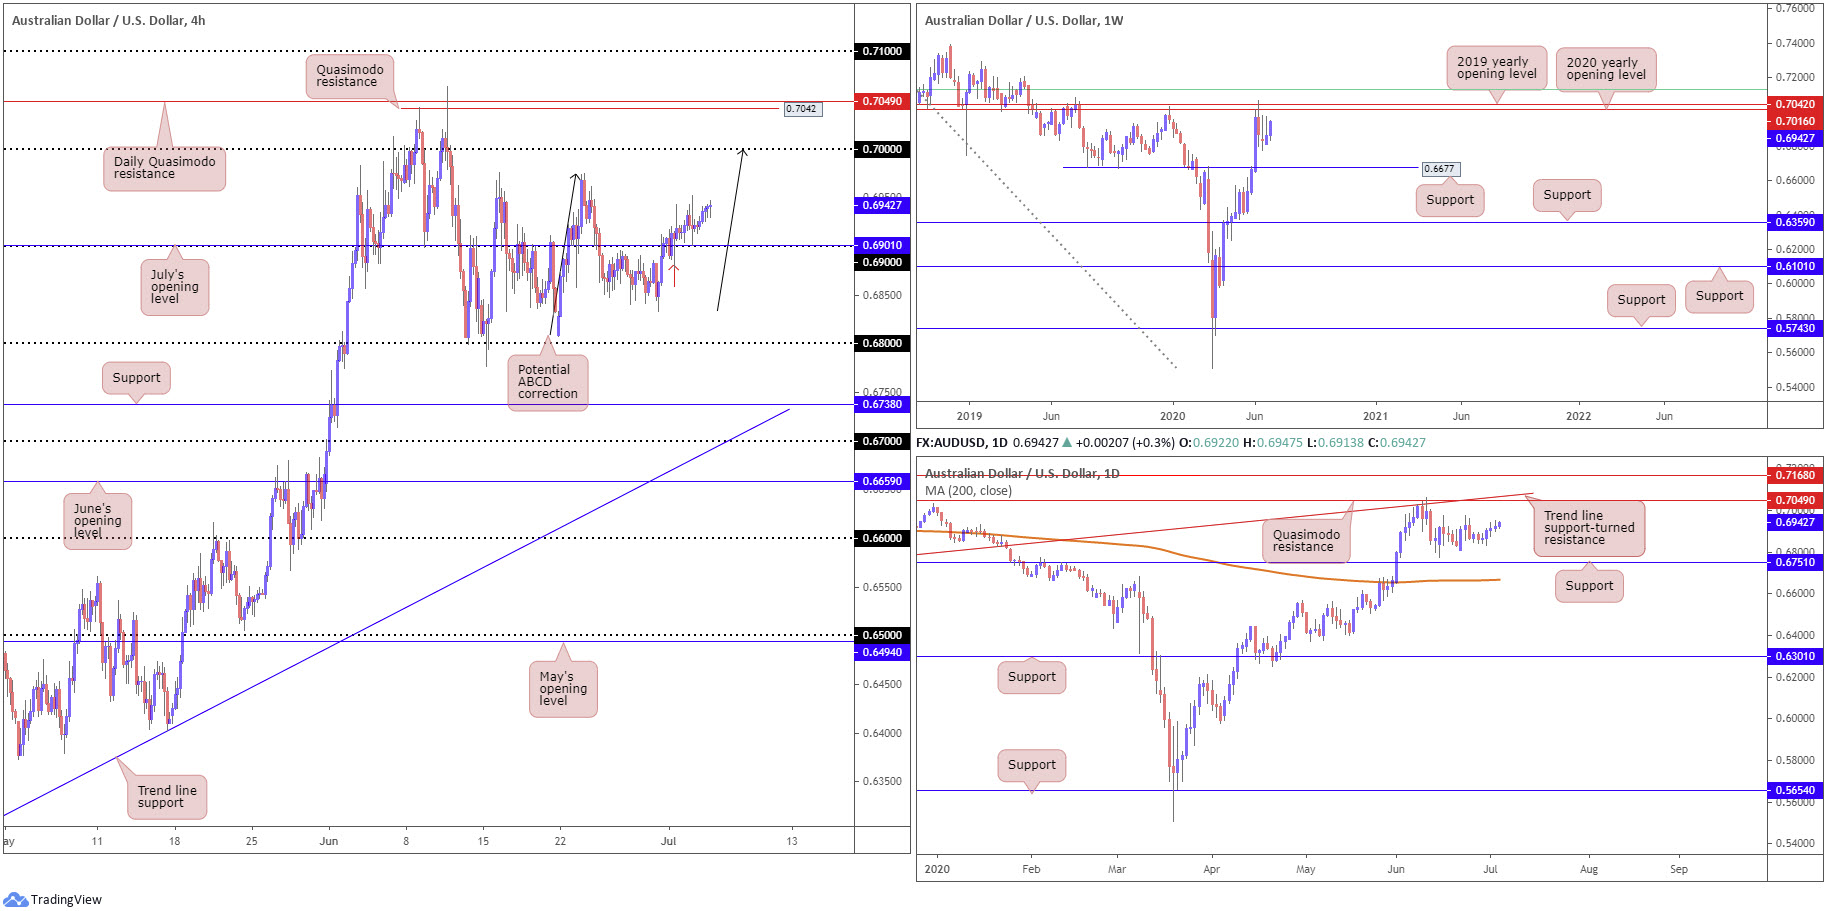
Buyers strengthened their grip considerably last week, extending the prior week’s cautious recovery.
Resistance, forged in the shape of a 2020 yearly opening level and a 2019 yearly opening level, at 0.7016 and 0.7042, respectively, continues to offer a central presence nearby. It might also interest traders to note just above the said resistances we have a 61.8% Fibonacci retracement ratio at 0.7128 (green).
In terms of support, crosshairs remain fixed on 0.6677.
Daily perspective:
From the daily timeframe, despite five, albeit mild, consecutive bullish sessions, we remain wandering no man’s land.
Quasimodo resistance at 0.7049 is in sight on this scale, merging closely with trend line support-turned resistance, taken from the low 0.6670. Attention on this timeframe also remains at support coming in from 0.6751. Interestingly, lurking beneath here we also have the 200-day SMA (orange – 0.6668), located close by weekly support mentioned above at 0.6677.
H4 perspective:
The Australian dollar concluded a shade higher against the US dollar Friday, but failed to penetrate Thursday’s high at 0.6952 amidst holiday-thinned sentiment.
In spite of Friday’s lacklustre performance, buyer intent north of the 0.69 handle is visible. This shifts focus to the 0.6976 peaks, as well as the key figure 0.70 and a converging ABCD pattern (black arrows).
Areas of consideration:
With H4 candles establishing a position above 0.69 this has driven interest to higher levels so far.
Breakout buyers already long, are likely to have protective stop-loss orders tucked under the 0.6877 low (red arrow). Conservative traders, though, may have entered on Thursday’s dip to 0.6901 (near-retest at 0.69), also likely slipping protective stop-loss orders under 0.6877.
Regardless of the entry technique, as underlined in previous analysis, H4 upside targets this week rest at 0.6976 and 0.70.
USD/JPY:
Weekly gain/loss: +0.27%
Weekly close: 107.48
Weekly perspective:
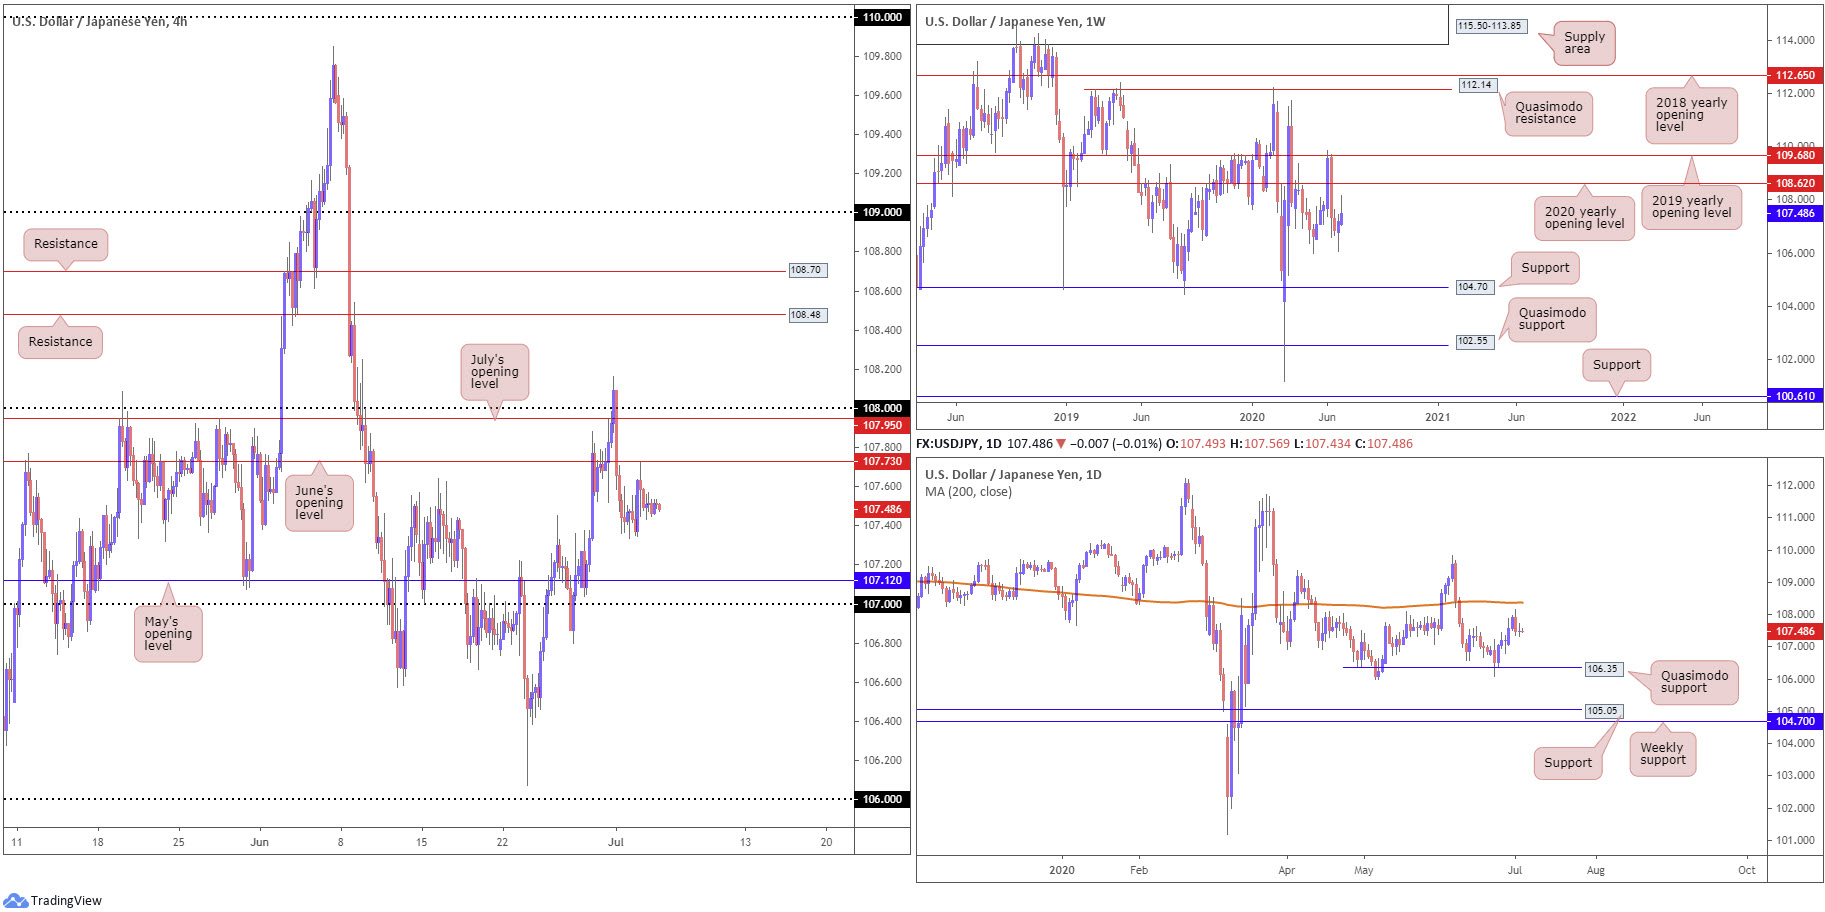
The US dollar extended gains against the Japanese yen over the course of the week, but wrapped up considerably off best levels.
Resistance rests reasonably close by in the shape of the 2020 yearly opening level at 108.62, followed by the 2019 yearly opening level at 109.68. Support remains fixed around the 105.98 6th May low, with a break here uncovering long-term support at 104.70.
Daily perspective:
Mid-week pencilled in a top a few pips shy of the 200-day SMA (orange – 108.37), shaped by way of a bearish outside day. While the lack of volatility likely had many traders shy away from executing short positions, the recent top (and candle formation) still draws attention back to Quasimodo support at 106.35 this week, the origin of the recent leg higher.
H4 perspective:
Friday’s movement was almost non-existent, sporting a paltry 15-pip range between 107.56/107.43 due to US banks closing in observance of Independence Day. With that being the case, much of the following offers a similar view to Friday’s technical briefing.
Thursday, lifted on upbeat jobs data, witnessed price movement test waters just ahead of June’s opening level at 107.73. The latter was a watched resistance in Thursday’s briefing, with downside on the H4 scale exhibiting scope to approach May’s opening level at 107.12 as well as the 107 handle.
Areas of consideration:
Sellers south of 107.73, given the recent daily bearish outside day, may take aim at 107.12/107 this week, offering reasonable risk/reward.
In the event we make a run for July’s opening level at 107.95 and 108 this week, however, a fakeout scenario could be on the cards as directly above the round number sits the 200-day SMA at 108.37. A fakeout scenario is simply a whipsaw through 108, followed by a test of 108.37 and a H4 close back beneath 108 to setup a bearish theme.
USD/CAD:
Weekly gain/loss: -1.00%
Weekly close: 1.3545
Weekly perspective:
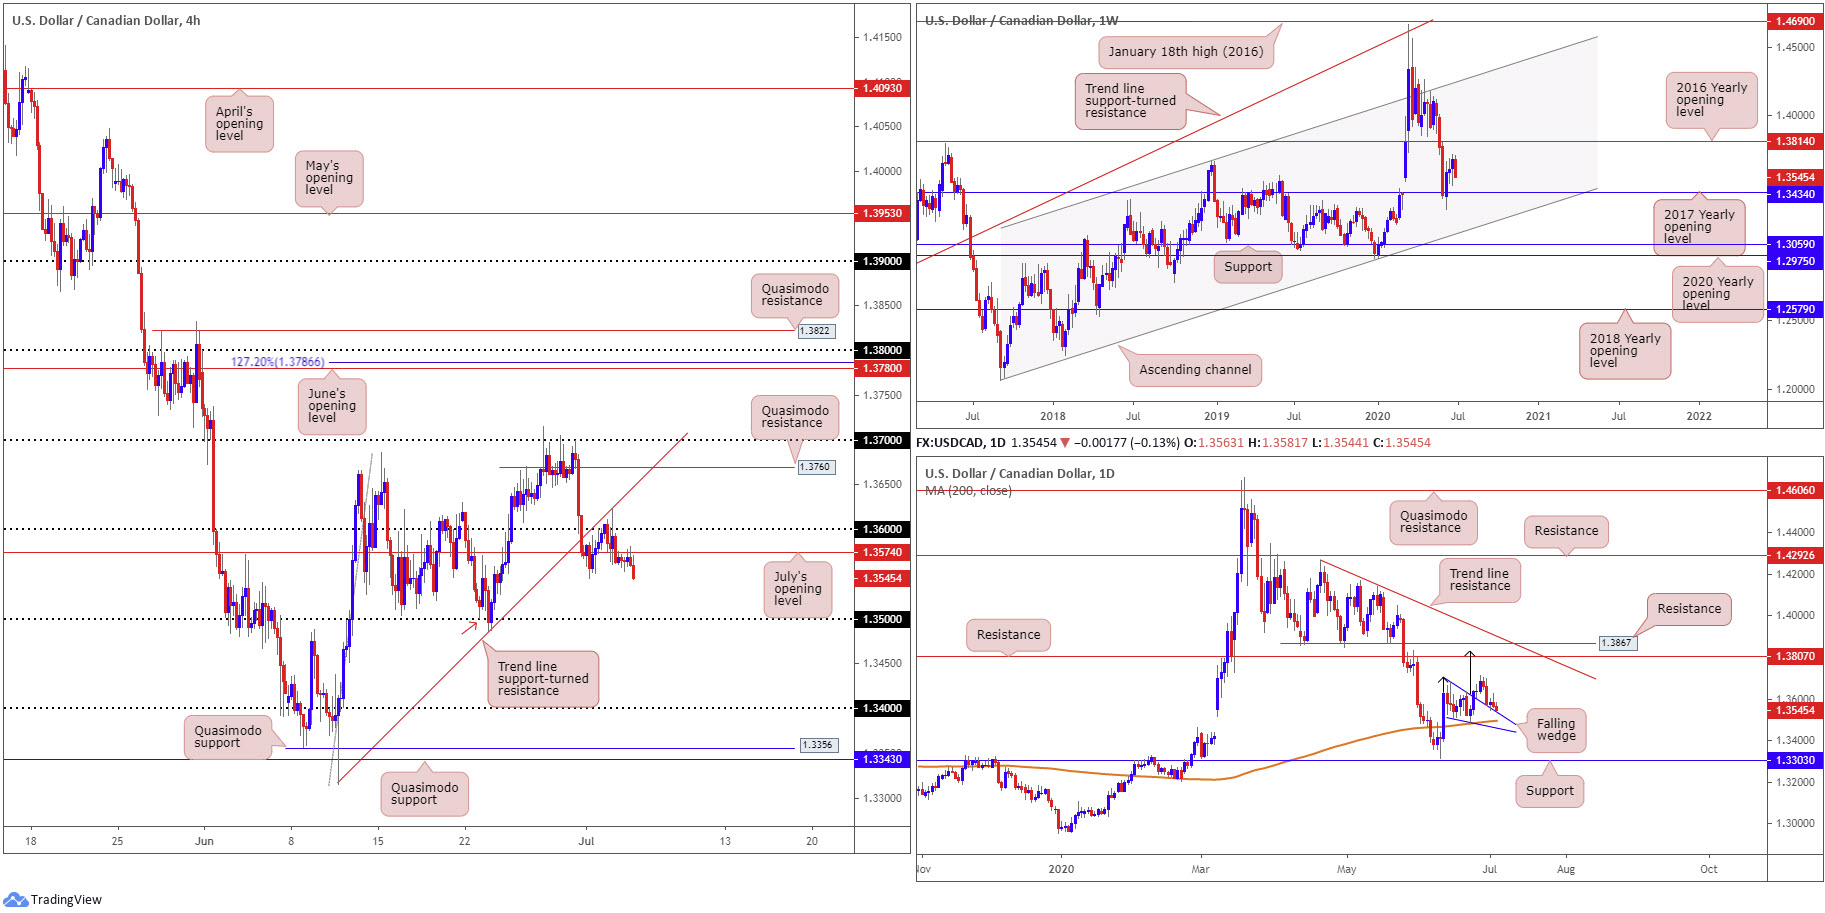
Dipping approximately 140 pips on the week, USD/CAD firmly snapped three consecutive weeks of upside.
This positions the 2017 yearly opening level at 1.3434 in the firing range this week. Beyond 1.3434, channel support, taken from the low 1.2061, can be seen as the next potential floor. Whereas a USD/CAD bid throws the 2016 yearly opening level at 1.3814 in the pot as feasible resistance, with follow-through buying likely to try and tackle a dense block of supply between 1.4190/1.3912.
Daily perspective:
Mid-week had price movement retest the top edge of a breached falling wedge pattern as support (1.3686/1.3504) – so far sellers have outweighed buyers. Interestingly, though, the 200-day SMA (1.3495), seen closing in on the level, may lend a helping hand here this week, in terms of additional support.
Take-profit targets out of a falling wedge pattern can be measured by taking the base value and adding this figure to the breakout point (black arrows), which as you can see in this case, converges closely with the next daily resistance at 1.3807, followed closely by another layer of resistance at 1.3867.
H4 perspective:
After Thursday mildly whipsawed 1.36 to the upside and crossed swords with trend line support-turned resistance, taken from the low 1.3315, and Friday found resistance at July’s opening level drawn from 1.3574, the pair has since emphasised a modestly bearish bias and tested waters south of the 1.3550ish region.
An extension to the downside this week shifts attention to the 1.35 handle, which happens to also offer Quasimodo support (red arrow – left shoulder).
Areas of consideration:
Usually the higher timeframes (daily structure) take precedence over lower-timeframe levels (H4 structure).
Yet, the H4 close below 1.3550 has perhaps sealed the deal for a run to 1.35 early week. As a result, intraday sellers may try their hand and sell short here today.
1.35 is an interesting support. Not only does the number represent a downside target for those short, it also signifies confluent support, joined closely with the 200-day SMA at 1.3495 and the top edge of the daily wedge formation.
USD/CHF:
Weekly gain/loss: -0.40%
Weekly close: 0.9442
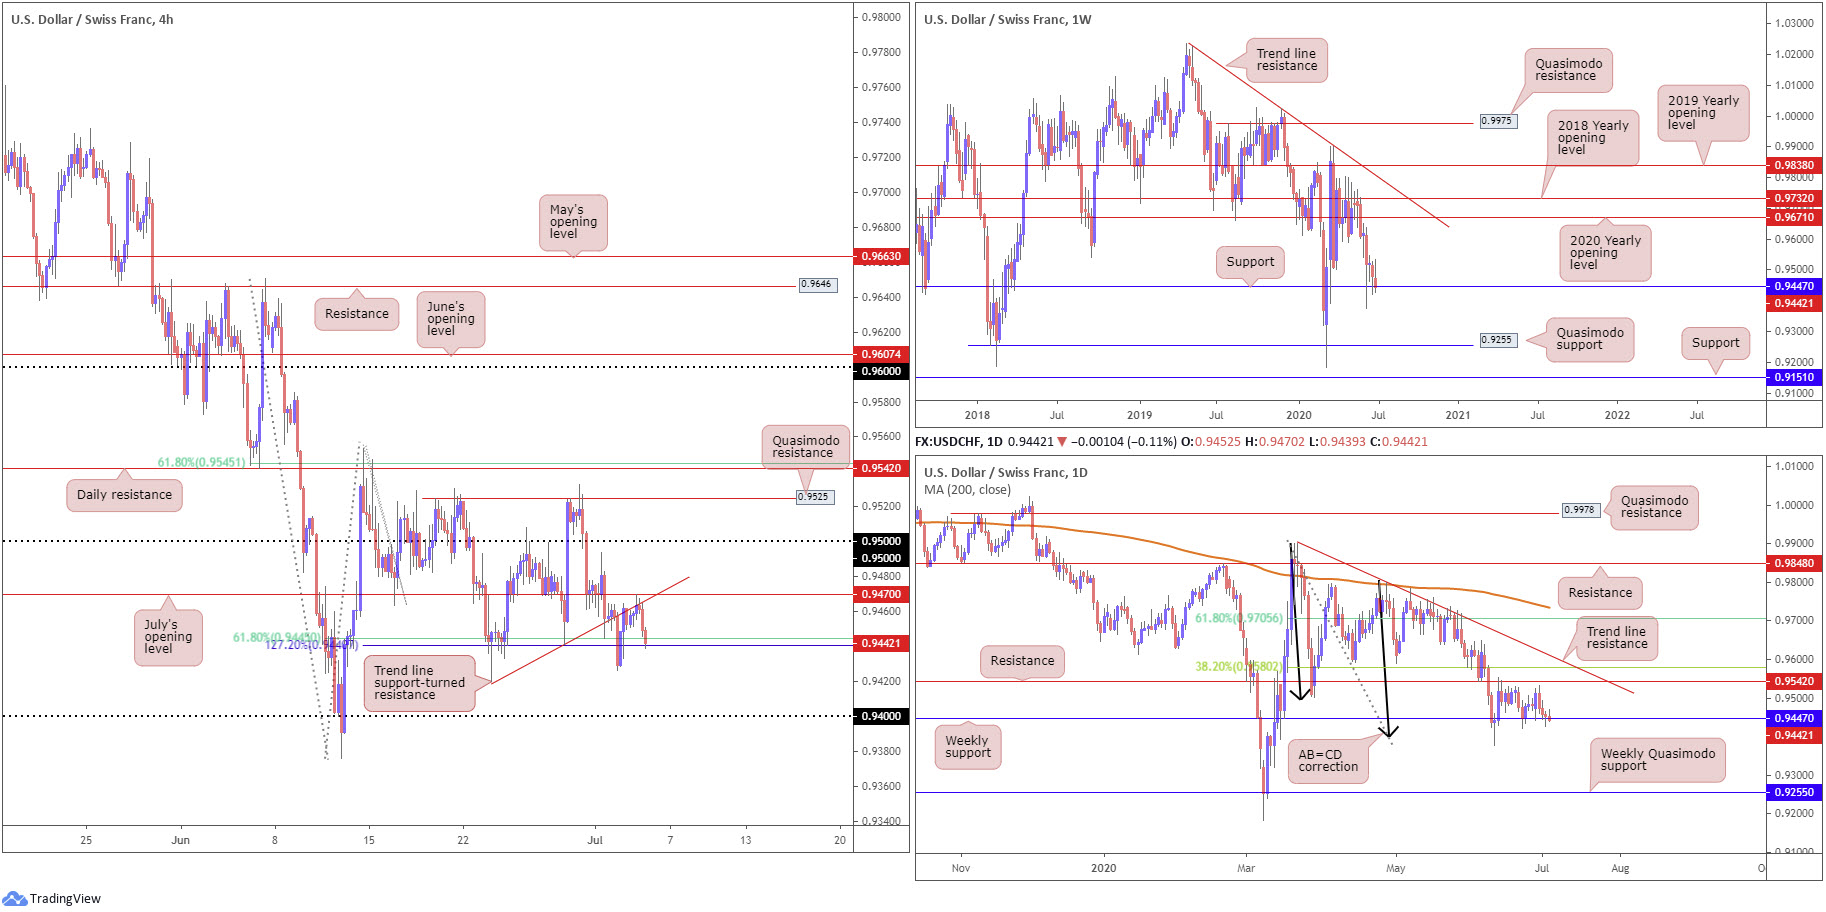
Weekly perspective:
Support at 0.9447 remains in motion, but is hanging on by a thread. The lack of enthusiasm led to a minor close south of the aforementioned level last week. Whether this is enough to deter buyers here is difficult to determine.
A recovery has the 2020 yearly opening level at 0.9671 marked as the next resistance target, stationed close by the 2018 yearly opening level at 0.9732. Exploring lower levels this week, nevertheless, could have the unit eventually knock on the door of Quasimodo support at 0.9255.
Daily perspective:
The initial break of weekly support at 0.9447 (11 June) on the daily timeframe threw breakout sellers into a bear trap as daily buyers vigorously defended AB=CD structure (black arrows) at 0.9395. The initial upside target out of the daily AB=CD pattern, traditionally speaking, can be found at the 38.2% Fibonacci retracement ratio at 0.9580 (derived from legs A-D). This is positioned above resistance at 0.9542, which, as you can see, has so far done a superb job in holding back buyers.
In the event we overrun 0.9542 and also 0.9580 we could, according to traditional measures, cross swords with the next AB=CD target at 0.9705, the 61.8% Fibonacci retracement ratio, also taken from legs A-D. This implies a push above trend line resistance, taken from the high 0.9901.
H4 perspective:
Although bolstered by weekly support at 0.9447, Fibonacci support on the H4 timeframe, the 61.8% Fibonacci retracement ratio at 0.9445 and 127.2% Fibonacci extension point at 0.9440, finished Friday under pressure. Note trend line support-turned resistance, extended from the low 0.9420, and July’s opening level at 0.9470 capped upside attempts Friday.
Territory south of the aforementioned Fibonacci structure has the pendulum swinging towards 0.94 as the next downside objective.
Areas of consideration:
Should buyers regain consciousness off weekly support at 0.9447 this week, and by extension, the H4 Fibonacci structure at 0.9445/0.9440, buyers will likely seek a H4 close above July’s opening level at 0.9470 before pulling the trigger, targeting 0.95 as an initial take-profit zone.
Continued downside this week, a sustained move under 0.9445/0.9440, could re-open the door for bearish scenarios to 0.94 as an initial target. Owing to the recent fakeouts seen through 0.9445/0.9440, conservative traders are unlikely to commit unless the latter is retested as resistance, preferably in the shape of a H4 bearish candlestick pattern.
Dow Jones Industrial Average:
Weekly gain/loss: +2.86%
Weekly close: 25751
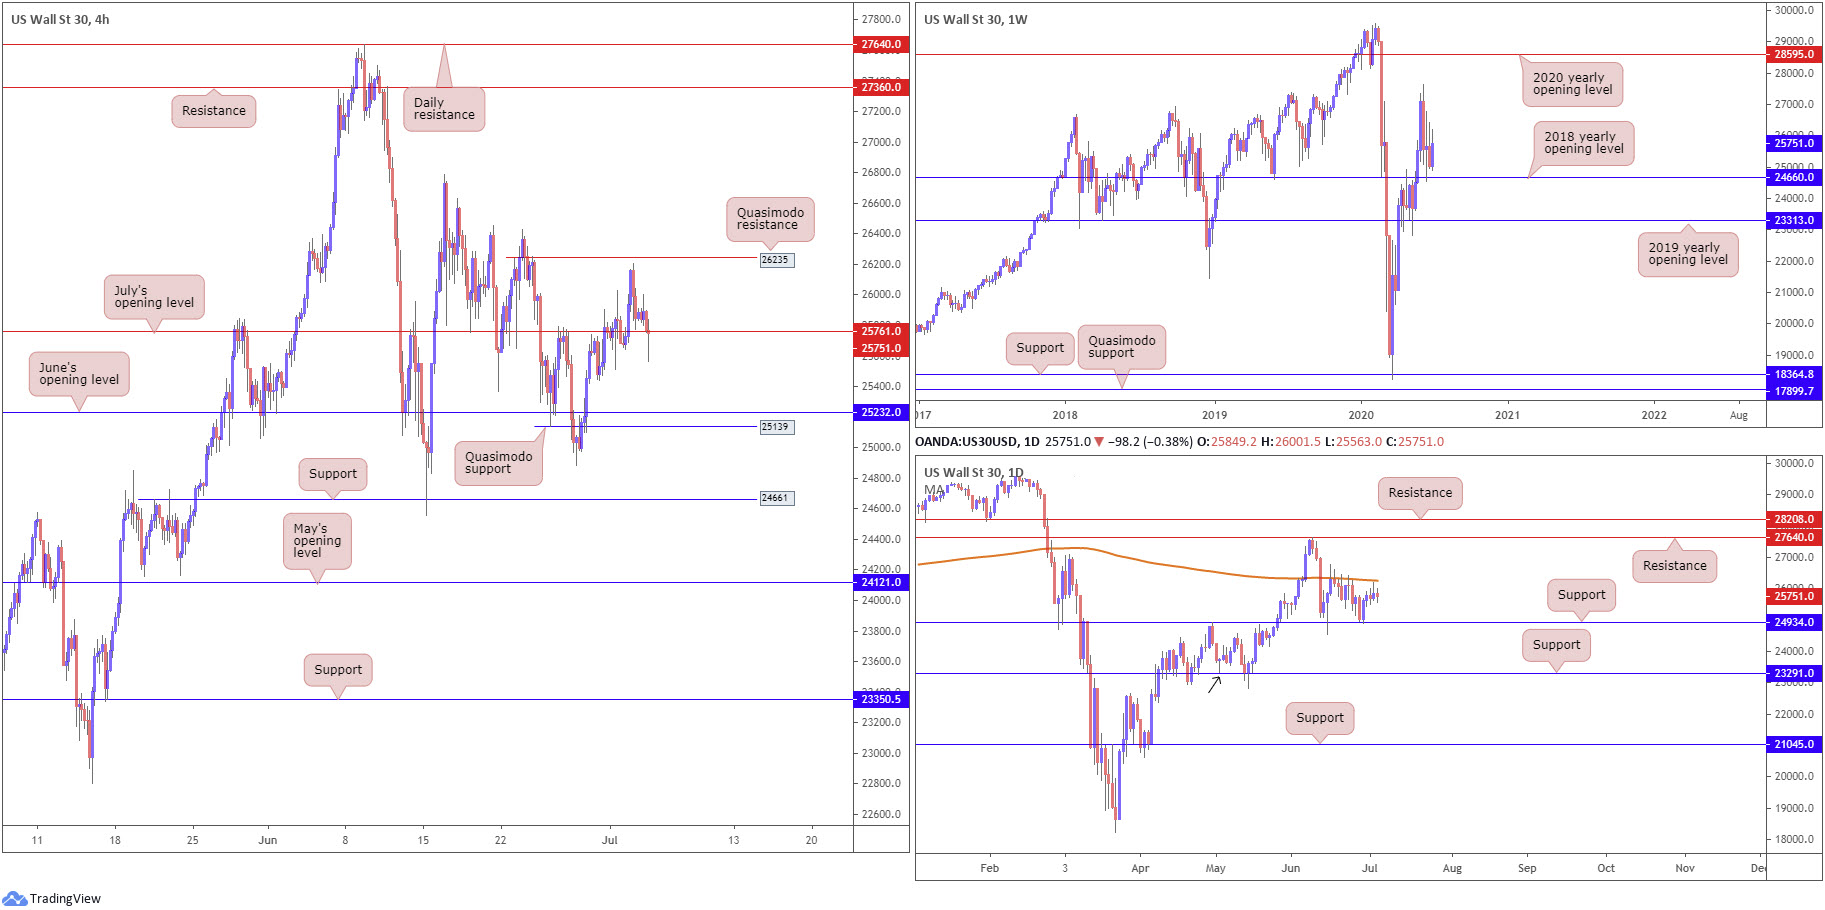
Weekly perspective:
Buyers elbowed their way into the spotlight last week, establishing firm position.
The 2018 yearly opening level at 24660 remains an important base of support on the weekly timeframe. In the event buyers manage to keep their head above water here this week, we might pull in the 27638 high, followed by the 2020 yearly opening level at 28595. Yet, below 24660, traders’ crosshairs will be fixed on the 2019 yearly opening level at 23313.
Daily perspective:
Since June 15, price action on the daily timeframe has been ranging between the 200-day SMA (orange – 26263) and support from 24934.
Areas of note outside of the aforementioned range fall in at resistance from 27640, with support plotted at 23291, a level that also signifies a Quasimodo formation (black arrow).
H4 perspective:
Major US equity benchmarks cheered a record surge in payrolls Thursday, as investors headed into the three-day weekend. The Dow Jones Industrial Average rallied 92.39 points, or 0.36%; the S&P 500 advanced 14.15 points, or 0.45%, and the tech-heavy Nasdaq 100 concluded higher by 62.64 points, or 0.61%.
Despite leaving Quasimodo resistance unchallenged at 26235, Thursday finished quite a way off best levels, with Friday putting forward a modestly bearish tone that saw July’s opening level at 25761 welcome price action into the close. South of the latter, traders will be looking towards June’s opening level at 25232, closely tailed by Quasimodo support at 25139.
Areas of consideration:
In terms of the weekly timeframe, buyers appear poised to climb further this week. Still, buyers on the H4 and daily timeframes are unlikely to commit until H4 Quasimodo resistance at 26235 and the 200-day SMA (26263) are taken out. As a result, a decisive H4 close above 26235 could be something to keep an eye out for going forward.
Alternatively, traders who have confidence in the weekly timeframe’s position, bullish scenarios off July’s opening level at 25761 could be an option.
XAU/USD (GOLD):
Weekly gain/loss: +0.20%
Weekly close: 1775.0
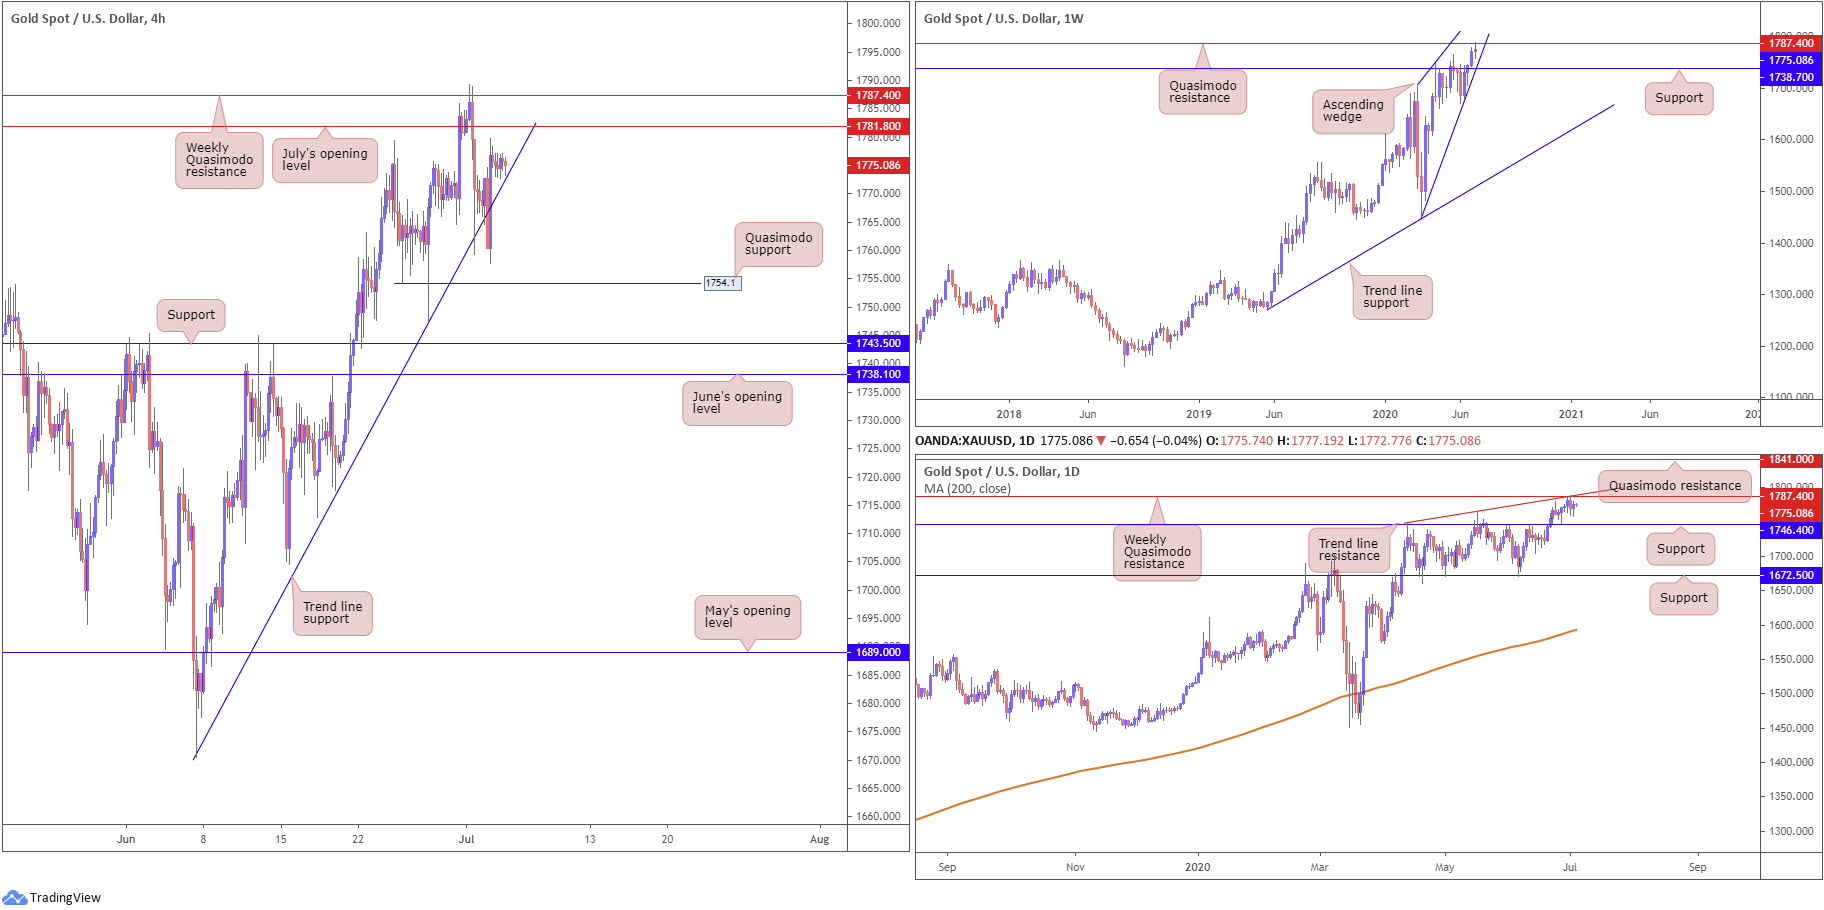
Weekly perspective:
Over the course of last week, traders observed price grip Quasimodo resistance at 1787.4. Also of interest on the weekly timeframe is a potential ascending wedge pattern forming between 1451.4/1703.6, perhaps serving as a reversal pattern in the coming weeks. A move lower would also see buyers and sellers go toe-to-toe at support coming in from 1738.7.
Breaking 1787.4, as the underlying trend suggests (trending higher since 2016), potentially lays the foundation for continuation buying to resistance stationed at 1882.7.
Daily perspective:
Weekly Quasimodo resistance at 1787.4 also remains central resistance on the daily timeframe for the time being. Daily action, nevertheless, throws across additional structure in the form of a trend line resistance, taken from the high 1747.7.
Support on the daily scale can be found at 1746.4, whereas a breach of 1787.4 will throw a daily Quasimodo formation at 1841.0 in the pot as potential resistance.
H4 perspective:
Despite a number of downside attempts, trend line support, extended from the low 1679.2, survived Thursday and remained afloat Friday amid holiday-thinned trade.
In last week’s analysis, the research team highlighted the possibility of XAU/USD fading weekly Quasimodo resistance at 1787.4, which, as you can see, came to fruition. Should sellers seize control this week and conquer the aforementioned H4 trend line support, this serves as a sign we may be headed for Quasimodo support at 1754.1, followed by daily support at 1746.4. Do bear in mind, the pair has been trading northbound since 2016, therefore shorts are effectively countertrend positions.
Areas of consideration:
Traders short the current weekly Quasimodo resistance level, as underlined in Thursday’s writing, likely reduced risk to breakeven at H4 trend line support and maybe even banked a portion of profits.
A break of H4 trend line support this week not only clears the way for current sellers towards the aforementioned H4 supports emphasised above, it also unlocks the possibility of fresh breakout setups.
Conquering weekly Quasimodo resistance at 1787.4, nonetheless, could pin open the door for bullish themes this week. A H4 close above 1787.4 that’s preferably followed up with a retest might be sufficient to lure buyers into the fold. The reason for the retest, rather than simply entering long on the breakout candle’s close, is simply to help avoid getting caught on a fakeout.
The accuracy, completeness and timeliness of the information contained on this site cannot be guaranteed. IC Markets does not warranty, guarantee or make any representations, or assume any liability regarding financial results based on the use of the information in the site.
News, views, opinions, recommendations and other information obtained from sources outside of www.icmarkets.com.au, used in this site are believed to be reliable, but we cannot guarantee their accuracy or completeness. All such information is subject to change at any time without notice. IC Markets assumes no responsibility for the content of any linked site.
The fact that such links may exist does not indicate approval or endorsement of any material contained on any linked site. IC Markets is not liable for any harm caused by the transmission, through accessing the services or information on this site, of a computer virus, or other computer code or programming device that might be used to access, delete, damage, disable, disrupt or otherwise impede in any manner, the operation of the site or of any user’s software, hardware, data or property.


