
Key risk events today:
Limited.
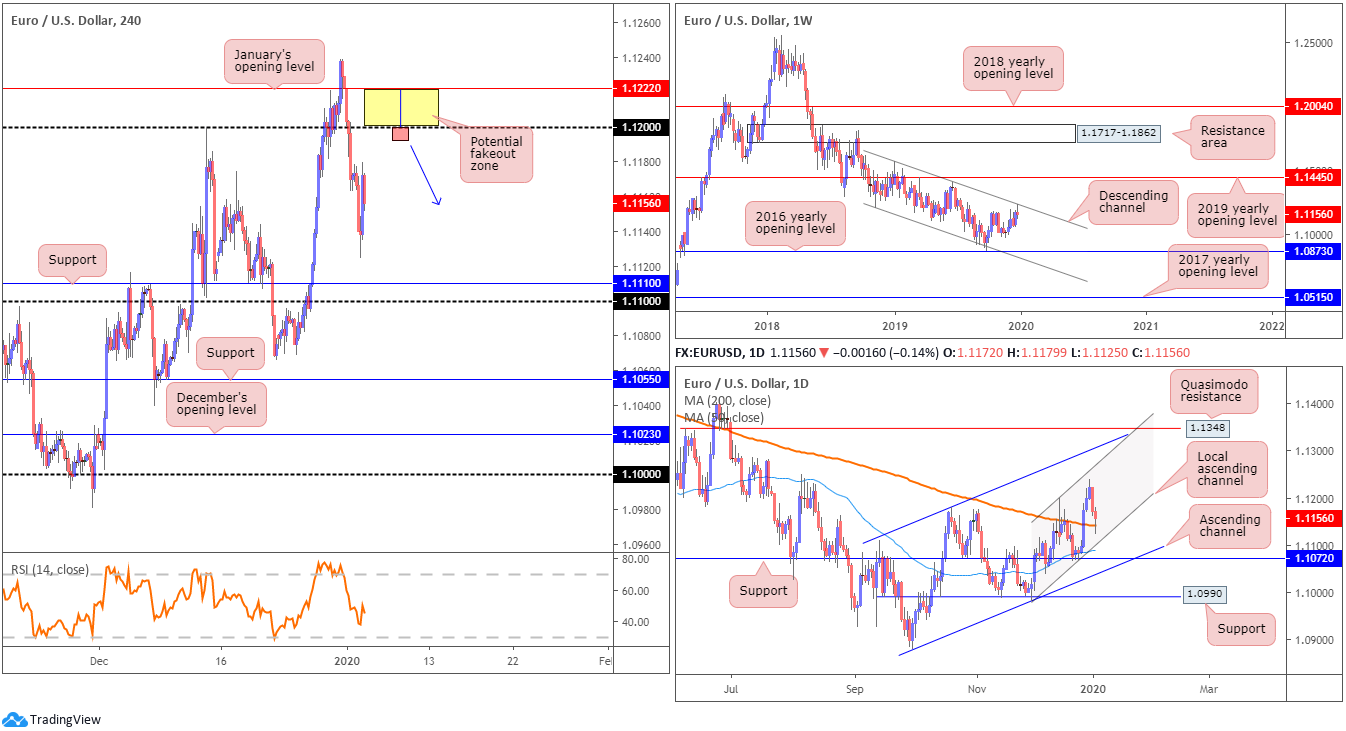
EUR/USD:
Weekly gain/loss: -0.16%
Weekly close: 1.1156
Weekly perspective:
Europe’s shared currency finished the week a shade lower against the buck, erasing a portion of the prior week’s gains.
Technical research has weekly movement testing channel resistance, extended from the high 1.1569. Noticeable downside objectives fall in around the 2016 yearly opening level at 1.0873 and channel support, taken from the low 1.1109. A break higher, on the other hand, has the 2019 yearly opening level to target at 1.1445.
Overall, according to the weekly timeframe, the primary downtrend has remained south since early 2018.
Daily perspective:
After challenging monthly highs at 1.1293 Wednesday, EUR/USD shifted lower and concluded the week revisiting the 200-day SMA (orange – 1.1141), positioned a few points north of the 50-day SMA (blue – 1.1088).
We also remain compressing within a local (reasonably small) ascending channel configuration (1.0981/1.1199), formed inside a larger ascending channel formation taken from 1.0879/1.1179. In terms of support/resistance on this scale, Quasimodo resistance plotted at 1.1348 is in view, as is nearby support at 1.1072 (boasts an incredibly strong history since early August 2019) and another layer of support coming in at 1.0990.
H4 perspective:
A closer reading of price action on the H4 timeframe has the candles between the 1.12/1.11 handles, with support hovering just north of 1.11 at 1.1110. Also of interest is January’s opening level, hovering above 1.12 at 1.1222.
Concerning Friday’s data, the US December PMI registered 47.2 percent, a decrease of 0.9 percentage points from the November reading of 48.1 percent. This is the PMI’s lowest reading since June 2009, when it registered 46.3 percent, according to the Institute for Supply Management.
The minutes from the FOMC December 10-11 meeting showed some policymakers raised concerns that low rates for a long time may exacerbate imbalances in the financial sector. All in all, the Fed’s document contained little surprise, having limited impact across financial markets.
Areas of consideration:
As weekly price tests channel resistance, long-term sellers may look to make an appearance this week, potentially overthrowing the current 200-day SMA on the daily timeframe. A possible scenario, therefore, may be a ‘run of stops’ (a fakeout) through 1.12 to 1.1222 on the H4 timeframe. A decisive close beneath 1.12 from 1.1222 could be considered a healthy sell signal, knowing we have local buy stops above 1.12 acting as liquidity to sell into, along with weekly sellers potentially looking to explore lower ground. A move lower from 1.12 may target the noted local daily channel support as the initial port of call, followed by the 1.11 handle on the H4 timeframe.
A fakeout formed by way of a H4 bearish candlestick configuration is also something worth watching out for at 1.12, a shooting star candlestick pattern, for example (see chart for a visual).
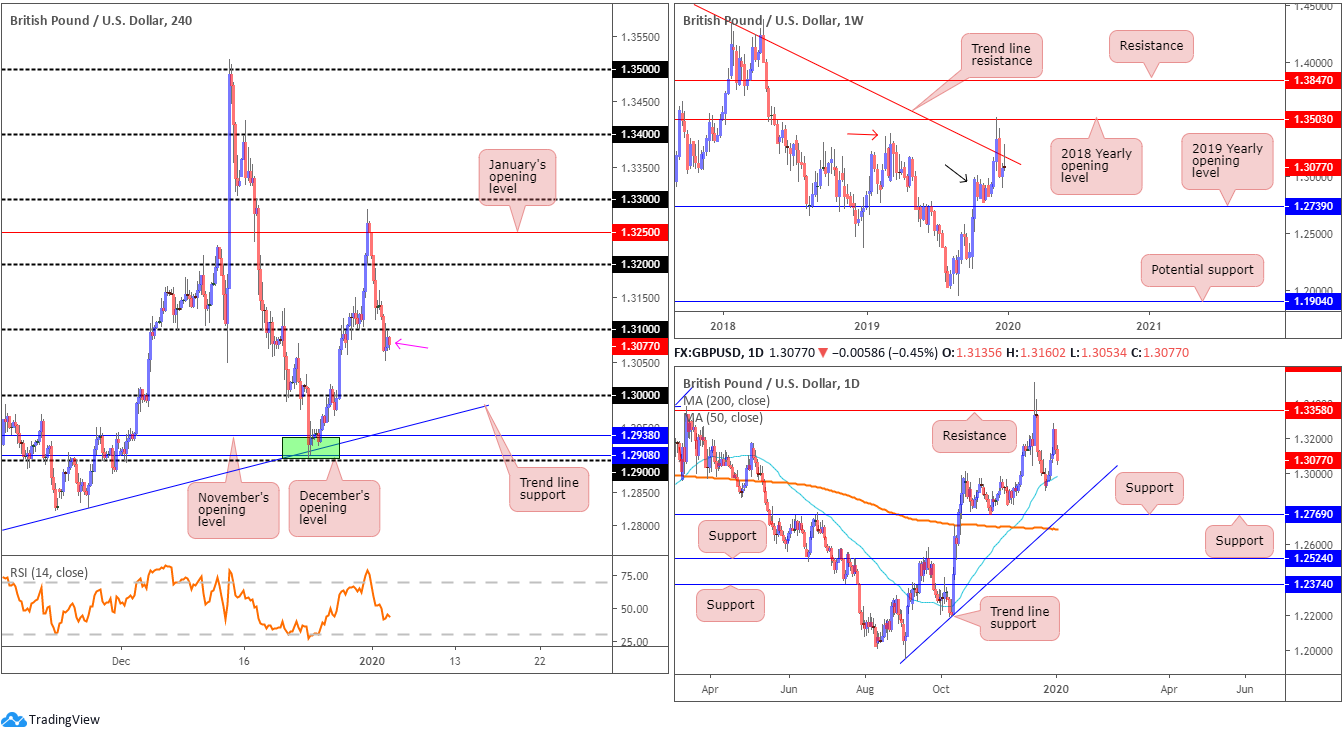
GBP/USD:
Weekly gain/loss: +0.02%
Weekly close: 1.3077
Weekly perspective:
Sellers strengthened their grip off the 2018 yearly opening level drawn from 1.3503 three weeks back. Price also recently reclaimed long-standing trend line resistance, pencilled in from the high 1.5930, and retested the descending level in the shape of a shooting star candlestick pattern.
Buyers are attempting to defend nearby demand around the 1.2939 region (black arrow), seduced by the recent break of the notable high at 1.3380 (red arrow). The fact we’re holding the current trend line, though, implies we might see a push lower to the 2019 yearly opening level at 1.2739, consequently tripping sell stops from any traders long the aforementioned demand zone.
Daily perspective:
The 50-day SMA (blue – 1.2982) remains reasonably dominant support on this timeframe. Another layer of support to keep an eye on this week, though, is 1.2769, which happens to merge closely with trend line support, pencilled in from the low 1.1958 and the 200-day SMA (orange – 1.2687). With respect to resistance, the only level of interest right now sits at 1.3358, capping upside since mid-June 2019.
H4 perspective:
GBP/USD witnessed follow-through selling for a second consecutive session Friday, falling to the lower end of its weekly trading range amid softer UK Construction PMI. According to Markit, December’s data pointed to another sharp reduction in construction output, with a downturn persisting across all three broad categories of activity. Survey respondents attributed the latest drop in their workloads to political uncertainty and subdued client demand ahead of the general election. At 44.4 in December, down from 45.3 in November, the headline seasonally adjusted IHS Markit/CIPS UK Construction Total Activity Index registered below the crucial 50.0 no-change value for the eighth consecutive month.
1.31, as evident from the chart, ceded ground and withstood any upside attempt into the close. The next port of call to the downside, boasting notable history, is visible around the key figure 1.30.
Areas of consideration:
Having seen weekly price reject trend line resistance and form a bearish candlestick signal, along with H4 price holding south of 1.31 and room to explore lower ground on both H4 and daily timeframes, sellers appear to have the upper hand this week. Interestingly, the H4 closing candle (pink arrow) could be taken as an entry trigger, with protective stop-loss orders tucked above 1.3109.
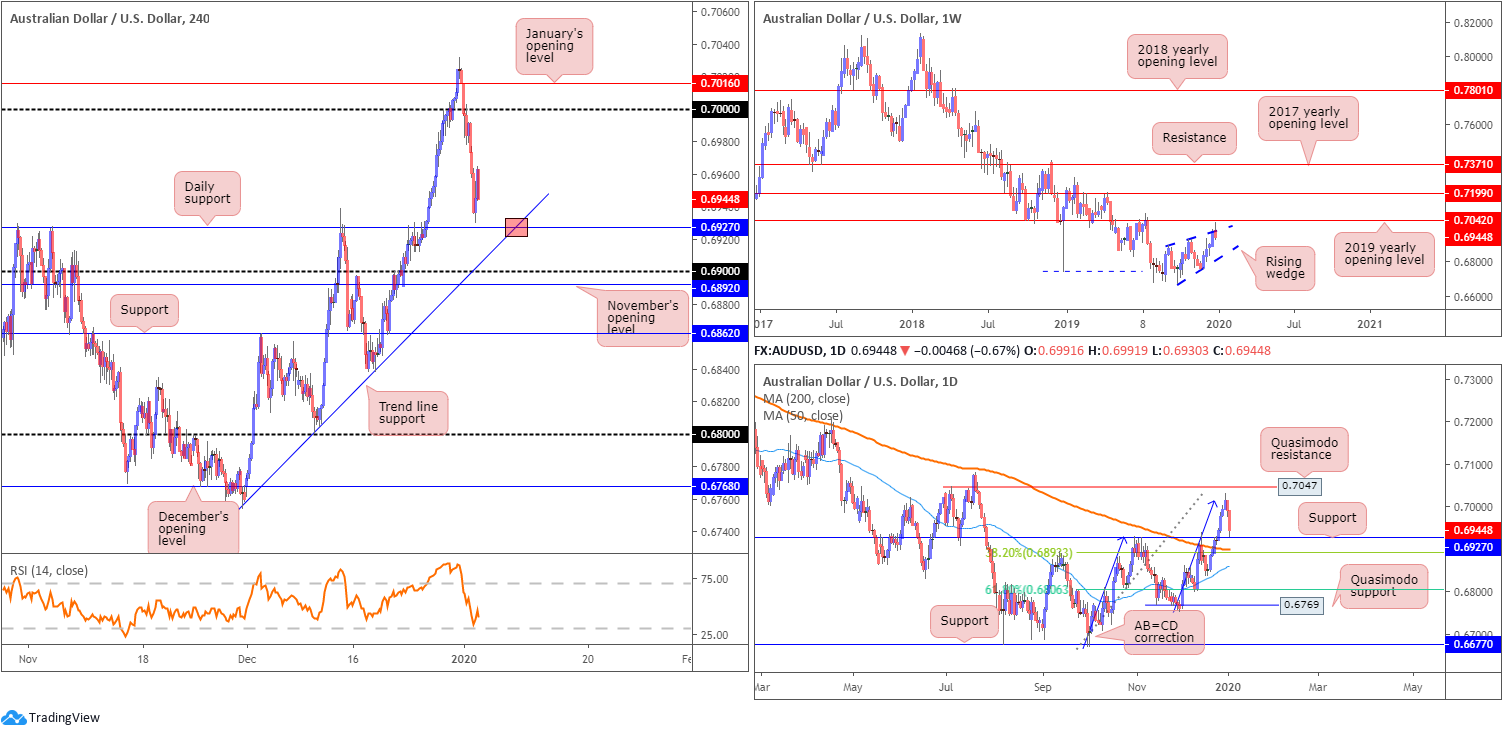
AUD/USD:
Weekly gain/loss: -0.51%
Weekly close: 0.6944
Weekly perspective:
Since registering a bottom in late September at 0.6670, the weekly candles have been busy carving out what appears to be a rising wedge formation, typically considered a continuation pattern.
As the 2019 yearly opening level at 0.7042 came within a few points of entering the fight last week, the upper boundary of the aforementioned rising wedge could potentially hold prices lower this week.
The primary downtrend, visible from this timeframe, has also been in play since early 2018, consequently adding weight to a move south possibly emerging.
Daily perspective:
In conjunction with weekly action, daily price shaped an AB=CD bearish correction (blue arrows) around the 0.7017 neighbourhood that held price lower, seen a touch south of Quasimodo resistance at 0.7047. Thursday and Friday experienced declines, culminating in a near-test of support coming in at 0.6927. What’s also notable from a technical perspective is the 200-day SMA (orange – 0.6898), trailed closely by the 50-day SMA (blue – 0.6862).
It might also be worth acknowledging that traders short the harmonic AB=CD pattern highlighted above will likely be looking to take partial profit around the 38.2% Fibonacci retracement of legs A-D at 0.6893, followed by a final take-profit target around the 61.8% Fibonacci retracement at 0.6806.
H4 perspective:
Across the page, H4 maintained a bearish presence Friday, falling to a one-week low of 0.6930. Fresh global risk-aversion weighed on perceived riskier currencies, such as the Australian dollar, down 0.67% against the buck.
Daily support at 0.6927, as emphasised above, sits nearby, with a break of this level exposing H4 trend line support, taken from the low 0.6754, the 0.69 handle and November’s opening level at 0.6892.
Areas of consideration:
The point the current H4 trend line support merges with daily support at 0.6927 may be of interest this week for a bounce higher. That is assuming price action remains north of the daily level until the area is tested.
0.69 on the H4 timeframe is a support worthy of attention, given its close connection to the daily 38.2% Fibonacci retracement mentioned above at 0.6893 and the 200-day SMA.
The concern regarding longs from the above supports, however, is weekly price threatening a move lower from the upper edge of its rising wedge pattern. As such, any long positions initiated off either 0.6927 or 0.69 this week may be best done only with additional candlestick confirmation. A H4 bullish engulfing pattern, for example, not only highlights buyer intent, it provides entry and risk levels to work with, therefore making it easier to calculate risk/reward.
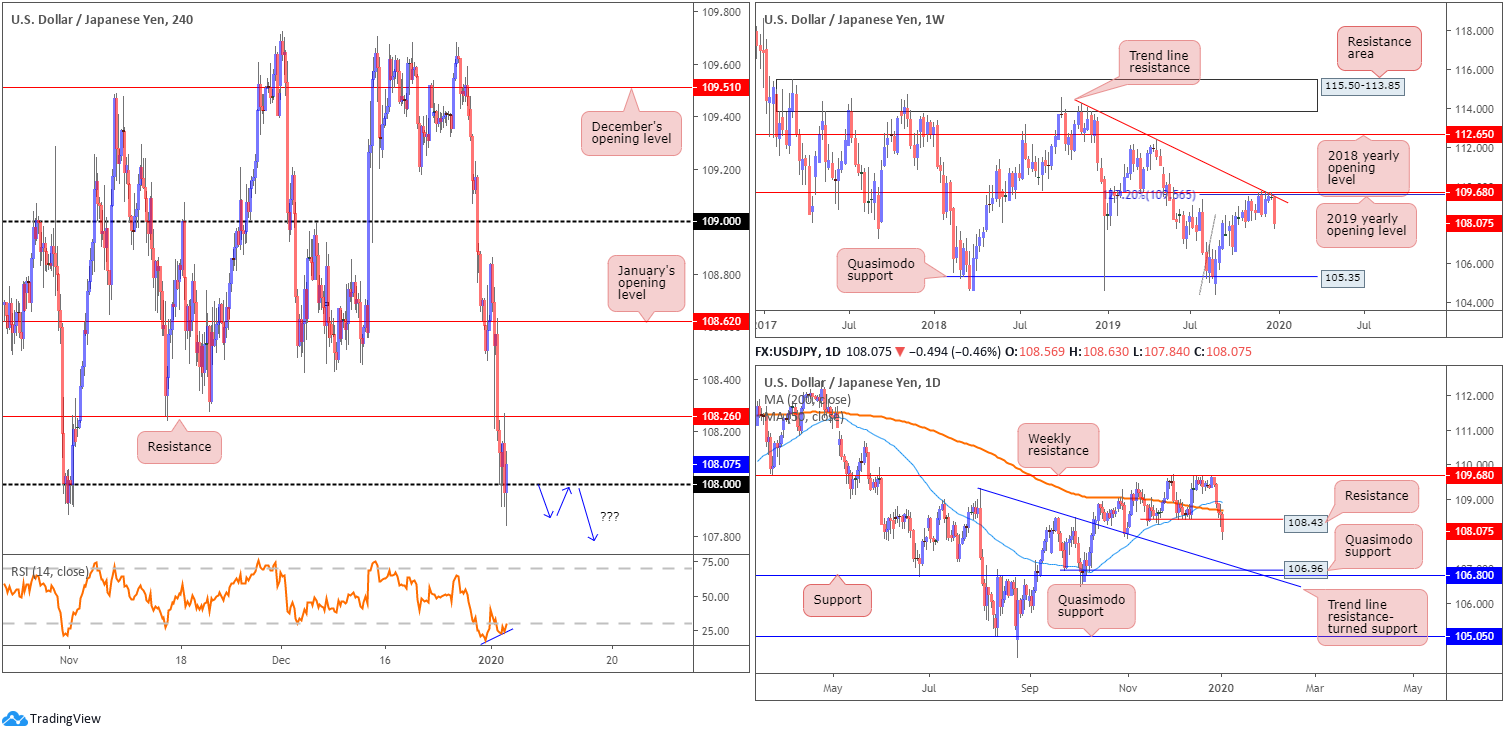
USD/JPY:
Weekly gain/loss: -1.25%
Weekly close: 108.07
Weekly perspective:
USD/JPY, following a decisive 130-point move lower last week, remains south of notable resistances on the weekly timeframe, comprised of a 127.2% Fibonacci extension at 109.56 (taken from the low 104.44), the 2019 yearly opening level at 109.68 and trend line resistance, extended from the high 114.23. Aside from the 106.48 September 30 swing low, limited support is evident until shaking hands with Quasimodo support at 105.35.
In regards to the market’s primary trend, the pair has been entrenched within a long-term range since March 2017, spanning 115.50/105.35.
Daily perspective:
Confirming seller intent, daily price overpowered its 200-day SMA (orange – 108.67) Wednesday and support at 108.43 Friday, potentially setting the stage for an approach towards trend line resistance-turned support. This level is closely shadowed by Quasimodo support at 106.96 and support from 106.80.
H4 perspective:
Both the Japanese yen and bullion retained the bulk of their gains relative to the greenback, on the basis both are considered stores of value during periods of risk aversion. USD/JPY clocked a fresh two-month low at 107.82 in the closing hours, tripping a number of sell stops south of the 108 handle before marginally reclaiming 108+ status into the close. Indicator-based traders may also wish to acknowledge the relative strength index (RSI) is seen producing mild bullish divergence out of overbought territory (blue line).
Resistance is visible north of 108 at 108.26, whereas continued downside could draw in support (not visible on the screen) at 107.42.
Areas of consideration:
Weekly action nosediving from notable resistance around 109.68, daily price dethroning support at 108.43, and sell stops likely filled below the 108 round number on the H4 highlights shorts might be on the table this week.
Waiting for H4 price to close below 108 and either entering on the breakout candle’s close (H4), or waiting for a retest at the underside of 108 to form following the breakout lower, are two themes worth watching. The latter is considered the more conservative of the two approaches, helping shield traders from a whipsaw (fakeout), which is common viewing around psychological levels.
The first support target south of 108 falls in around the H4 support mentioned above at 107.42, closely followed by the noted daily trend line resistance-turned support.
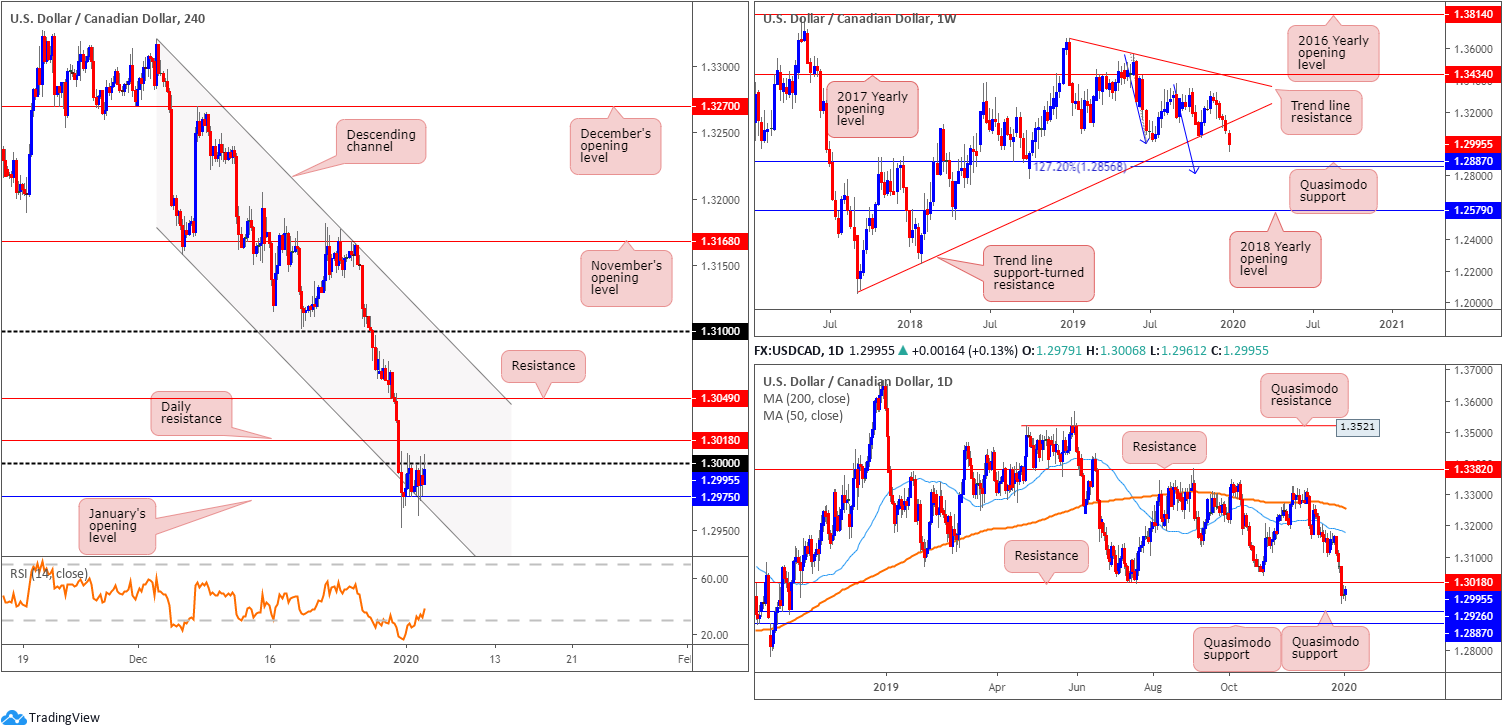
USD/CAD:
Weekly gain/loss: -0.68%
Weekly close: 1.2995
Weekly perspective:
USD/CAD recorded its sixth successive losing week in recent trade, declining more than 85 points on the session. Structurally, price extended its position south of recently broken trend line support, extended from the low 1.2061, and cleared further ground to Quasimodo support at 1.2887, closely trailed by a 127.2% AB=CD bullish correction (blue arrows) at 1.2856. As such, 1.2856/1.2887 is likely a base active buyers reside.
The immediate trend has faced north since bottoming in September 2017; however, this move could also be considered a deep pullback in a larger downtrend from the 1.4689 peak in early January 2016.
Daily perspective:
Wednesday witnessed healthy selling, tunnelling through support at 1.3018 (now serving as resistance) and highlighting two layers of Quasimodo support at 1.2887 and 1.2926. Note the lower of the two represents the weekly Quasimodo support already highlighted above.
It may also interest some traders to note both the 200-day SMA (orange – 1.3256) and 50-day SMA (blue – 1.3180) face a southerly bearing at the moment, with the 50-SMA travelling south of the 200-SMA.
H4 perspective:
Despite several upside attempts, the key figure 1.30 remains in play as resistance, likely bolstered on the back of surging oil prices Friday. Energy prices traded higher as participants revalued the geopolitical risk premium following the US’ attacks on Iranian officials, with WTI reaching highs of $64.00/bbl.
January’s opening level at 1.2975, combined with channel support, taken from the low 1.3158, continue to offer a temporary ‘floor’ in this market. Daily resistance is seen a few points north at 1.3018, with a break of this base underlining resistance at 1.3049 and channel resistance, etched from the high 1.3320. A rotation lower, nonetheless, has the 1.29 handle to target. Before reaching this base, though, sellers must contend with daily Quasimodo support mentioned above at 1.2926.
Areas of consideration:
Overall, higher-timeframe chart studies signify further losses, at least until reaching 1.2926.
Two potential bearish scenarios, therefore, could materialise this week:
- H4 price prints a mild fakeout above 1.30 and draws in daily sellers from resistance at 1.3018. Entry on a close beneath 1.30 is then an option, with the expectation of a H4 close forming beneath January’s opening level at 1.2975, targeting daily Quasimodo support at 1.2926.
- An alternative, and likely the most conservative approach, is to wait for H4 price to close below 1.2975 and either enter on the breakout candle or attempt to trade any retest at 1.2975.
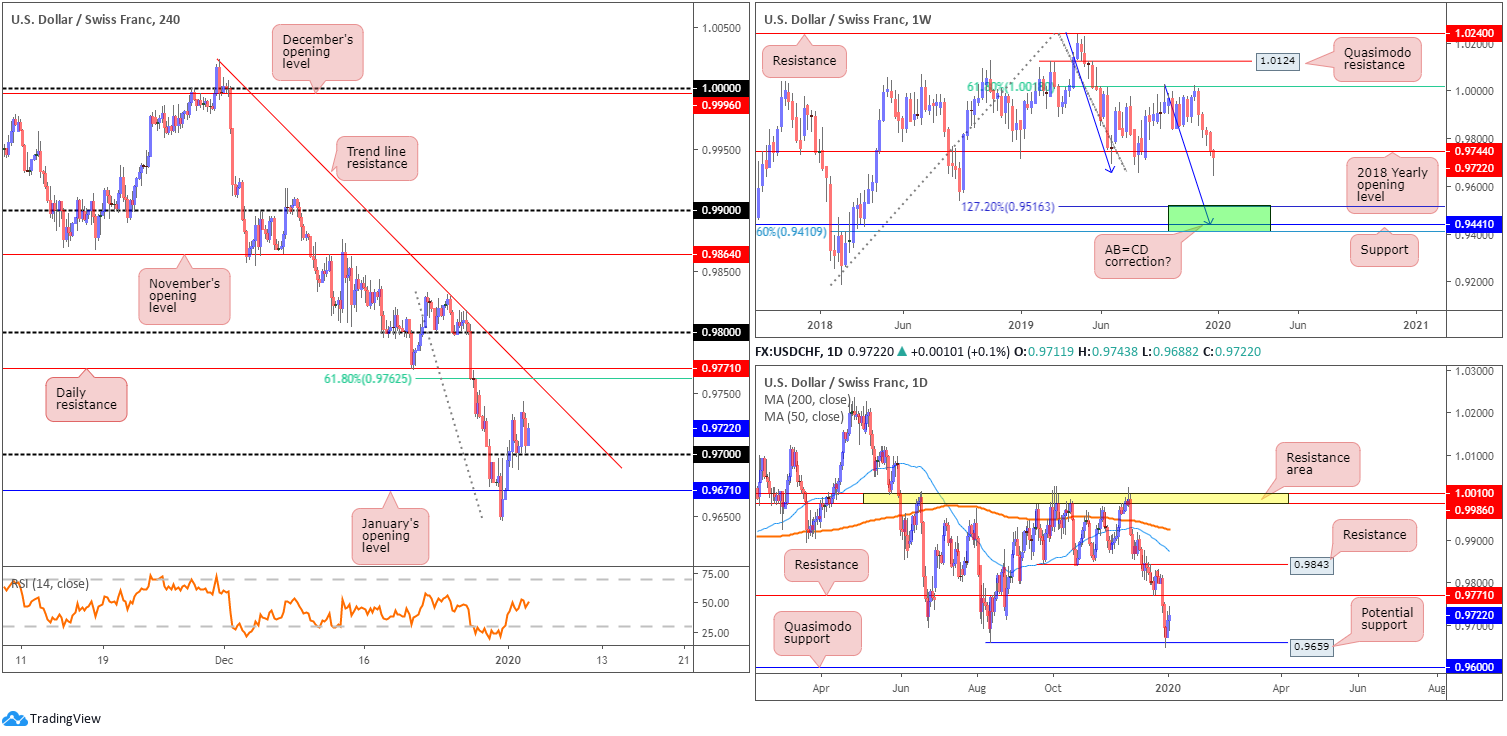
USD/CHF:
Weekly gain/loss: -0.26%
Weekly close: 0.9722
Weekly perspective:
Since shaking hands with the underside of 61.8% Fibonacci retracement ratio at 1.0018, last week chalked up its fifth consecutive bearish candle and activated sell stops south of the 2018 yearly opening level at 0.9744. Capping downside since the beginning of 2019, this level, despite the mild close lower, could still encourage buying, having seen price engulf this level on a couple of occasions in the past and recover.
In the event we continue navigating lower ground this week, the next downside target can be seen around the 0.9410/0.9516 region (comprised of a 78.6% Fibonacci retracement at 0.9410, support at 0.9441 and a 127.2% AB=CD bullish correction at 0.9516 – green).
Daily perspective:
The 0.9659 August 13 low held price north mid-week, reaching highs of 0.9733 by the close. Whether this will be enough to test resistance at 0.9771 this week is difficult to tell as Friday’s action closed reasonably weak. Areas of interest beyond the said zones can be found at resistance coming in at 0.9843 and a Quasimodo support at 0.9600.
Both the 200-day SMA (orange – 0.9924) and 50-day SMA (blue – 0.9874) face a southerly bearing, with the 50-SMA drifting south of the 200-SMA.
H4 perspective:
Broad-based USD strength lifted USD/CHF higher for a second successive session Friday as the safe-haven Swiss franc struggled to capitalise on risk-aversion, following the US’ attacks on Iranian officials.
Technically, we remain north of the 0.97 handle (positioned just ahead of January’s opening level at 0.9671), eyeing nearby trend line resistance, taken from the high 1.0023. Beyond here, the noted daily resistance falls in around 0.9771 (and the 61.8% H4 Fibonacci retracement at 0.9762), followed by the 0.98 handle, which, as you can see, offered noticeable support leading up to Christmas. Traders may also want to note the relative strength index (RSI) is seen treading water around the 50.0 value.
Areas of consideration:
0.97 holding as support will attract a number of buyers into the market early week, looking to lift price to at least the current H4 trend line resistance. Basing a trade solely off a round number, while further upside is certainly a possibility. fares poorly for traders in search of areas of confluence.
Daily resistance at 0.9771 is likely on the radar for many traders this week for potential selling opportunities, knowing we also have additional resistance in the form of a 61.8% Fibonacci retracement at 0.9762. However, for price to test daily resistance, USD/CHF needs to climb back above the 2018 yearly opening level at 0.9744 on the weekly timeframe, which could trigger buying. Therefore, trade with caution.
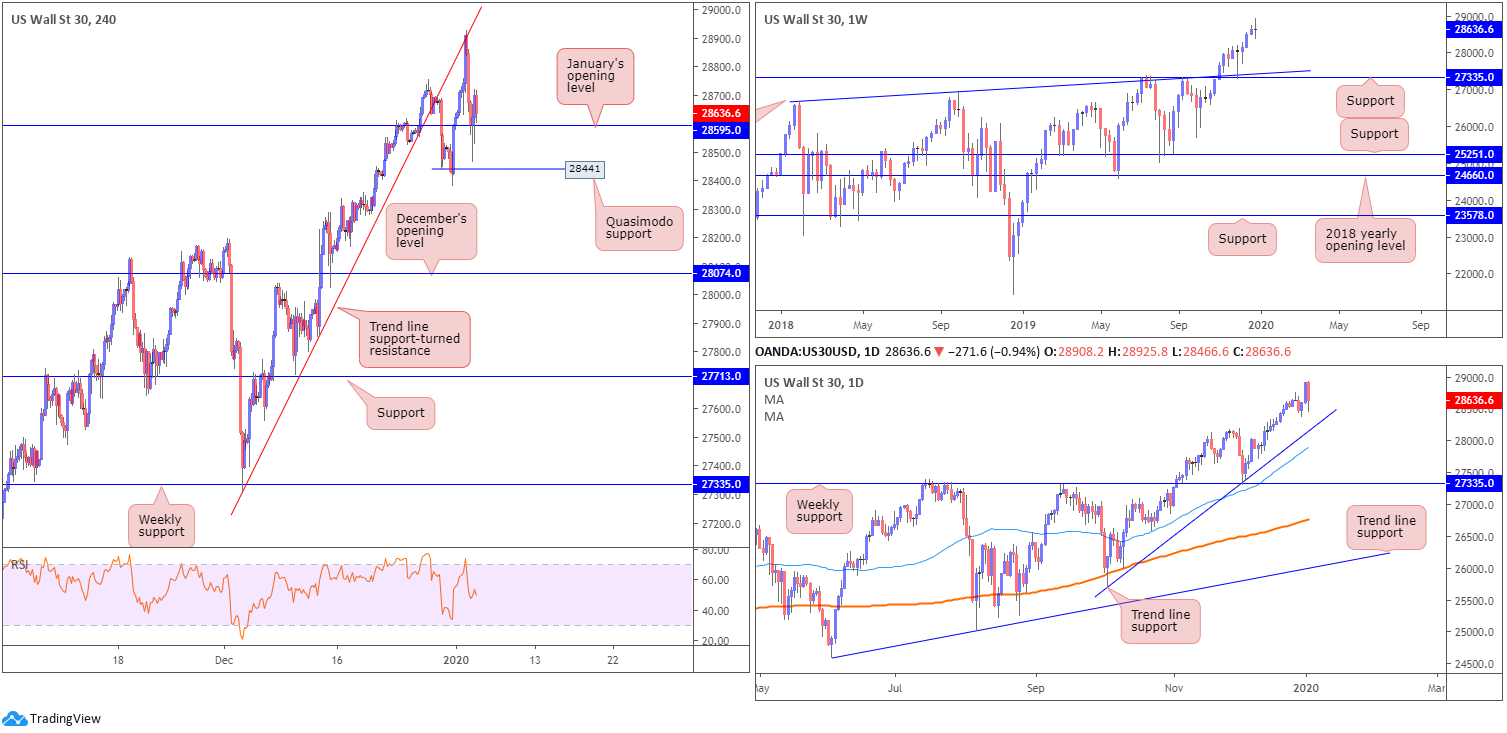
Dow Jones Industrial Average:
Weekly gain/loss: 0.00%
Weekly close: 28636
Weekly perspective:
Following a weekly hammer candlestick pattern (considered a buy signal at troughs), formed five weeks back at the retest of support drawn from 27335, along with trend line support etched from the high 26670, the index tested fresh record peaks of 28925 last week.
Although registering an all-time high, the candle close, a doji indecision candle, is a sign (not a reversal signal) upside momentum may be diminishing.
Daily perspective:
Meanwhile, on the daily timeframe, trend line support, extended from the low 25710, remains intact, bolstered by additional support from the 50-day SMA (blue – 27869).
H4 perspective:
Major US benchmarks wrapped up Friday in negative territory amid escalating tensions in the Middle East and manufacturing activity fell to its lowest reading since June 2009. The Dow Jones Industrial Average erased 233.92 points, or 0.81%; the S&P 500 dropped 23.00 points, or 0.71% and the tech-heavy Nasdaq 100 declined 78.31 points, or 0.88%.
According to the H4 timeframe, the technical picture had the candles reject trend line support-turned resistance, pencilled in from the low 27314 and proceed to cross swords with January’s opening level at 28595 into the close. Quasimodo support is also seen close by at 28441, with a break of this base highlighting December’s opening level at 28074.
Areas of consideration:
Understandably, many traders remain bullish this market and Friday’s minor pullback is unlikely to change this view. In fact, buyers will likely interpret this as a ‘buy-the-dip scenario’. Should a H4 bullish candlestick signal emerge from 28595, this would likely be enough to entice even the most conservative trader into the market, positioning entry and risk levels based on the candlestick signal.
The reason behind requiring additional candlestick confirmation is simple. H4 Quasimodo support at 28441 is just as likely to hold price higher in the event of a move lower. The same can be said for December’s opening level at 28074 or even the daily trend line support, sited just north of the said monthly opening level. Candlestick confirmation is a way of identifying levels of strength.
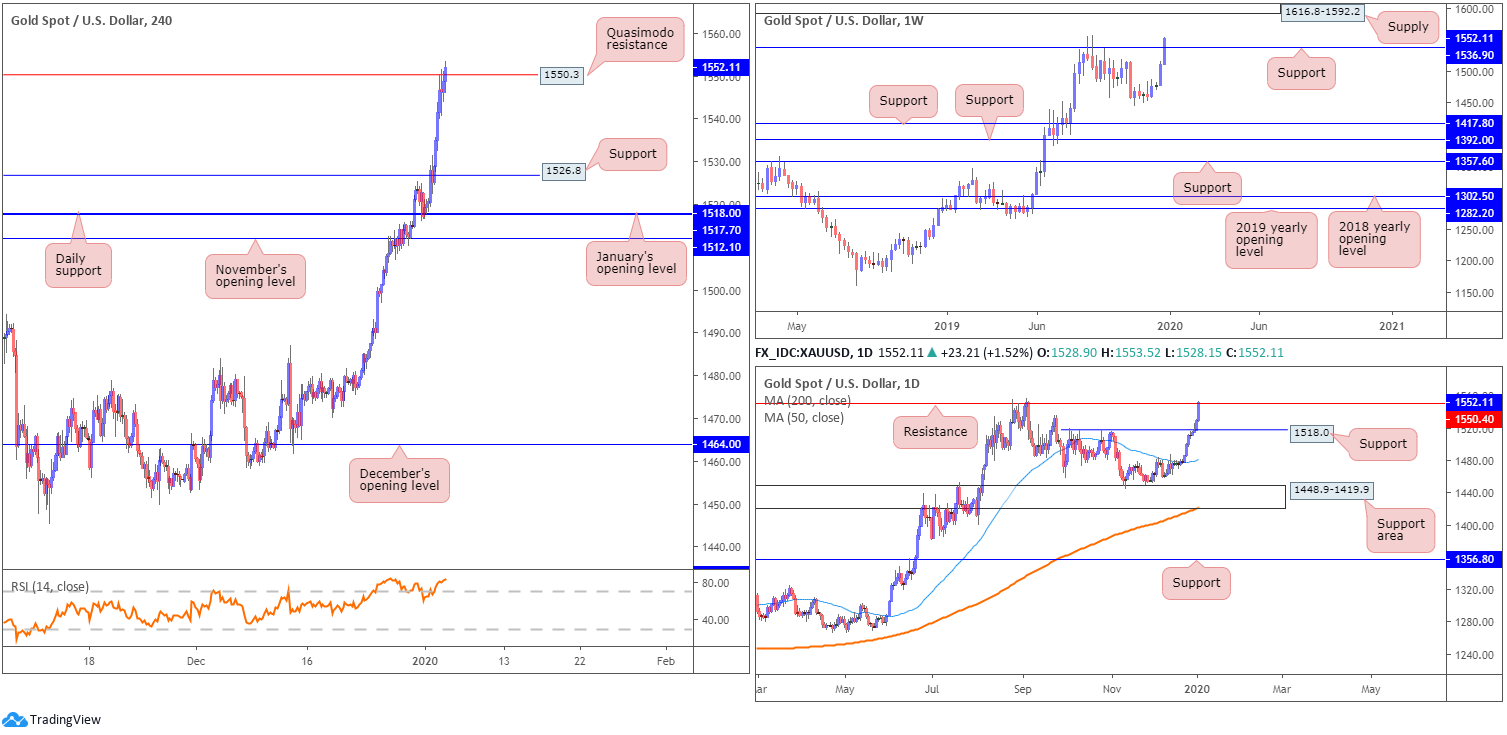
XAU/USD (GOLD):
Weekly gain/loss: +2.73%
Weekly close: 1552.1
Weekly perspective:
Declining US bond yields as well as Middle East tensions spurred demand for safe-haven assets last week, extending gold’s prior week’s strong gain and closing above notable resistance at 1536.9 (now a serving support).
Assuming buyers continue governing direction, supply at 1616.8-1592.2 could hamper upside in the event we reach this far north.
Daily perspective:
Resistance at 1518.0 gave way Thursday, prompting a higher run Friday to resistance at 1550.4. As evident from the chart, price marginally closed above this level into the close, though whether this is sufficient to convince traders that sellers are consumed is difficult to judge at this point. This can only be determined this week, based on price movement.
A decisive close higher could be viewed as additional confirmation we’re heading to weekly supply mentioned above at 1616.8-1592.2, as this area is considered the next upside target on the daily timeframe, too.
H4 perspective:
Across the page on the H4 timeframe, Quasimodo resistance at 1550.3 entered the fold Friday and initially capped upside by way of a doji indecision candle. Sellers were clearly light here as the closing candle settled marginally above the said Quasimodo. Knowing that this Quasimodo is not considered invalid until a break of its apex (1557.1), and given price has yet to print anything decisive around the current daily resistance, countertrend traders may still attempt to make an appearance from here this week.
Failure to push lower, and with a break above the current Quasimodo apex, 1550.3 will then be a support to watch for potential buying opportunities, with an overall take-profit target set at the underside of weekly supply highlighted above at 1616.8-1592.2.
Areas of consideration:
Keep eyes on the H4 Quasimodo resistance at 1550.3 for signs of selling – a decisive H4 bearish candlestick signal such as a shooting star pattern or bearish engulfing formation, for example. This could be enough to draw in sellers, targeting weekly support at 1536.9, followed by H4 support at 1526.8 and then daily support priced in at 1518.0.
As stated above, failure to push lower, and a break of 1557.1, positions 1550.3 in a prime position for longs. Given this level is in line with the current trend and aligns with the current daily support, some traders may buy this level without the need for additional candle confirmation.
(Italics represents previous analysis)
The accuracy, completeness and timeliness of the information contained on this site cannot be guaranteed. IC Markets does not warranty, guarantee or make any representations, or assume any liability regarding financial results based on the use of the information in the site.
News, views, opinions, recommendations and other information obtained from sources outside of www.icmarkets.com.au, used in this site are believed to be reliable, but we cannot guarantee their accuracy or completeness. All such information is subject to change at any time without notice. IC Markets assumes no responsibility for the content of any linked site.
The fact that such links may exist does not indicate approval or endorsement of any material contained on any linked site. IC Markets is not liable for any harm caused by the transmission, through accessing the services or information on this site, of a computer virus, or other computer code or programming device that might be used to access, delete, damage, disable, disrupt or otherwise impede in any manner, the operation of the site or of any user’s software, hardware, data or property.


