
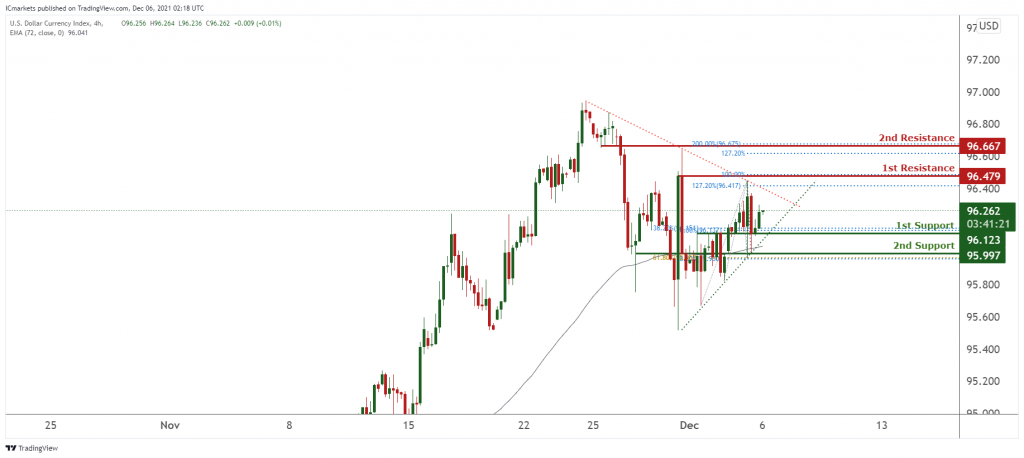
DXY:
On the H4 timeframe, consolidating in a triangle. We see the potential for prices to continue to climb from our 1st support at 96.123 which is an area of Fibonacci confluences towards our 1st resistance at 96.479 in line with 100% and 127.2% Fibonacci extension. Technical indicators are showing bullish momentum. Alternatively, breaking our 1st resistance will find prices climbing higher towards 96.667 in line with 200% and 127.2% Fibonacci extension.
Areas of consideration:
- H4 time frame, 1st resistance at 96.479
- H4 time frame, 1st support at 96.123

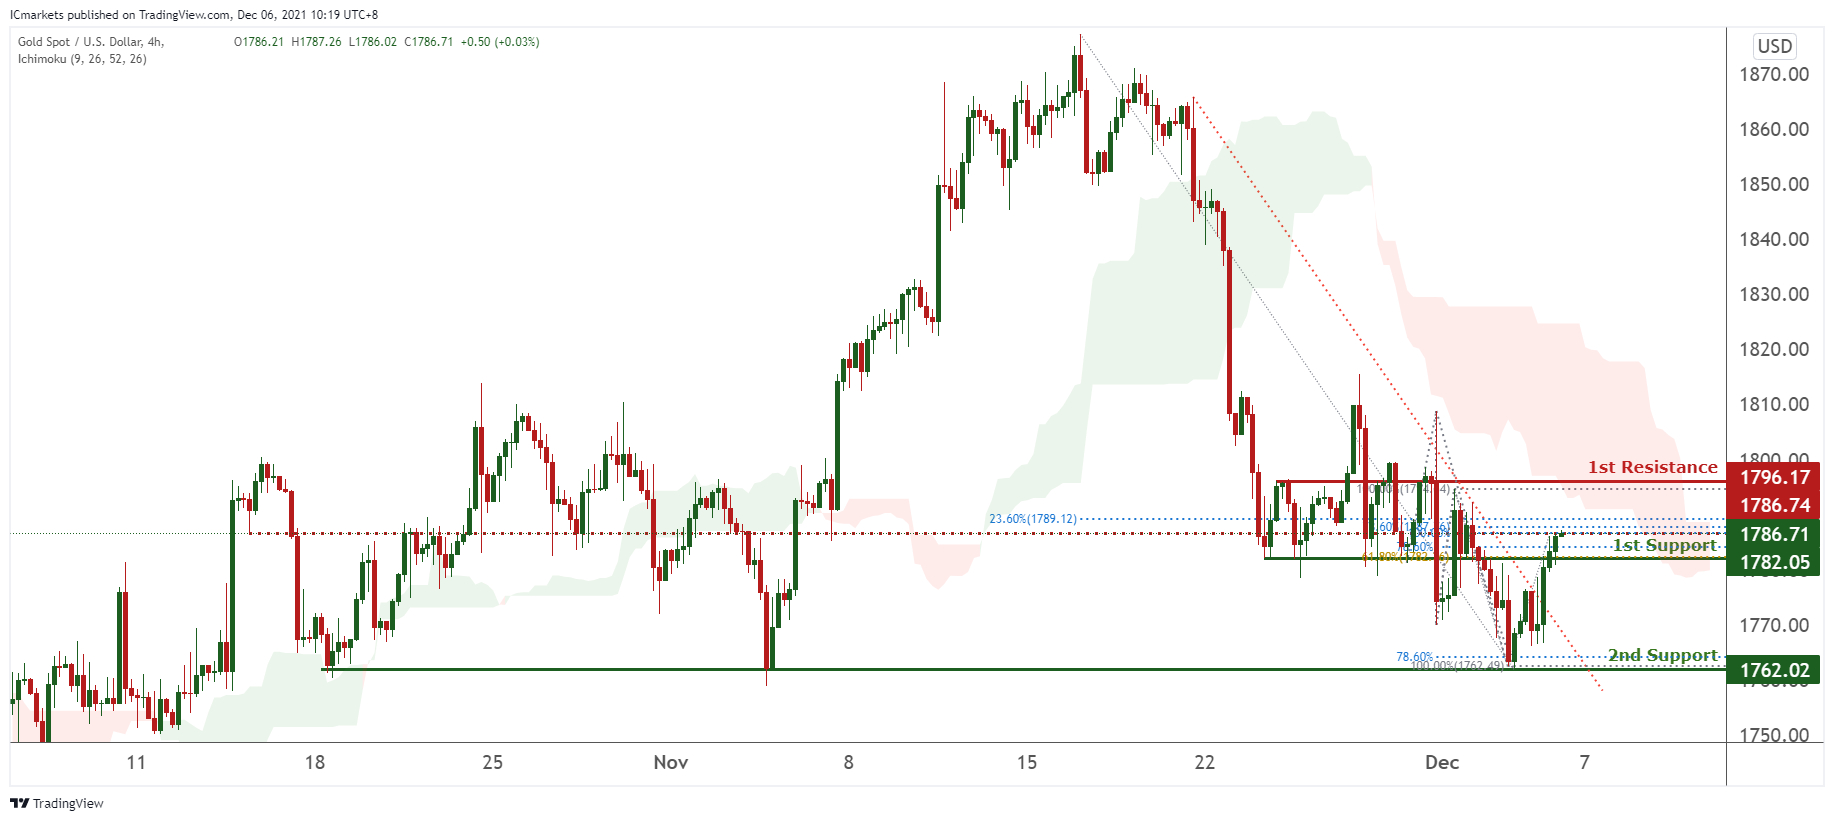
XAU/USD (GOLD):
On the H4 chart, prices are on a bearish momentum. We would watch for a reaction at our intermediate resistance at 1786.14 which is an area of FIbonacci confluences for a reversal towards our 1st support. Breaking it will find prices climbing higher toward our 1st resistance at 1796.17 in line with 100% Fibonacci retracement.
Areas of consideration:
- 4h intermediate resistance at 1786.71
- 4h 1st resistance at 1796.17
- 4h 1st support at 1782.05
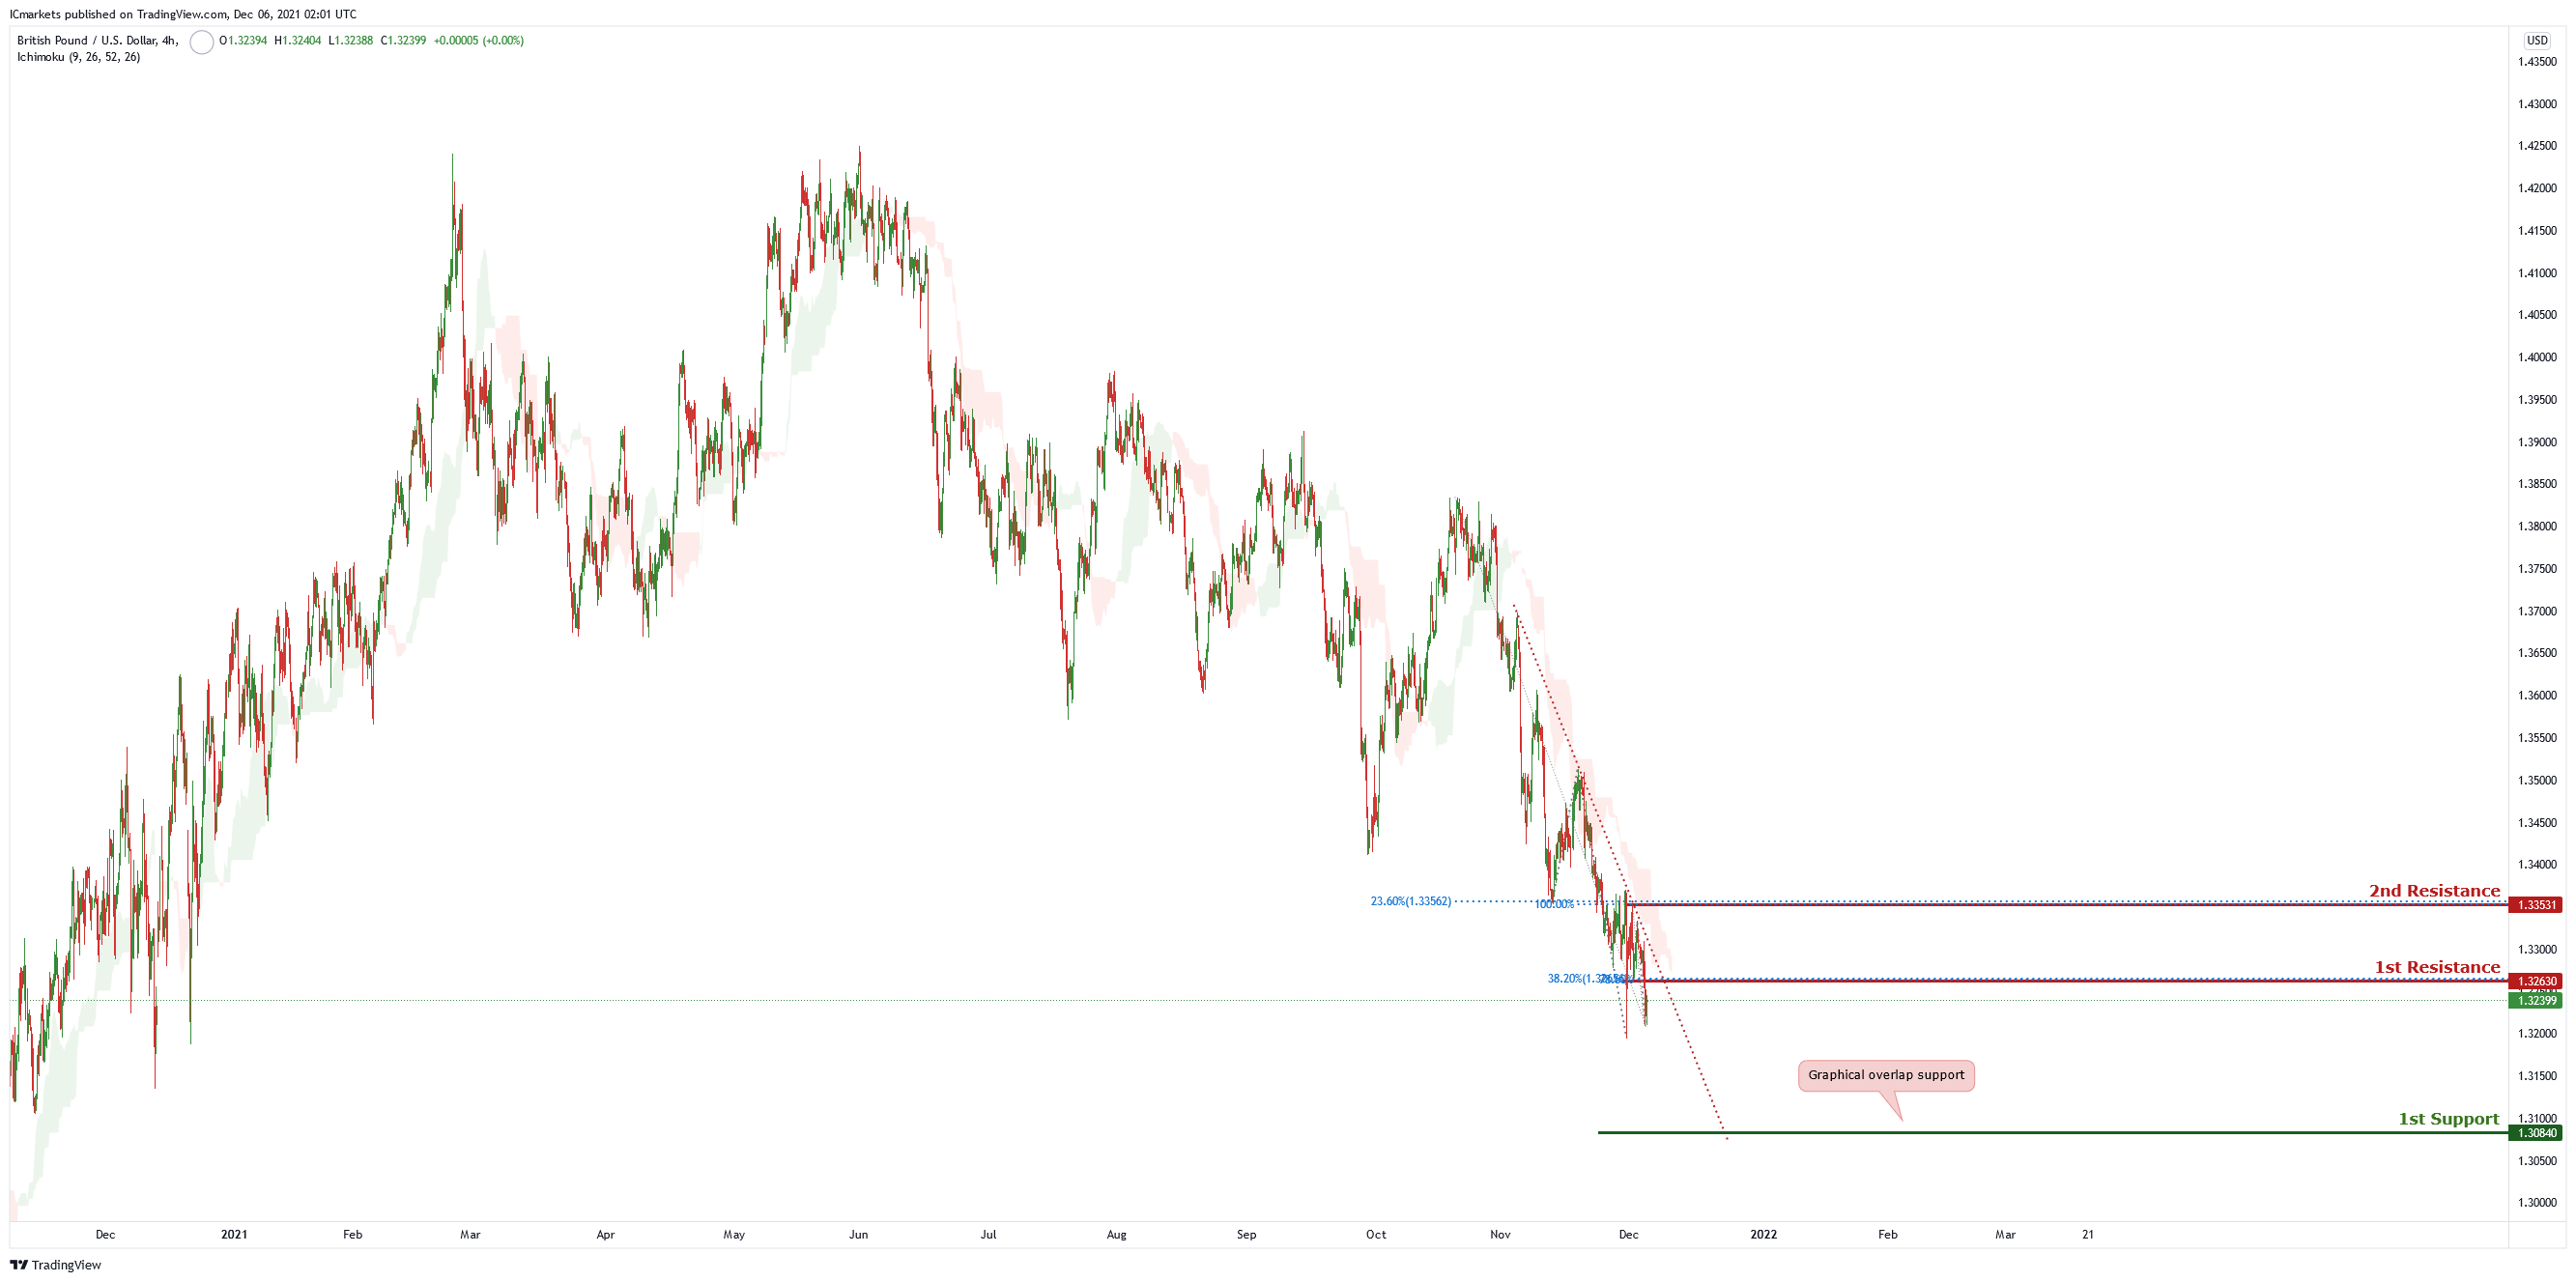
GBP/USD
On the H4 chart , price is trading on a descending trendline and near the first resistance level of 1.32630 which is also 38.2% Fibonacci retracement and 78.6% Fibonacci projection. Price can potentially dip to the first support level of 1.30840 which is also the graphical overlap support. Our bearish bias is supported by the ichimoku cloud indicator as price is trading below it.
Areas of consideration :
- H4 1st resistance at 1.32630
- H4 1st support at 1.30840
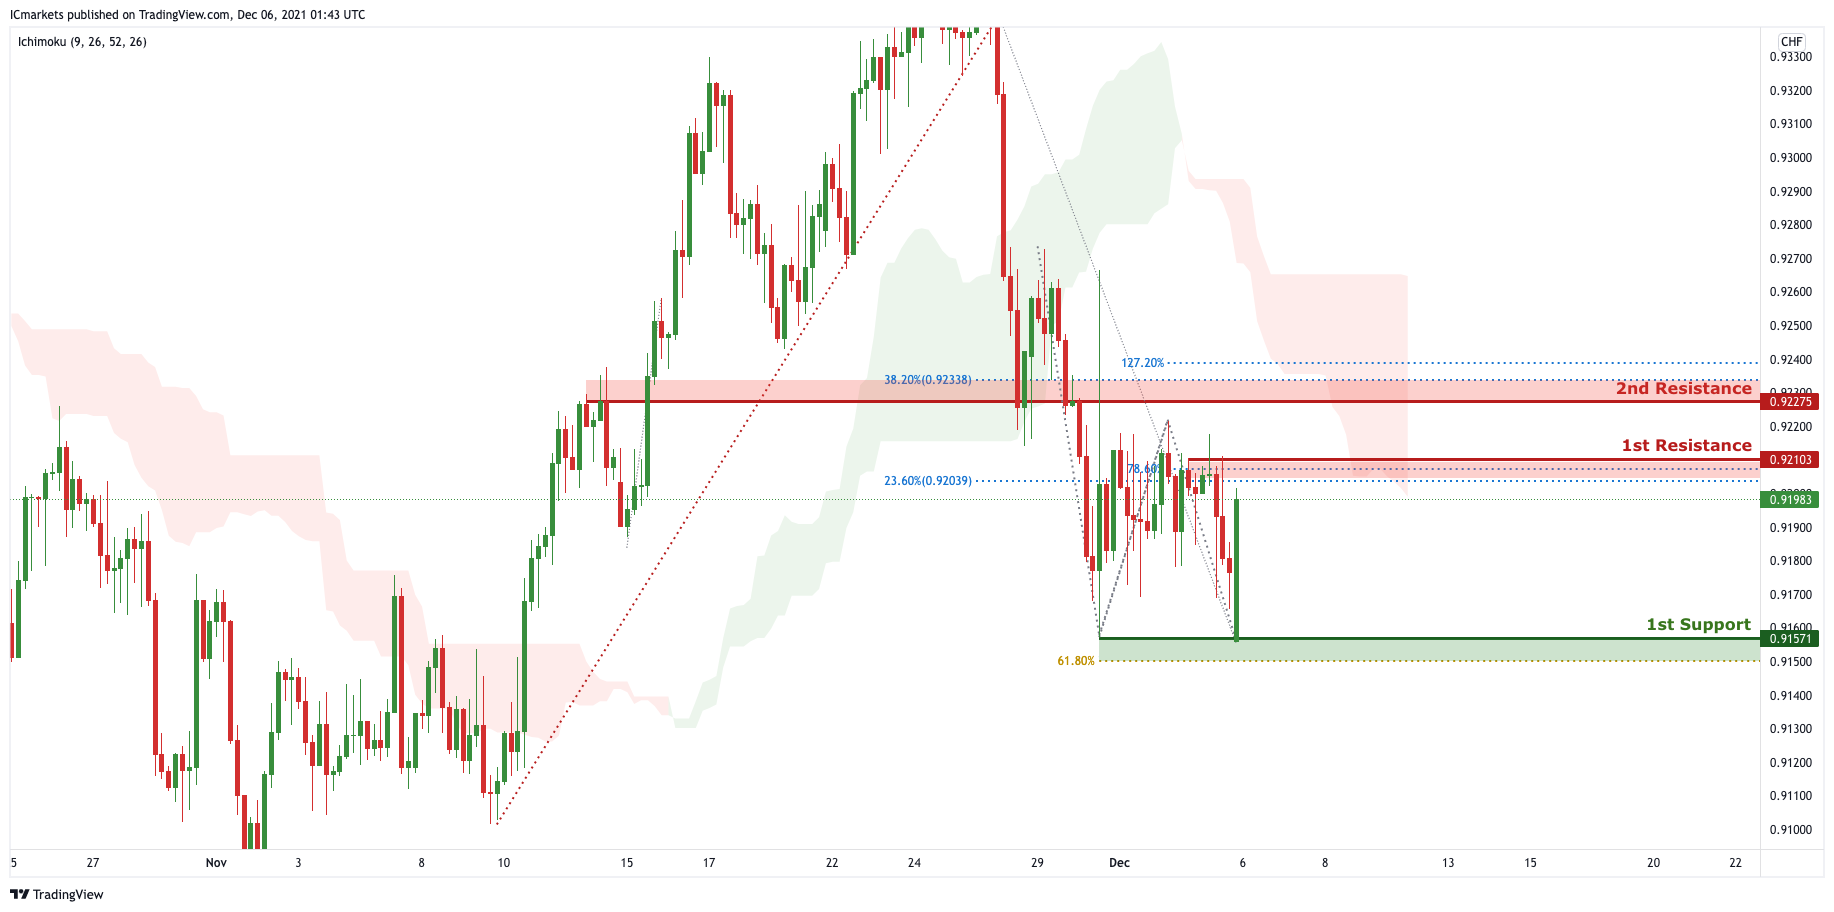
USD/CHF
In reference to last week’s analysis, price indeed dropped to 1st Support at 0.91733. On the H4 timeframe, we can expect price to drop from 1st Resistance in line with 78.6% Fibonacci projection and 23.6% Fibonacci retracement toward 1s Support in line with 61.8% Fibonacci projection. Our bearish bias is further supported by the Ichimoku cloud indicator where price is holding below it.
Areas of consideration:
- Watch 1st Support at 0.91571
- Watch 1st Resistance at 0.92103
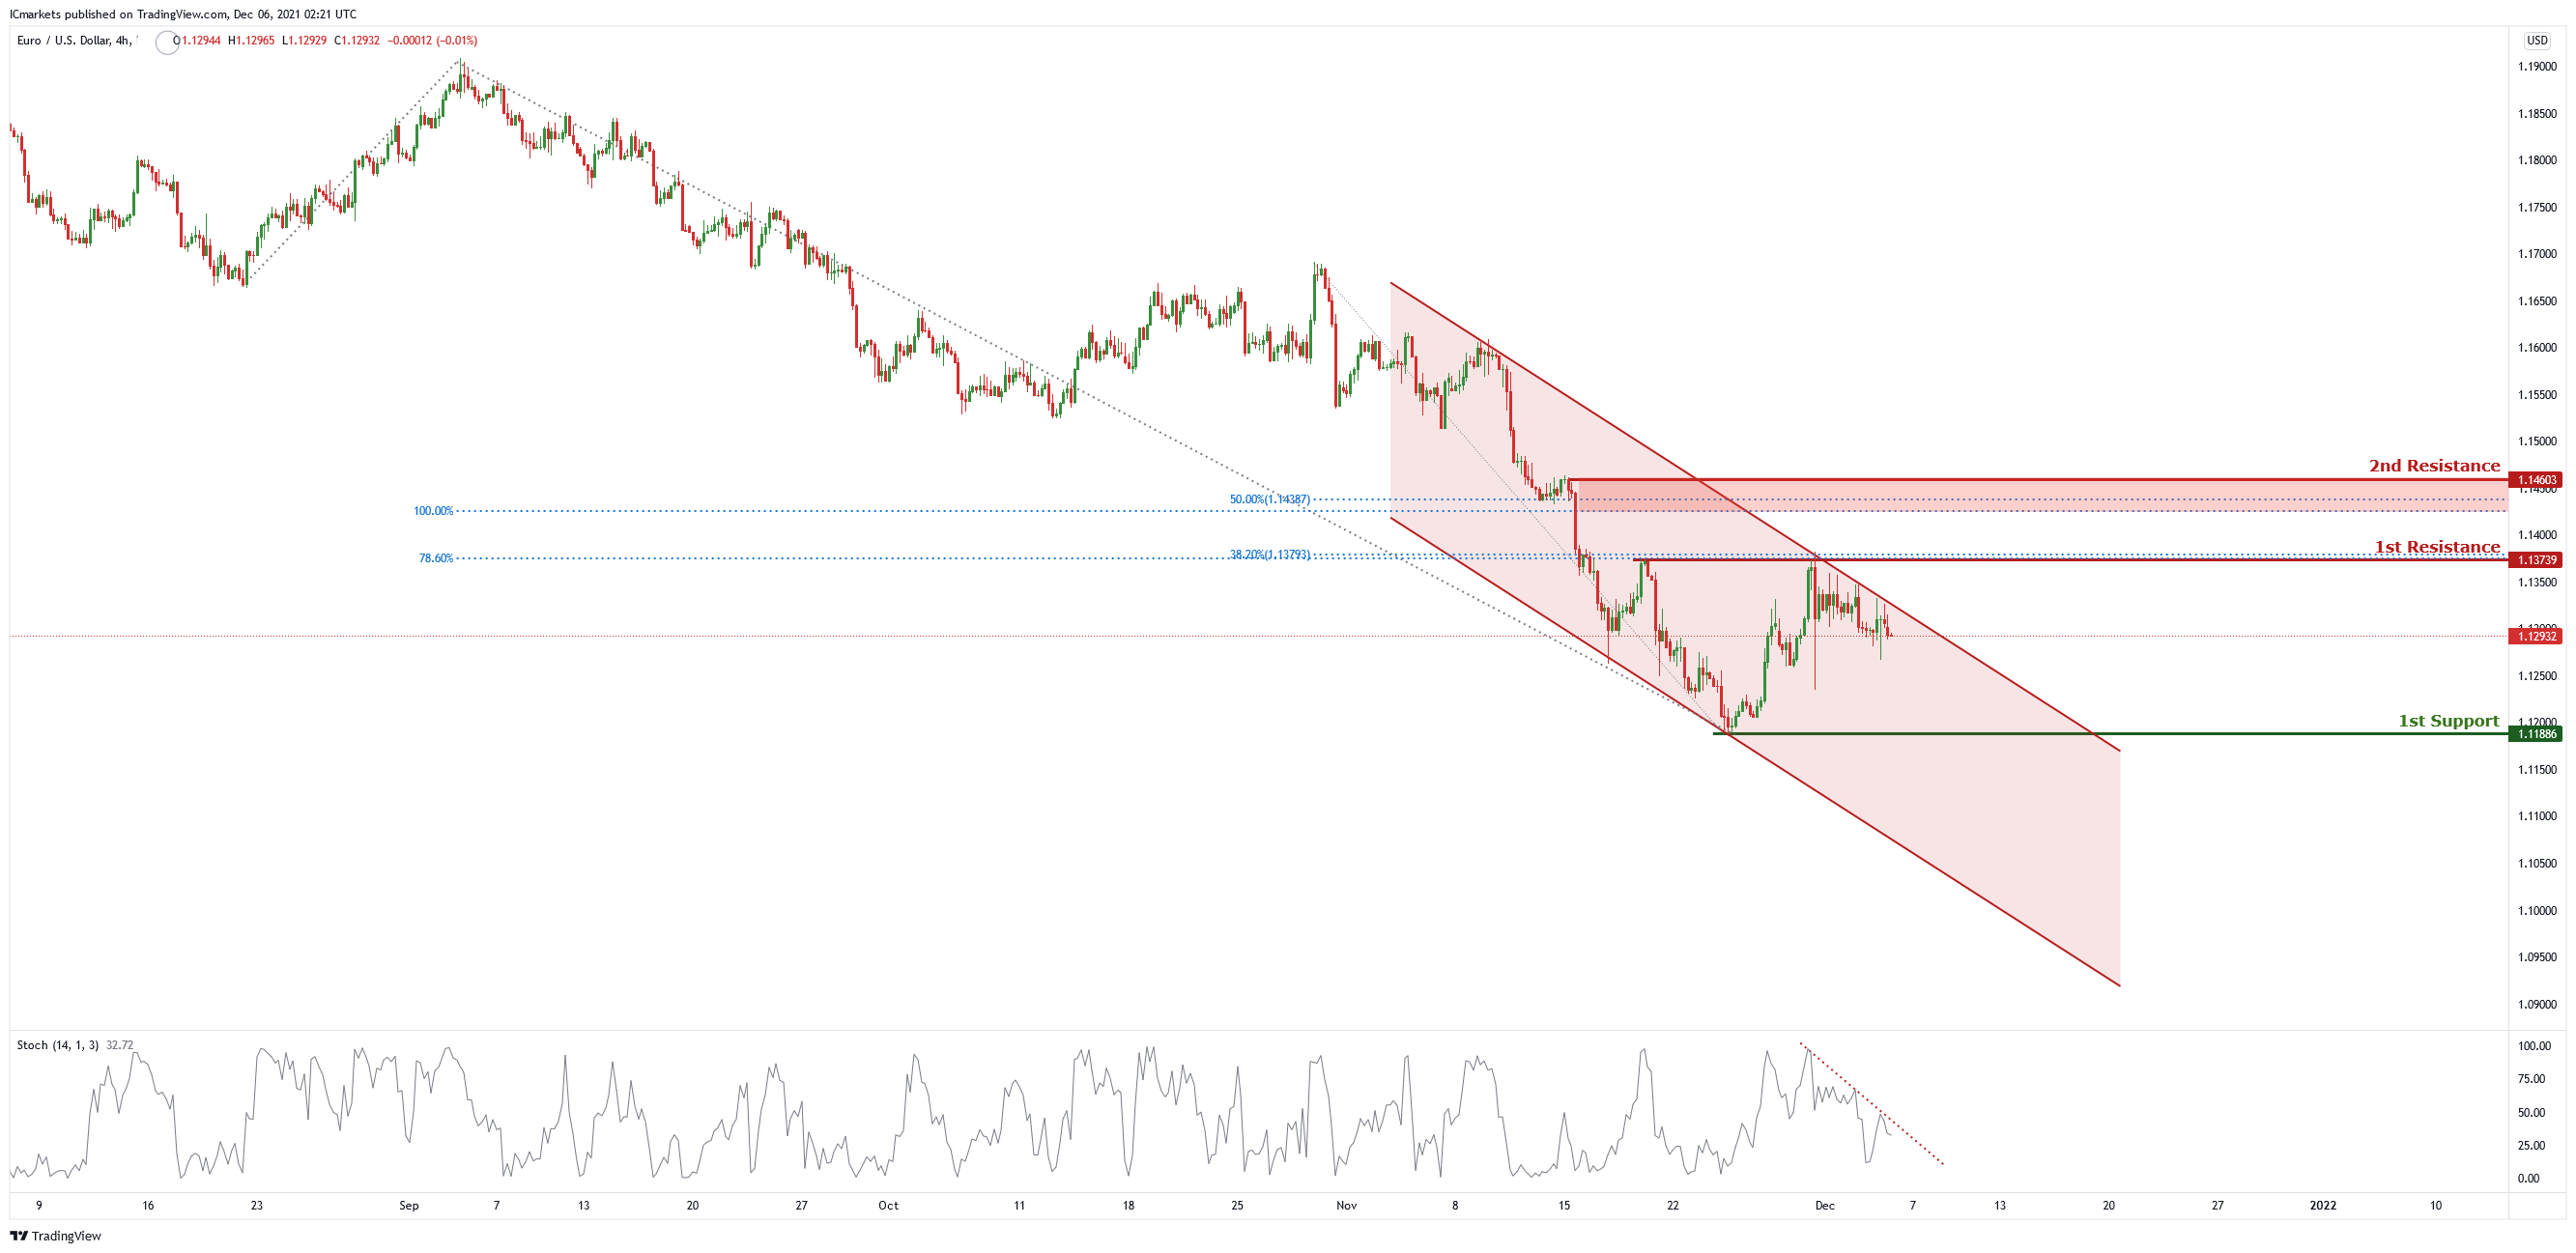
EUR/USD :
On the H4 chart price is trading in a descending channel and near the first resistance level of 1.13739 which is also 38.2% Fibonacci retracement and 78.6% Fibonacci projection. Price can potentially dip to the first support level of 1.11886 which is also the graphical swing low level. Our bearish bias is supported by the stochastic indicator as it is abiding by the descending trendline.
Areas of consideration :
- H4 first resistance at 1.13739
- H4 1st support at 1.11886
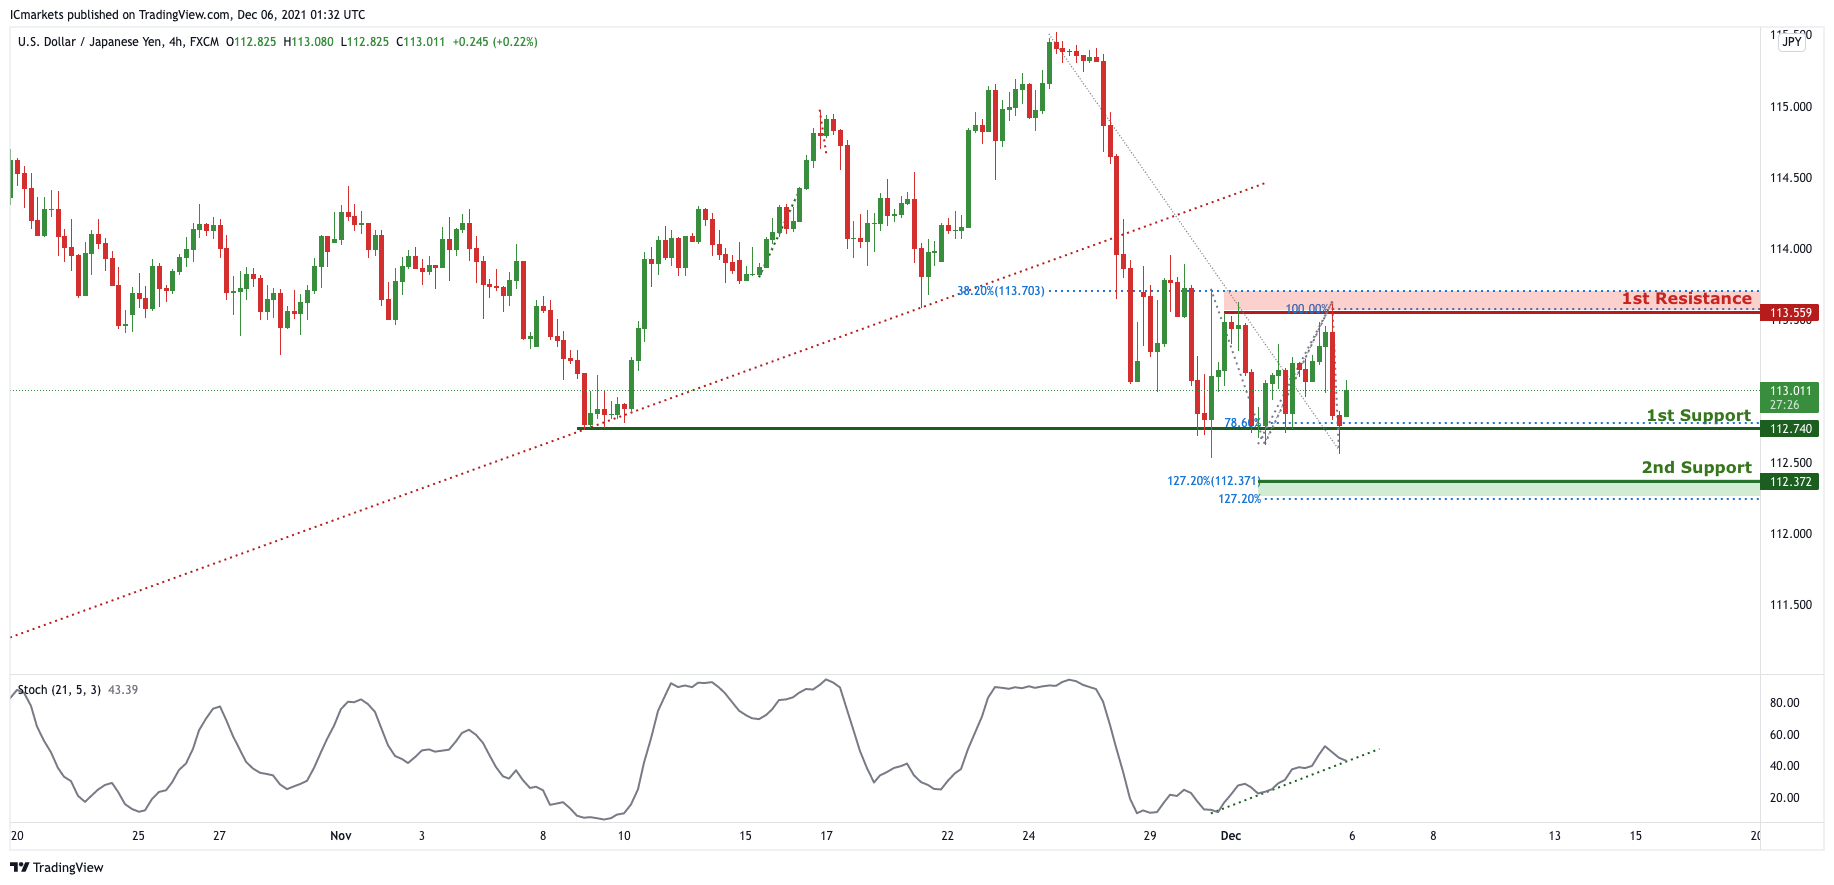
USD/JPY
On the H4 timeframe, price broke out of the ascending trendline support, signifying a bearish momentum. However, we can expect price to make a small retracement from 1st Support in line with 78.6% Fibonacci projection towards 1st Resistance in line with 38.2% Fibonacci retracement and 100% Fibonacci projection. Our short-term bullish bias is further supported by the stochastic indicator where the %K line is abiding to the ascending trendline support.
Areas of consideration:
- H4 1st resistance level 113.559
- H4 1st support level 112.740
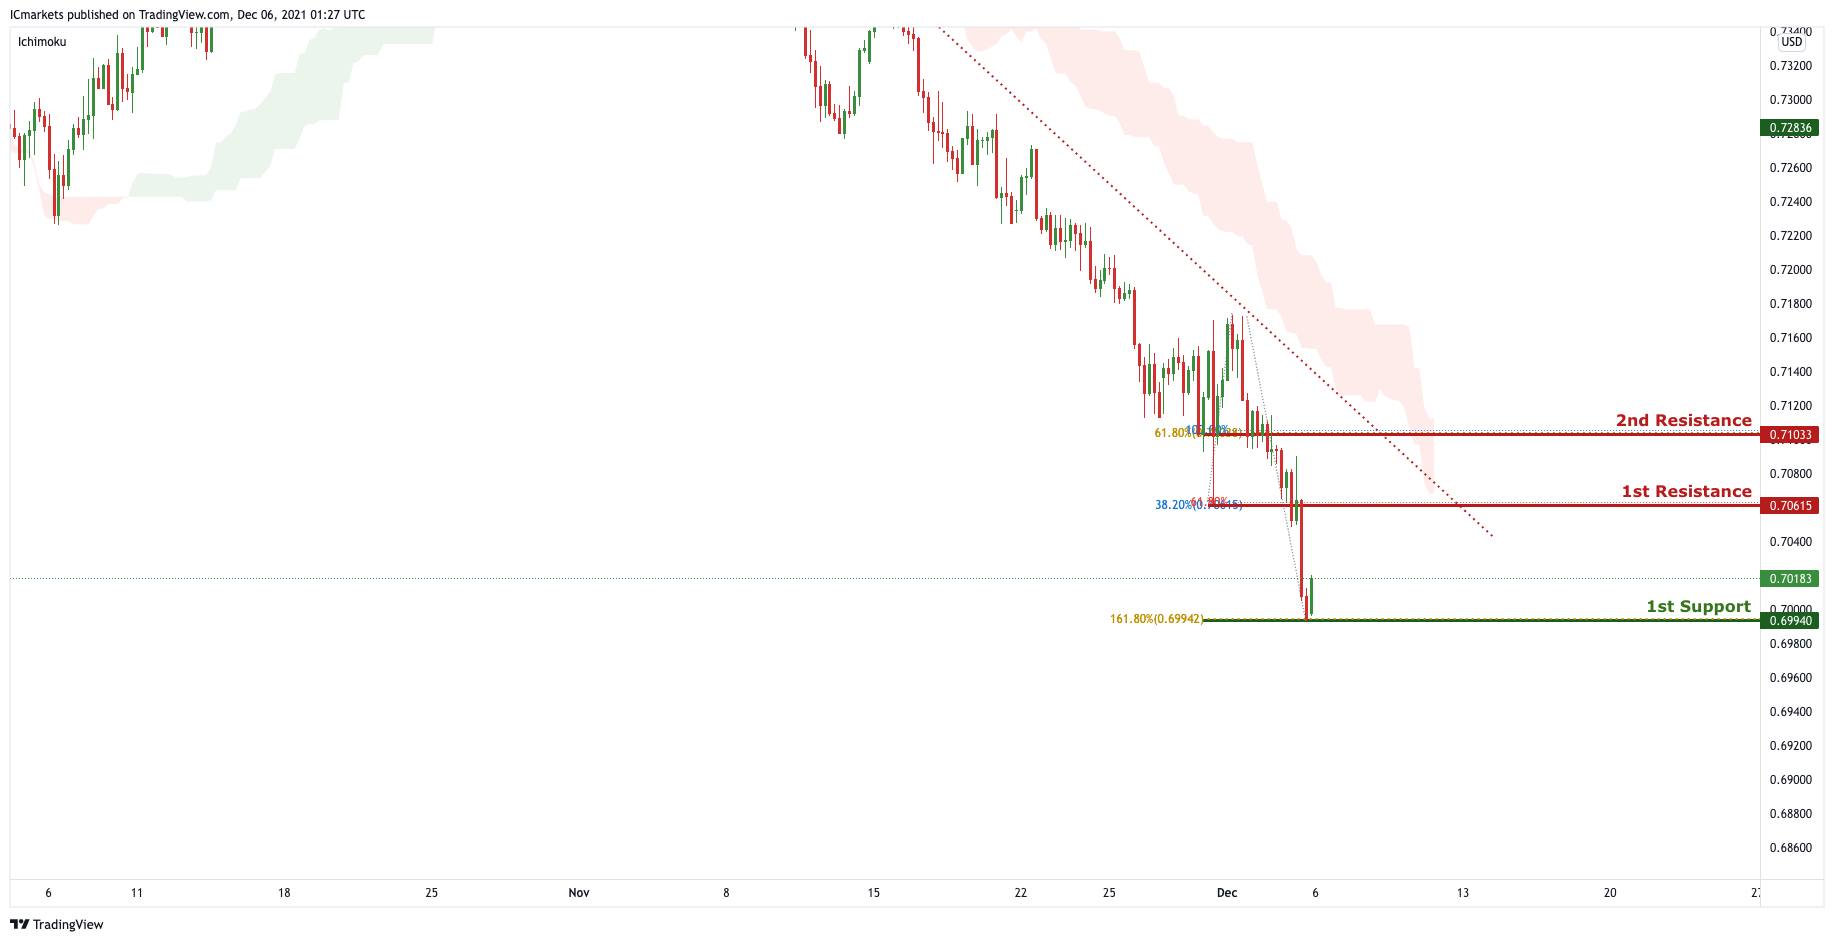
AUD/USD:
In reference to last week’s analysis price indeed dropped to 1st Support at 0.70274. On the H4, price is abiding to the descending trendline resistance, signifying bearish momentum. Price dropped below the daily overlap support, we can expect price to drop from 1st Resistance in line with 38.2% FIbonacci retracement and 61.8% Fibonacci projection towards 1st Support in line with 161.8% Fibonacci extension. Our bearish bias is further supported by the Ichimoku cloud indicator acting as a resistance.
Areas of consideration:
- H4 1st resistance level 0.70615
- H4 1st support level 0.69940
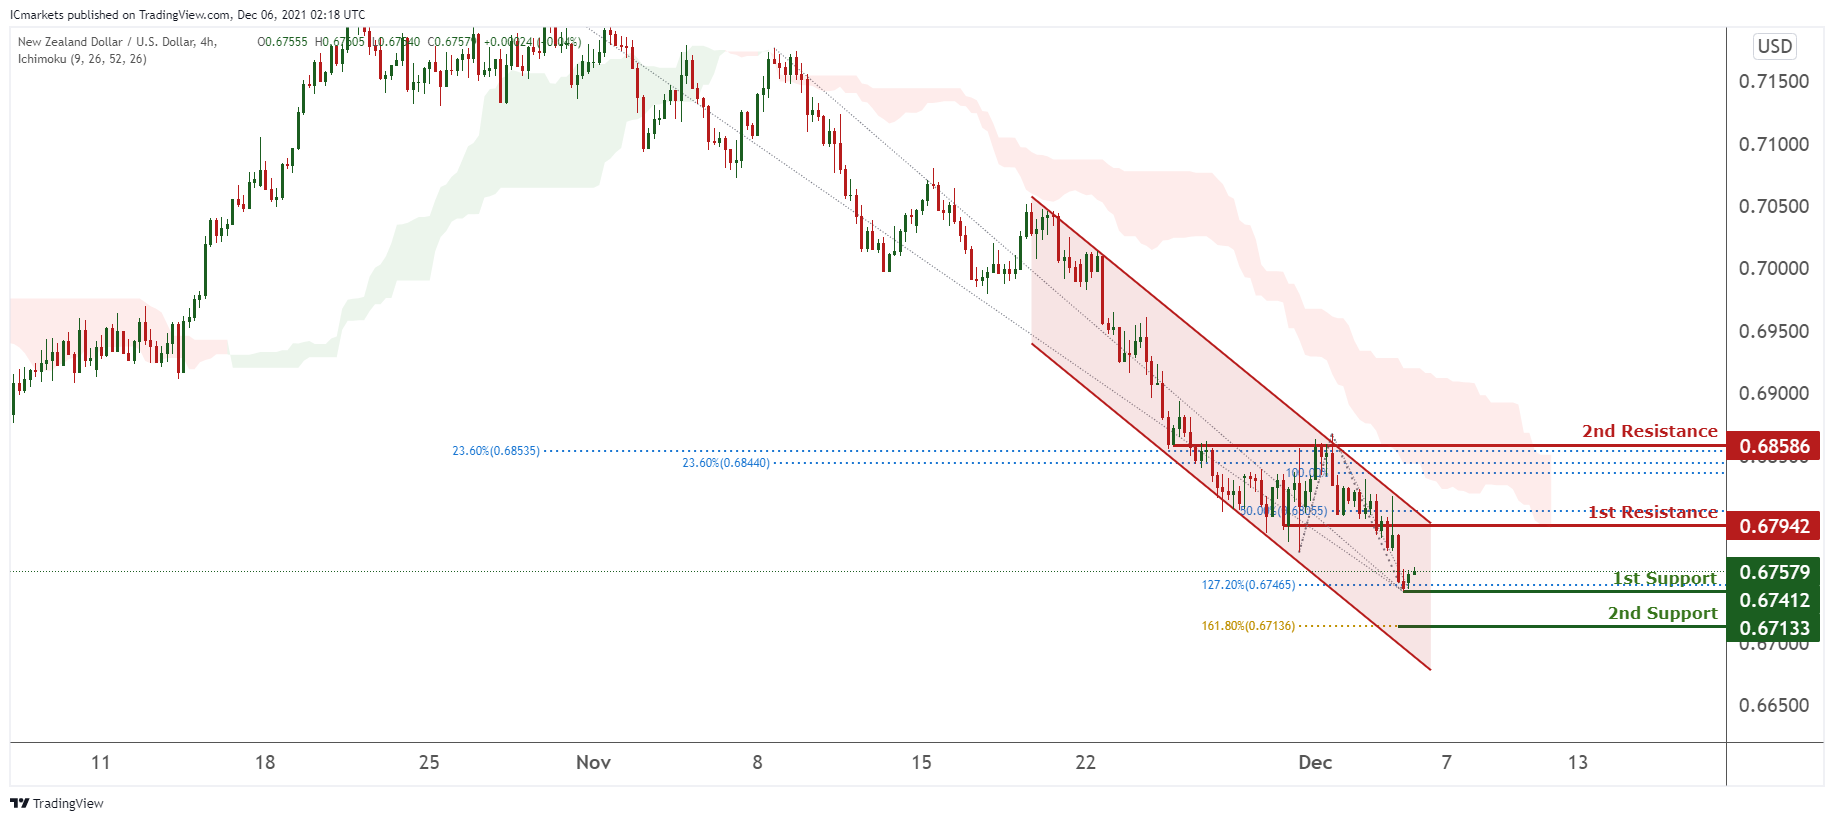
NZD/USD:
On the H4 timeframe, prices are consolidating in a bearish channel. We see potential for prices to experience a small bounce towards our 1st support at 0.67412 in line with 127.2% Fibonacci extension towards our 1st resistance at 0.67942 in line with 50% Fibonacci retracement. If prices break our 1st support, prices can potentially dip further towards our 2nd support at 0.67133 in line with 161.8% Fibonacci extension.
Areas of consideration:
- H4 time frame, 1st resistance at 0.67942
- H4 time frame, 1st support at 0.67412
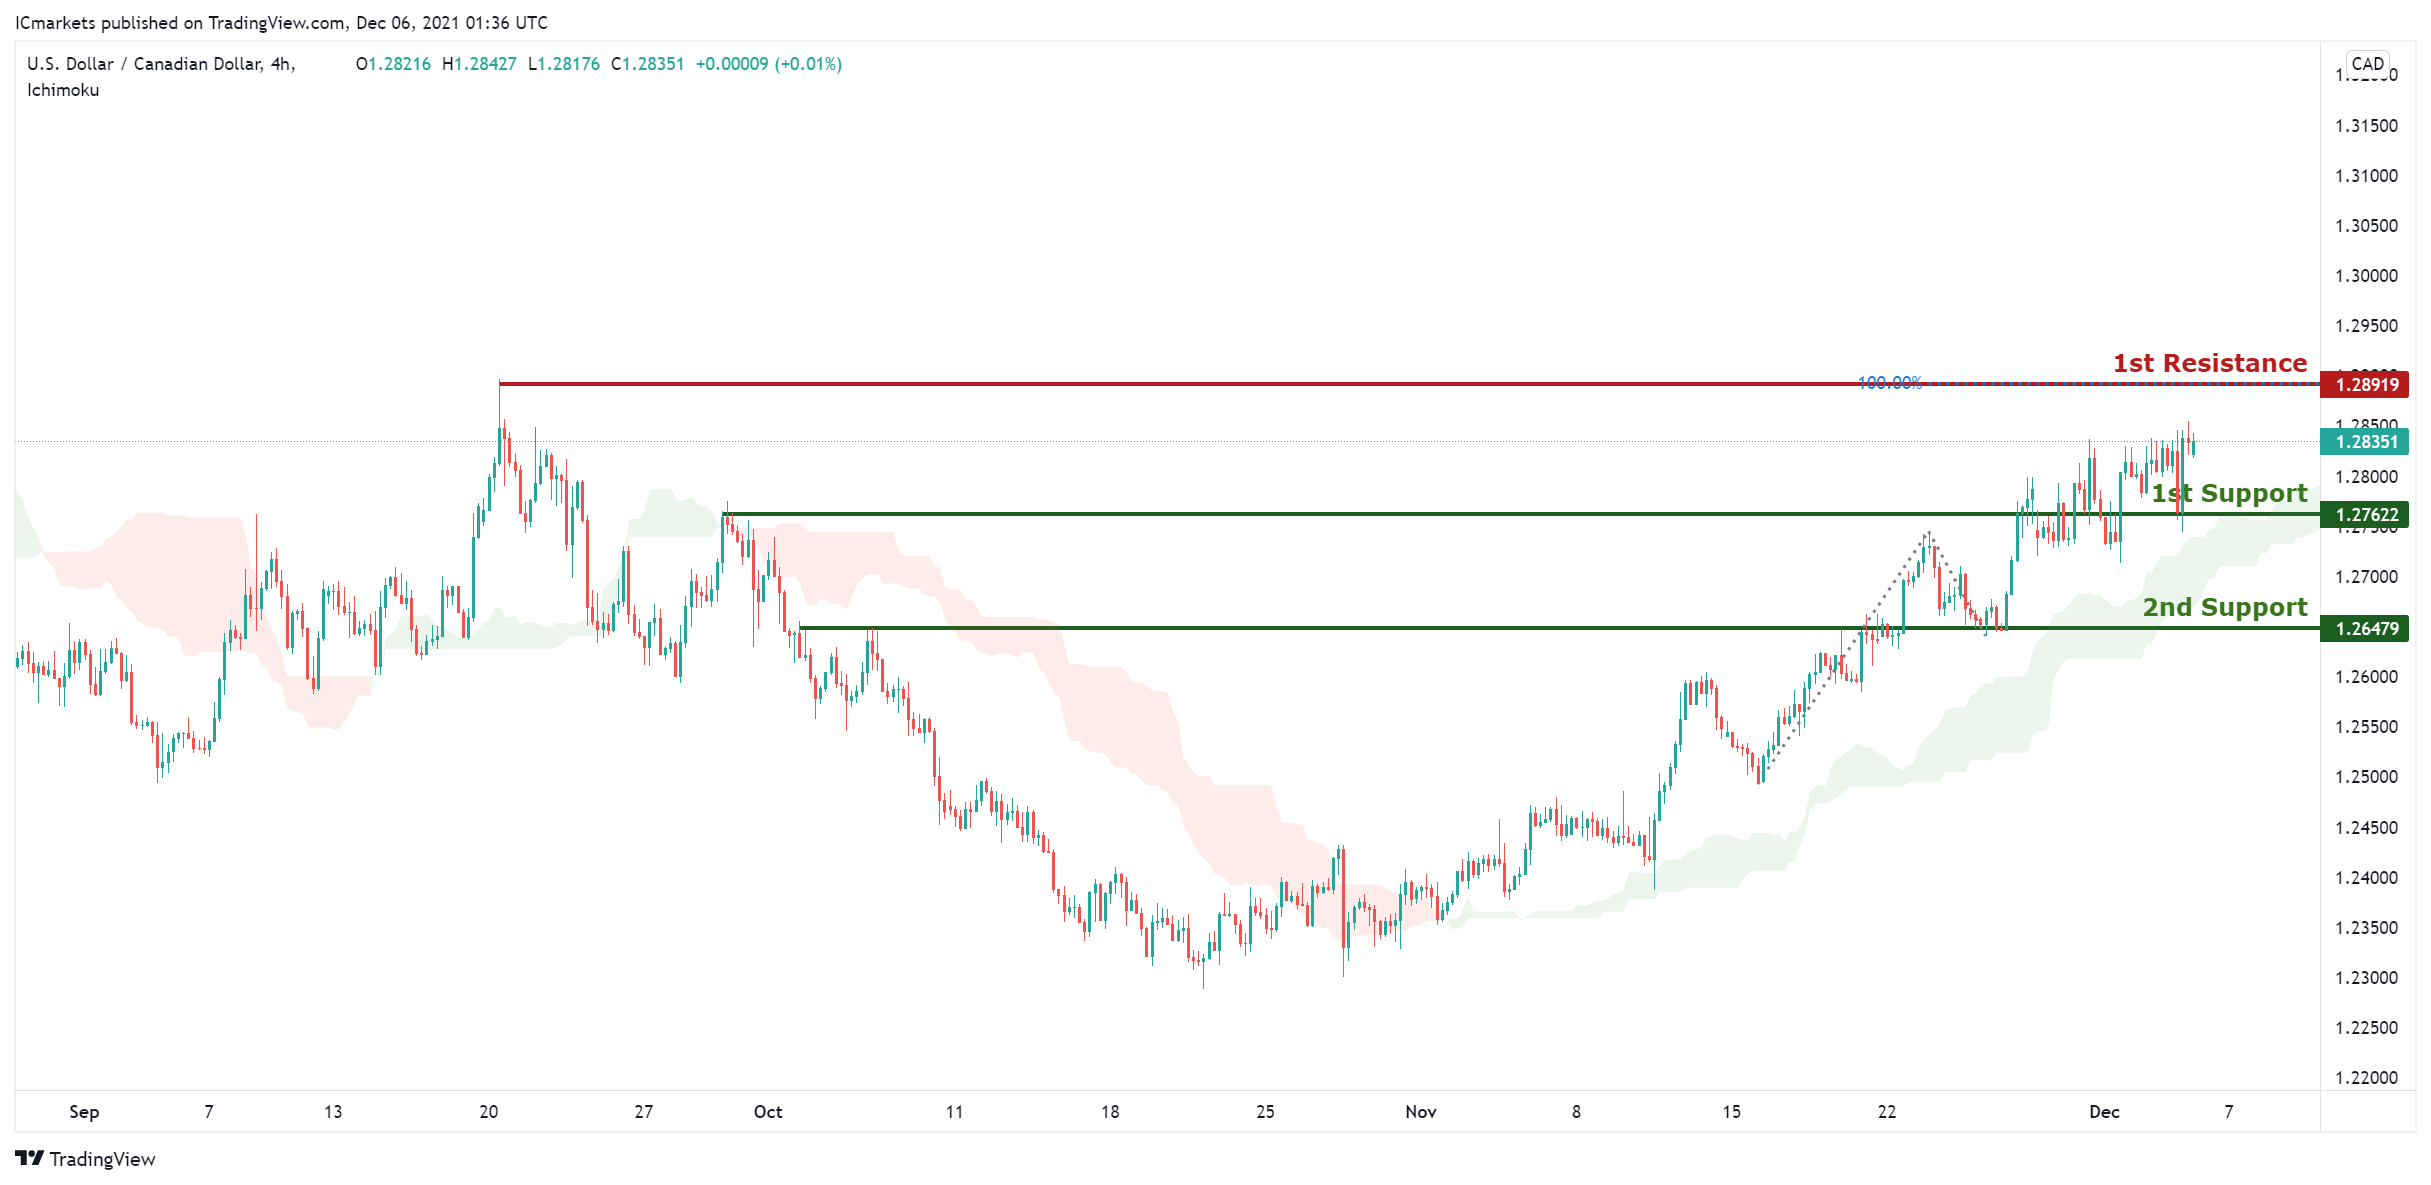
USD/CAD:
On the H4, with price moving above the ichimoku indicator, we have a bullish bias that price will rise from 1st support at 1.27622 in line with the graphical overlap support to 1st resistance at 1.28919 in line with the graphical swing high resistance and 100% Fibonacci projection. Alternatively, we may see price break 1st support structure and head for 2nd support at 1.26479 in line with the horizontal swing low support.
Areas of consideration:
- H4 time frame, support at 27622
- H4 time frame, resistance at 1.28919
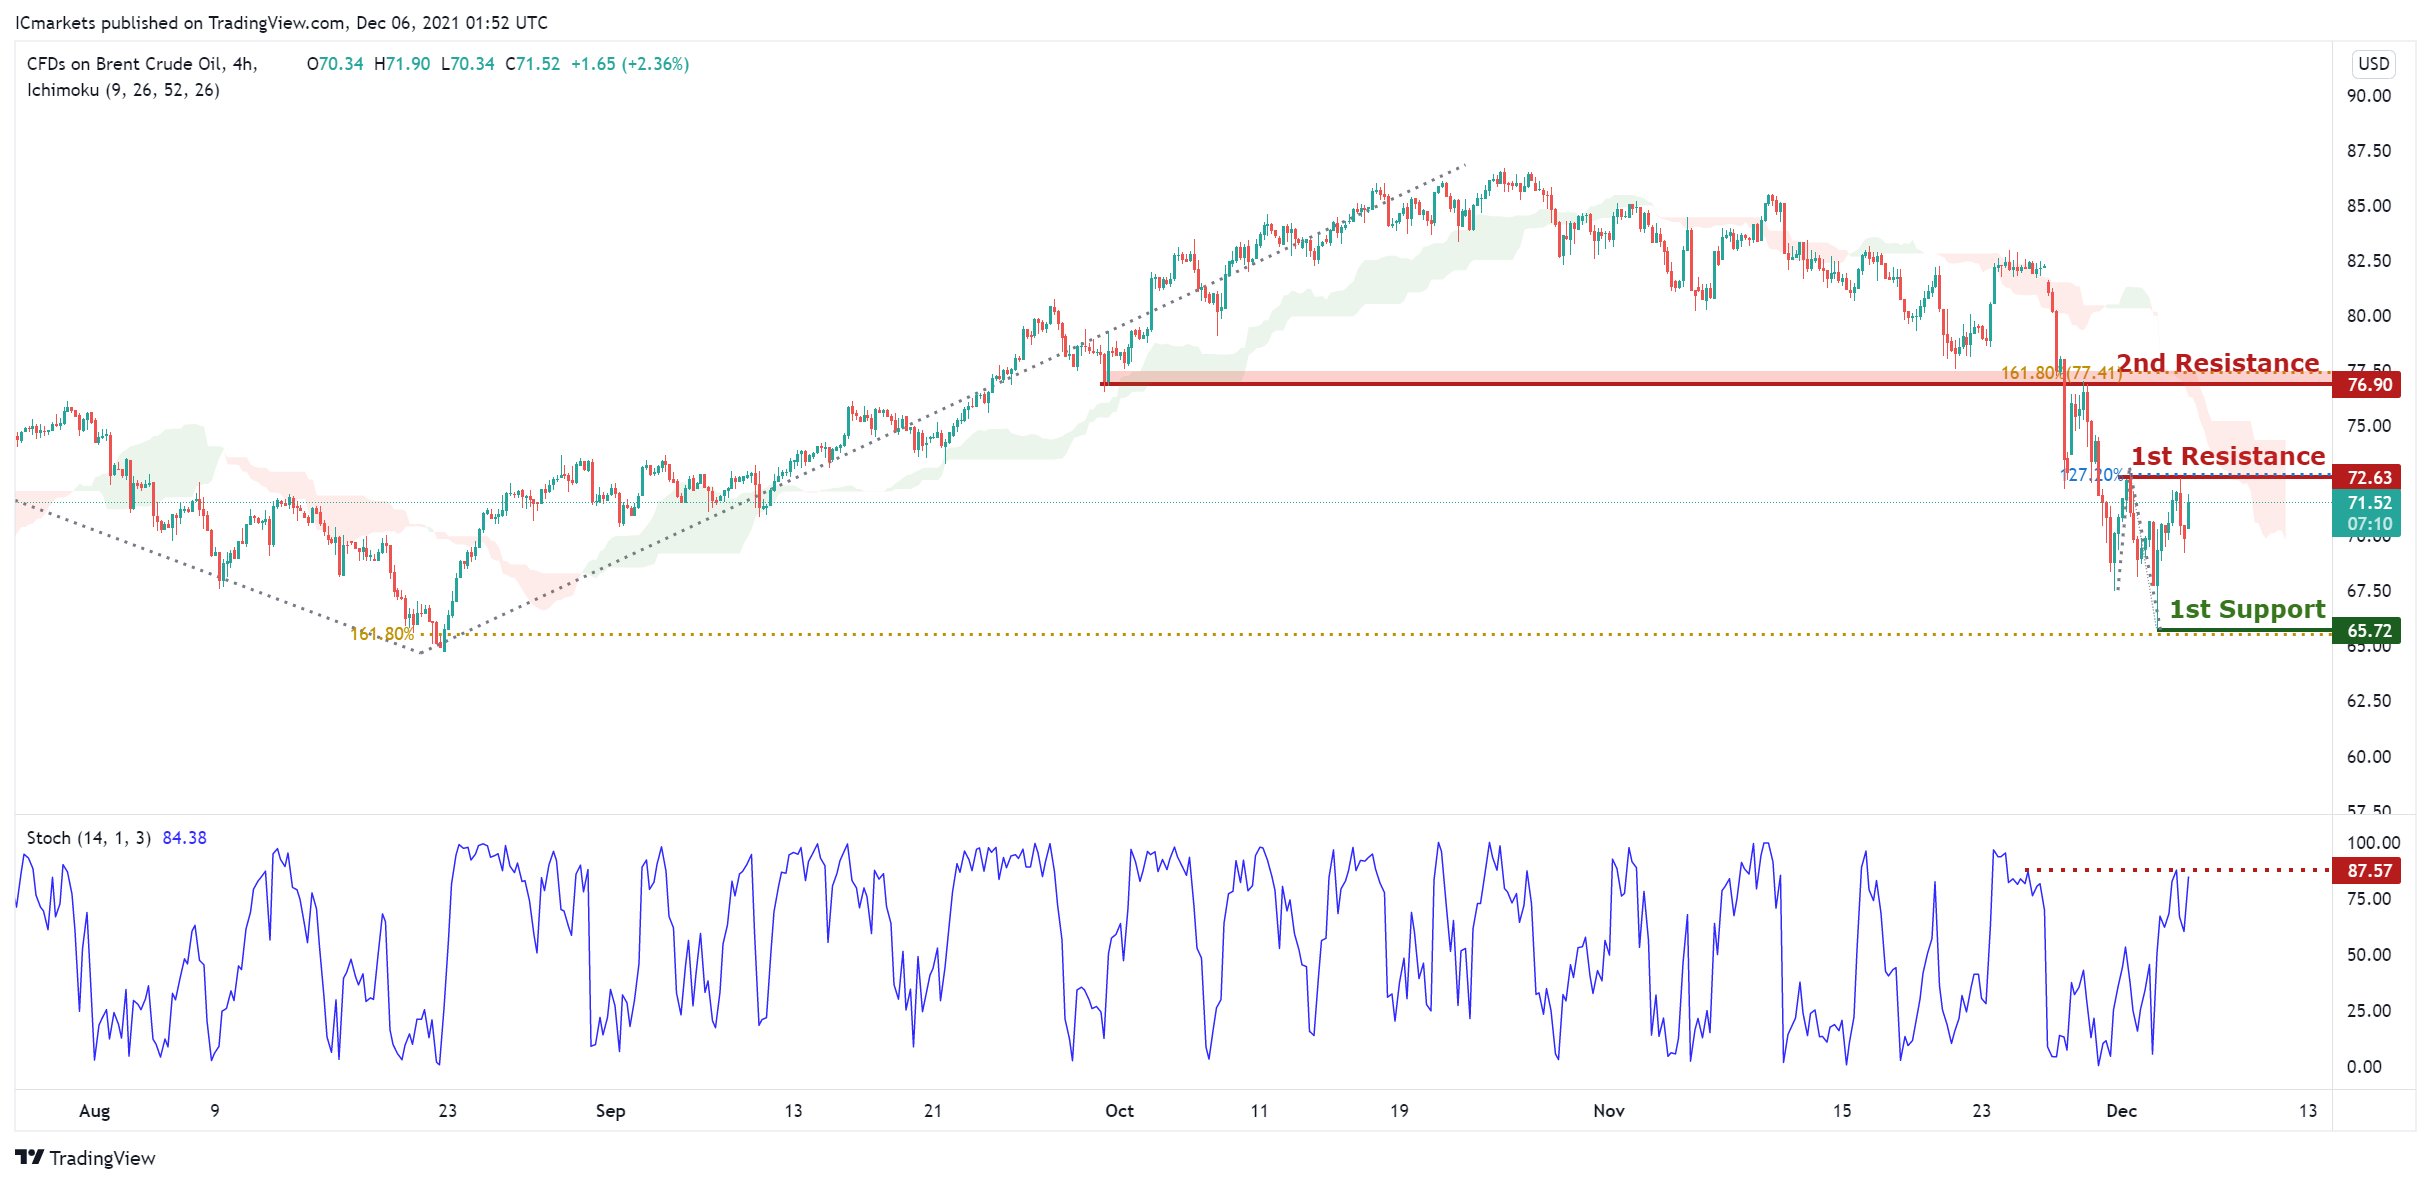
OIL:
On the H4 timeframe, with price approaching the resistance on the stochastics indicator and the horizontal graphical level and moving below the ichimoku cloud, we have a bearish bias that price will drop to 1st support at 65.72 in line with the 161.8% Fibonacci projection and horizontal swing low support from 1st resistance at 72.63 in line with the horizontal swing high resistance and 127.2%Fibonacci projection. Alternatively, price may break 1st resistance structure and head for 2nd resistance at 76.90 in line with the horizontal overlap support.
Areas of consideration:
- H4 time frame, 1st resistance of 72.63
- H4 time frame, 1st support of 72
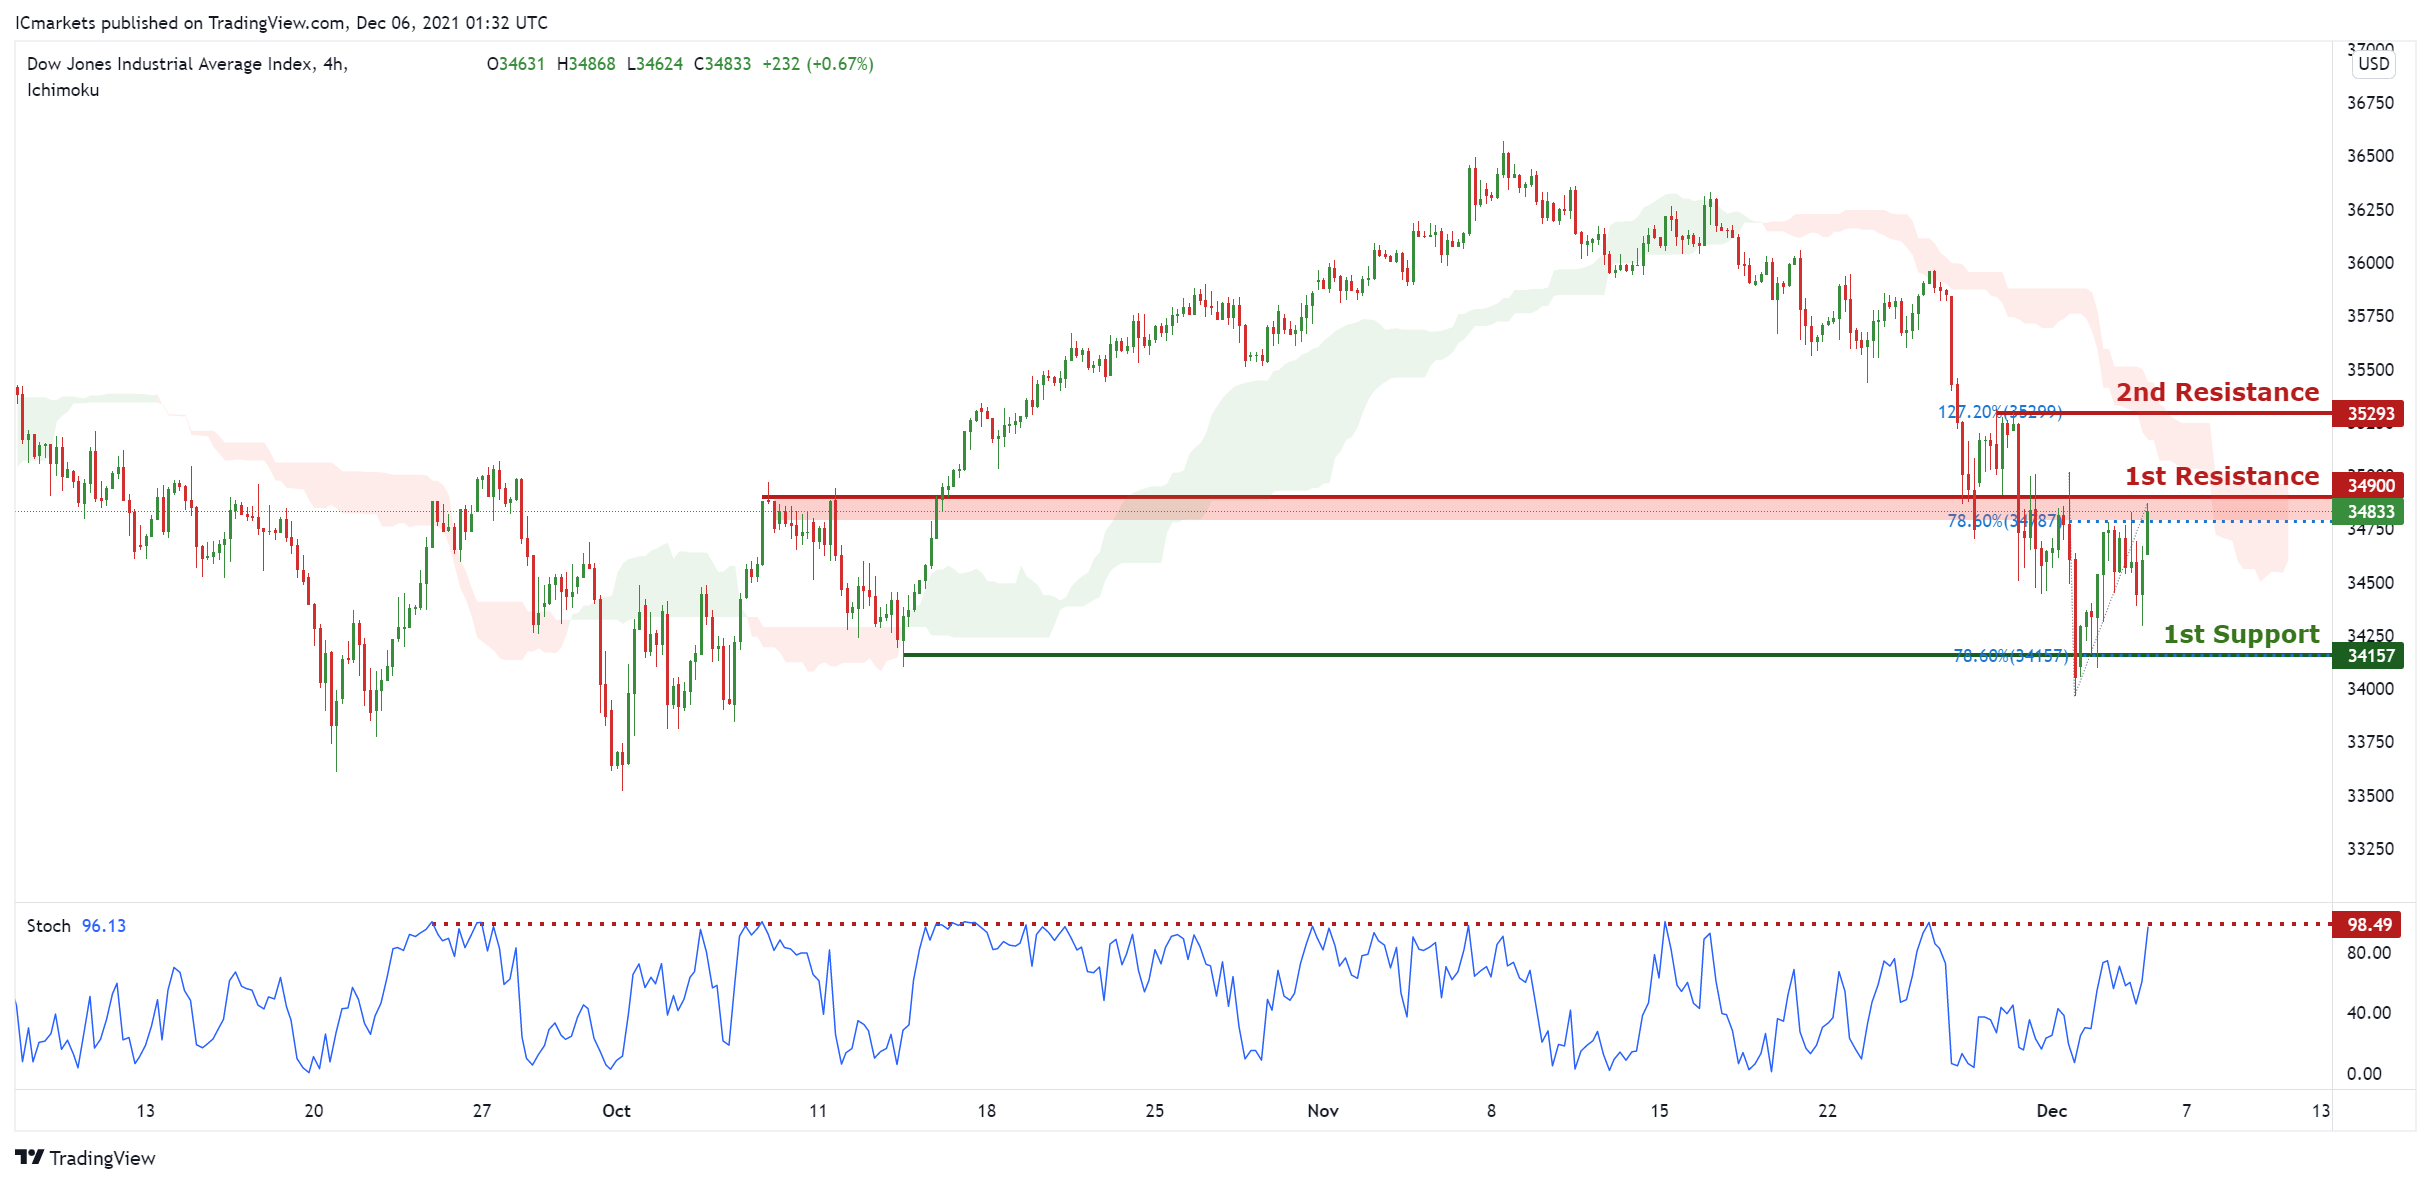
Dow Jones Industrial Average:
On the H4, with price approaching the resistance on the stochastics indicator and the horizontal graphical level and moving below the ichimoku cloud, we are bias that price will drop to 1st support at 34157 in line with the horizontal swing low support and 78.6% Fibonacci retracement from 1st resistance at 34900 in line with the 78.6% Fibonacci extension. Alternatively, price may break 1st resistance structure and head for 2nd resistance at 35293 in line with the 127.2% Fibonacci extension.
- 4H resistance at 34900
- 4H support at 34157
The accuracy, completeness and timeliness of the information contained on this site cannot be guaranteed. IC Markets does not warranty, guarantee or make any representations, or assume any liability regarding financial results based on the use of the information in the site.
News, views, opinions, recommendations and other information obtained from sources outside of www.icmarkets.com.au, used in this site are believed to be reliable, but we cannot guarantee their accuracy or completeness. All such information is subject to change at any time without notice. IC Markets assumes no responsibility for the content of any linked site.
The fact that such links may exist does not indicate approval or endorsement of any material contained on any linked site. IC Markets is not liable for any harm caused by the transmission, through accessing the services or information on this site, of a computer virus, or other computer code or programming device that might be used to access, delete, damage, disable, disrupt or otherwise impede in any manner, the operation of the site or of any user’s software, hardware, data or property.


