
EUR/USD:
Weekly gain/loss: +0.20%
Weekly closing price: 1.2316
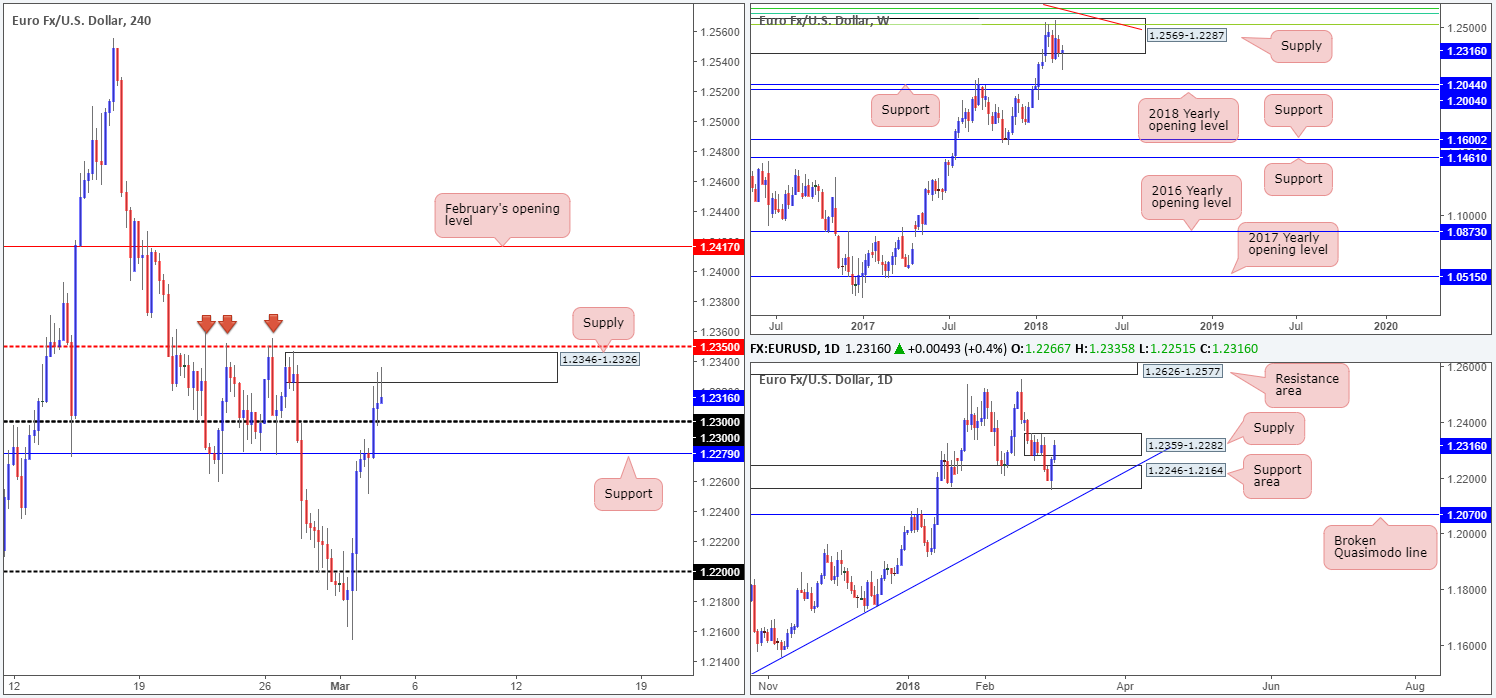
Despite an earnest attempt to drive lower from weekly supply at 1.2569-1.2287 last week, the shared currency recouped its losses and concluded the week back within the lower limits of the said supply. Since late January, the pair ‘s upside has been capped by this area, which, as you can see, also boasts a nice-looking Fibonacci resistance cluster (see below) and a long-term weekly trendline resistance (taken from the high 1.6038) around the top of its base:
- 61.8% Fib resistance at 1.2604 taken from the high 1.3993.
- 50.0% Fib resistance at 1.2644 taken from the high 1.4940.
- 38.2% Fib resistance at 1.2519 taken from the high 1.6038.
Behind last week’s rebound (technically speaking) was a daily bullish engulfing candle printed from a daily support area at 1.2246-1.2164. Given that this zone dates back to as far as Dec 2014 and already proved its worth on two occasions so far this year; this was not an area to overlook. The move from here, however, forced daily price into a base of daily supply coming in at 1.2359-1.2282.
A brief look at recent dealings on the H4 timeframe show H4 price ended Friday’s segment crossing above the 1.23 handle and shaking hands with a strong-looking H4 supply area at 1.2346-1.2326.
(Fundamentally, the market reflected a bullish tone following Trump’s announcement regarding tariffs on imported steel and aluminum. The announcement was reinforced on Friday with Trump’s mention to a ‘trade war’. The risk-off tone affected the greenback, and thus equally affected the euro).
Potential trading zones:
The current H4 supply – coupled with a nearby H4 mid-level resistance at 1.2350, along with the current daily and weekly supply areas – is likely to hinder further upside today/early on in the week. It would only be following a decisive H4 push above 1.2350 would our team label this market a potential buy up to February’s opening level at 1.2417.
While selling this market may seem the logical approach in view of the current resistances in play, the 1.23 handle and nearby H4 support at 1.2279, along with the top edge of the aforementioned daily support area, is highly likely to impede downside.
Therefore, from a technical standpoint, we do not see much to hang our hat on at this time as far as trading opportunities go. And as such, opting to stand on the sidelines today may be the better the path to take.
Data points to consider: US ISM non-manufacturing PMI at 3pm; FOMC member Quarles speaks at 6.15pm GMT.
Areas worthy of attention:
Supports: 1.23 handle; 1.2279; 1.2246-1.2164.
Resistances: 1.2350; 1.2346-1.2326; 1.2359-1.2282; 1.2569-1.2287; weekly trendline resistance; weekly Fib cluster.
GBP/USD:
Weekly gain/loss: -1.20%
Weekly closing price: 1.3799
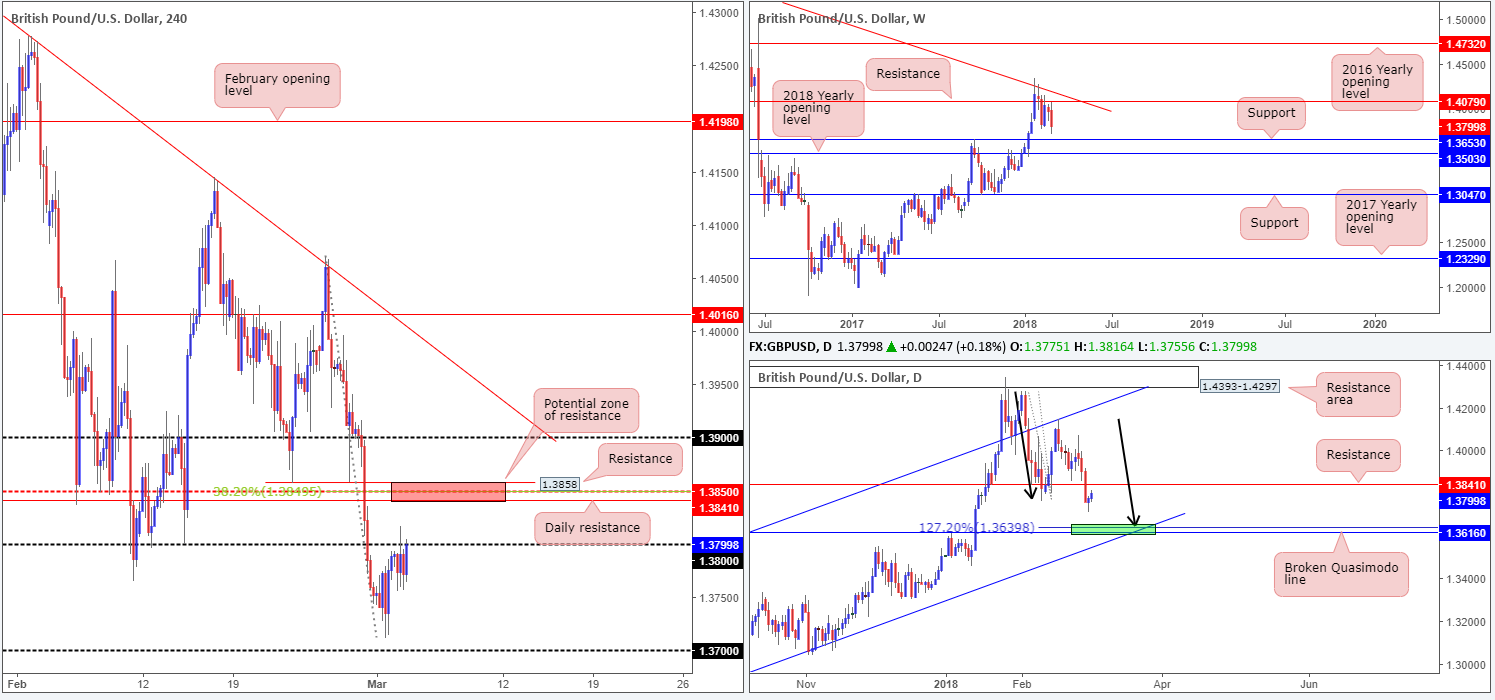
Leaving the underside of the weekly resistance level at 1.4079 unchallenged by less than 10 pips, the British pound fell sharply over the course of last week’s trade. Forming a clear-cut weekly bearish engulfing candle, weekly price is now placed within striking distance (on the weekly timeframe that is) of weekly support at 1.3653 and the 2018 yearly opening level at 1.3503. Therefore, these are certainly levels to keep tabs on this week.
Structure on the daily timeframe brings together a daily channel support (extended from the low 1.2108), a daily AB=CD 127.2% Fib ext. point at 1.3639 and a daily broken Quasimodo line at 1.3616 (green zone). What’s also attractive about this small area is that it converges nearby the weekly support mentioned above at 1.3653! Before this green daily support zone is brought into the fray, nevertheless, traders need to prepare themselves for a possible retest of daily resistance pegged at 1.3841.
Branching across to the H4 candles, we can see that the 1.38 handle proved somewhat troublesome to overcome on Friday, as cable was unable to benefit from the waning US dollar. We also had the pleasure of UK’s PM May speaking about the future trading relationship between the UK and the EU. The impact saw the GBP post a modest drop, but it was not really anything to shout about.
Potential trading zones:
With weekly price likely going to be honing in on the aforementioned weekly supports this week, traders may want to try and take advantage of this potential move lower. Although 1.38 could hold, the team has noted a potentially stronger base of resistance directly above marked in red. Comprised of a H4 resistance level at 1.3858, a H4 38.2% Fib resistance at 1.3849, a H4 mid-level resistance at 1.3850 and the daily resistance base mentioned above at 1.3841, this area, in our opinion, has a healthy chance of holding and pushing price lower this week. A close below the 1.38 band from this angle would be a strong cue to reduce risk to breakeven and begin thinking about trailing price lower.
Data points to consider: UK services PMI at 9.30am; US ISM non-manufacturing PMI at 3pm; FOMC member Quarles speaks at 6.15pm GMT.
Areas worthy of attention:
Supports: 1.3616/1.3639; 1.3653; 1.3503.
Resistances: 1.38 handle; 1.3858/1.3841; 1.4079.
AUD/USD:
Weekly gain/loss: -1.03%
Weekly closing price: 0.7760
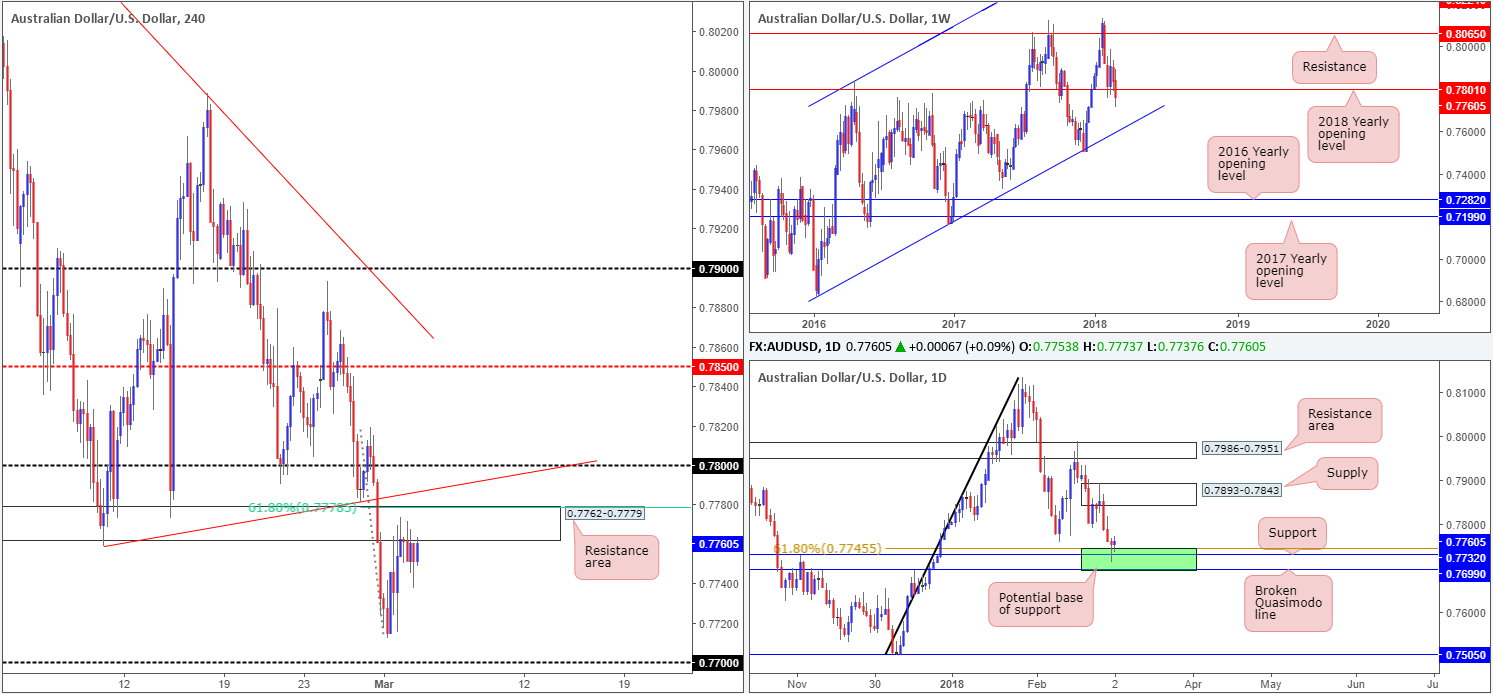
Over the course of last week’s session, the commodity currency sustained further losses for a second straight week, erasing 76 pips off its value and closing beneath the 2018 yearly opening level at 0.7801.Technically speaking, this may see the Aussie strike lower this week and potentially attempt to connect with a weekly channel support taken from the low 0.6827.
Despite recording losses, the pair is seen interacting with a particularly interesting area of support on the daily timeframe fixed between 0.7699/0.7745 (comprised of a daily broken Quasimodo line at 0.7699, a daily support at 0.7732 and a 61.8% daily Fib support at 0.7745). The next upside target from this barrier can be seen in the shape of a daily supply zone drawn from 0.7893-0.7843.
A quick recap of H4 movement on Friday shows that the Aussie, much like the British pound, failed to benefit from the persistent USD selling bias. As you can see, the pair held firm around the underside of a H4 resistance area at 0.7762-0.7779, which happens to be positioned just beneath a H4 trendline resistance taken from the low 0.7758 and also nearby a 61.8% H4 Fib resistance at 0.7778.
Potential trading zones:
Despite the current H4 resistance area holding firm, we would not deem this a suitable sell zone. This is because weekly price could retest the 2018 yearly opening level at 0.7801 (effectively the 0.78 handle on the H4 timeframe) as resistance this week, and also due to daily price trading from a base of support.
The 0.78 handle would, therefore, be a better location to hunt for shorts today/early this week. Though, at the same time, one would still need to keep in mind that daily price could potentially push above this number and target the aforementioned daily supply.
Data points to consider: AUD building approvals m/m and AUD company operating profits q/q at 12.30am; China Caixin services PMI at 1.45am; US ISM non-manufacturing PMI at 3pm; FOMC member Quarles speaks at 6.15pm GMT.
Areas worthy of attention:
Supports: 0.7699/0.7745.
Resistances: 0.78 handle; H4 trendline resistance; 0.7778; 0.7801; 0.7762-0.7779; 0.7893-0.7843.
USD/JPY:
Weekly gain/loss: -1.07%
Weekly closing price: 105.71
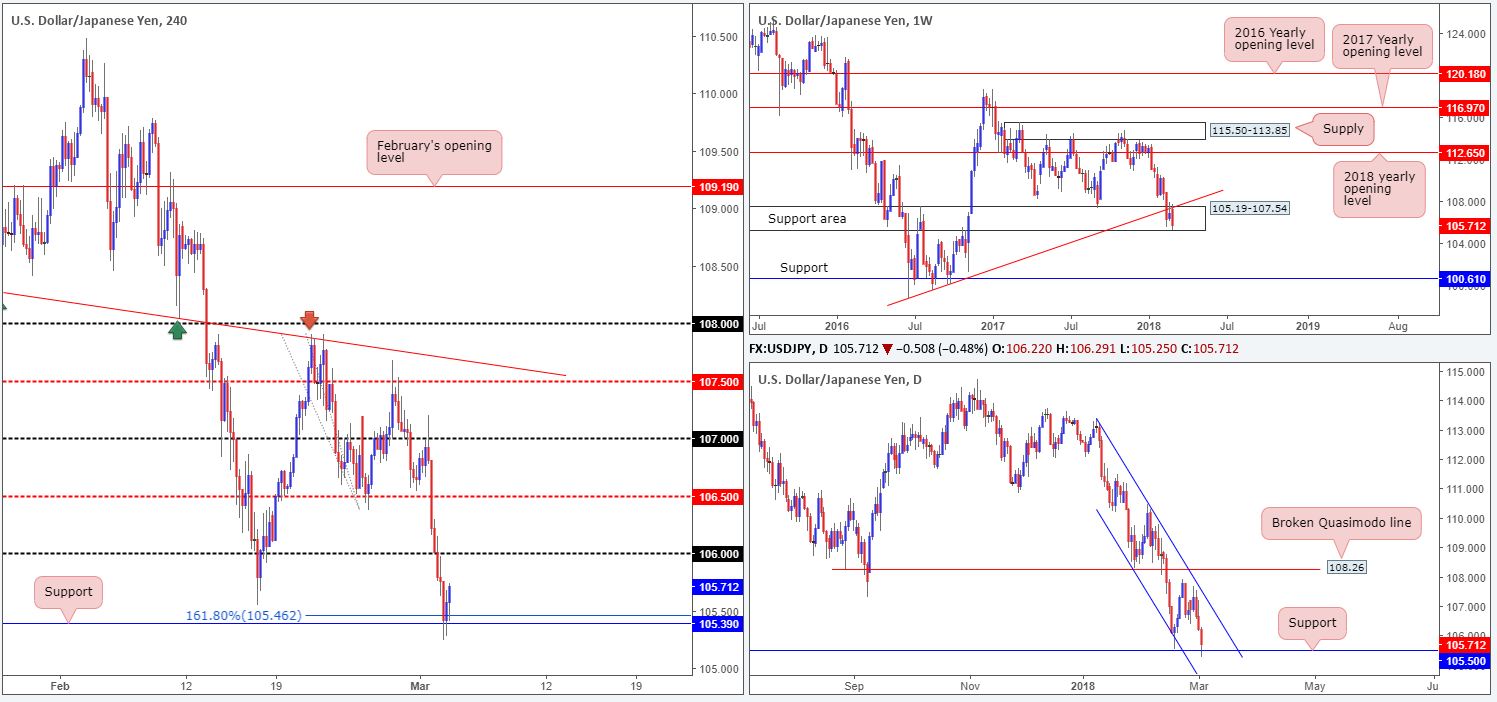
The weekly support area at 105.19-107.54, as you can see, remains in the fray. But, for how long? Price made an attempt to strike higher levels but was unable to gain much ground thanks to a weekly trendline support-turned resistance extended from the low 98.78. The result of this produced a near-full-bodied weekly bearish candle last week which came close to taking out the lower edge of the noted weekly support area.
The story on the daily chart, nonetheless, reveals that the unit is currently compressed within a daily descending channel formation (113.38/108.28). Also in view is a daily support level penciled in at 105.50 that boasts a reasonably sound history.
Looking at Friday’s action on the H4 timeframe, price crossed below the Feb 16 low 105.55 and crossed swords with a long-standing H4 support band coming in at 105.39 and a nearby 161.8% H4 Fib ext. point at 105.46. The US dollar remains in a weak position against the Japanese yen on trade war concerns, and on the back of recent comments from the BoJ Gov. mentioning that the exit of the QQE program could begin when inflation hits 2%.
Potential trading zones:
Selling current bearish sentiment, as strong as it may be right now, might not be a high-probability move. With H4 support at 105.39, daily support at 105.50 and the weekly support area at 105.19-107.54 still in motion, selling is a chancy move, in our opinion. Once, or indeed if, we clear the current H4 support band, however, then we believe one can begin thinking about looking to execute a selling strategy. Until then though, you may be better off sitting on your hands!
So does that mean hunting for long opportunities is the route to take? Before becoming buyers, you may want to note that above the 106 handle, upside is limited by the daily channel resistance etched from the high 113.38.
On account of the above, opting to remain on the sidelines is likely the better option at least for today.
Data points to consider: US ISM non-manufacturing PMI at 3pm; FOMC member Quarles speaks at 6.15pm GMT.
Areas worthy of attention:
Supports: 105.39; 105.46; 105.50; 105.19-107.54.
Resistances: 106 handle; weekly trendline resistance; daily channel resistance.
USD/CAD:
Weekly gain/loss: +1.99%
Weekly closing price: 1.2884
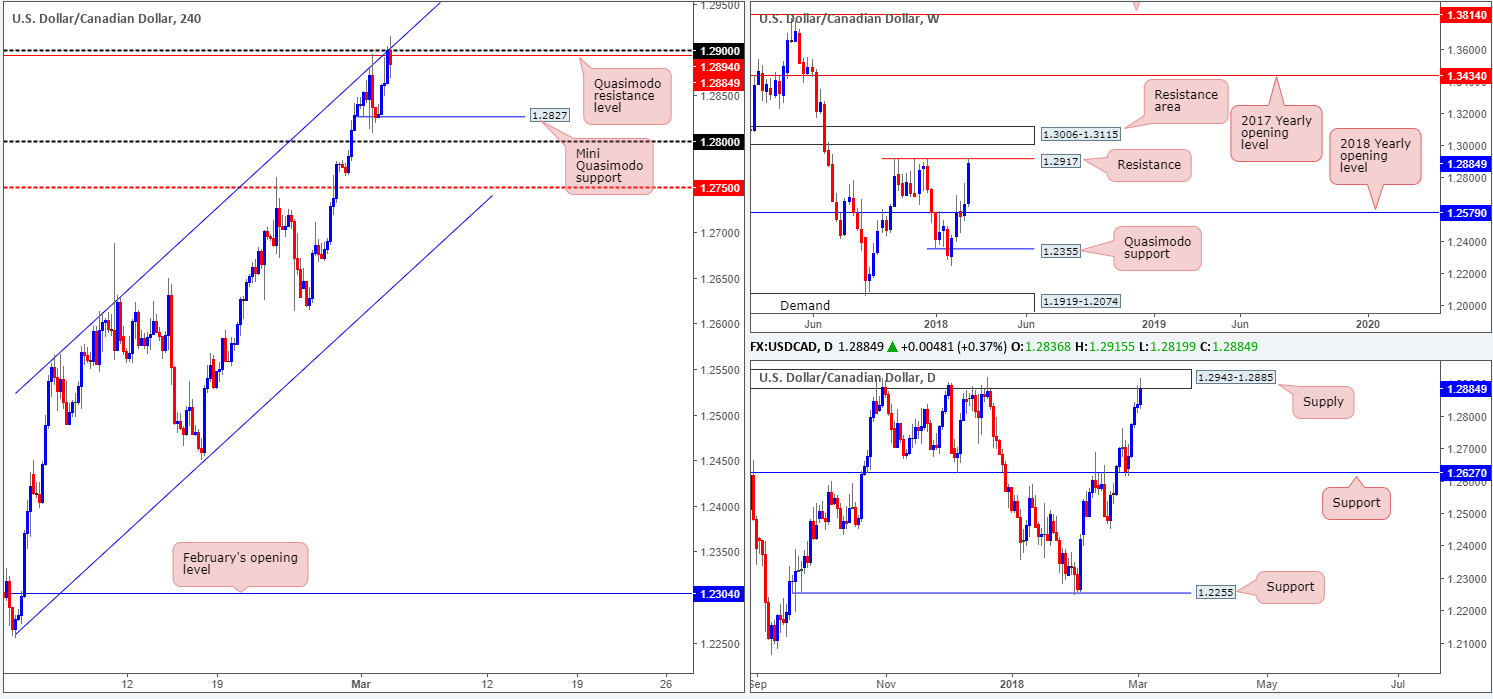
Following a half-hearted weekly close above the 2018 yearly opening level at 1.2579, last week’s movement saw the pair chalk up a near-full-bodied weekly bull candle and come within a pip of striking a weekly resistance level at 1.2917. As demonstrated on the weekly chart, there’s also a strong-looking weekly resistance area at 1.3006-1.3115 lurking just above the current resistance.
Turning our attention to the daily timeframe, we can see that the US dollar clearly outperformed against its Canadian counterpart last week, printing five consecutive daily bull candles. What’s also notable from a technical perspective here is that the unit wrapped up the week terminating around the underside of a daily supply area at 1.2943-1.2885, which houses the noted weekly resistance level.
Buying, as can be seen on the H4 timeframe, did slow, however, as we entered into the later parts of the week. Connecting with a H4 Quasimodo resistance at 1.2894, a nearby round number at 1.29 and a H4 channel resistance line extended from the high 1.2565, this is clearly proving a difficult base to overcome. Technically, though, this should not really come as too much of a surprise given that the H4 Quasimodo is bolstered by the aforementioned weekly resistance level and daily supply zone.
Potential trading zones:
While a lot of traders will be excited about last week’s advance, the team believes a correction could be in store. This is simply down to the technical landscape this market offers right now. In fact, a short from the 1.29 region is a strong sell, in our humble view, whereby one can position stops above the current daily supply edge at 1.2945. From this angle, the first take-profit target could be set at the H4 mini Quasimodo support at 1.2827, followed closely by the 1.28 handle.
Data points to consider: US ISM non-manufacturing PMI at 3pm; FOMC member Quarles speaks at 6.15pm GMT.
Areas worthy of attention:
Supports: 1.28 handle; 1.2827.
Resistances: 1.29 handle; 1.2894; H4 channel resistance; 1.2943-1.2885; 1.2917; 1.3006-1.3115.
USD/CHF:
Weekly gain/loss: +0.06%
Weekly closing price: 0.9374
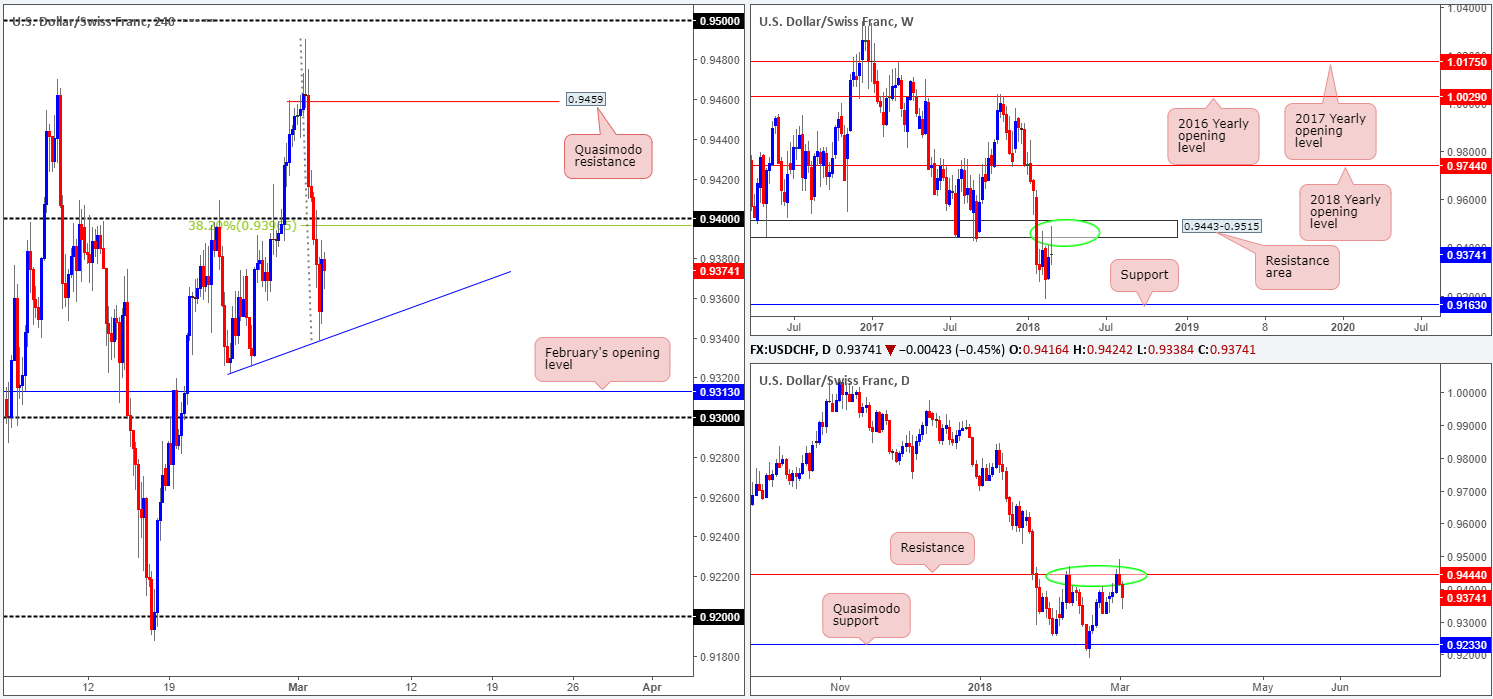
Having seen the weekly area printed at 0.9443-0.9515 hold on several occasions as support in the past, it was not really a surprise to see the zone hold firm as resistance last week. Continued selling from this point may bring the weekly support level at 0.9163 on to the radar this week. This level also boasts a strong history.
In a similar fashion to the weekly timeframe, the daily resistance level at 0.9444 (represents the lower edge of the weekly resistance area) also held ground, pushing the unit to lows of 0.9338. The next downside target on this scale, however, falls in around the 0.9233 range: a Quasimodo support level.
The safe-haven CHF was heavily bought on Thursday after Trump’s announcement regarding tariffs on imported steel and aluminum. The announcement was reinforced on Friday with Trump’s mention to a ‘trade war’. H4 price eventually smashed through bids attempting to control the 0.94 band, before mildly paring losses from a local H4 trendline support etched from the low 0.9322 into the closing bell.
Potential trading zones:
With the H4 candles lurking a few pips beneath the 0.94 handle, which, as you can see, merges with a 38.2% H4 Fib resistance level at 0.9397, this area could be good for an intraday bounce lower today. Should this trade come to fruition, and the pair consumes the aforementioned H4 trendline support, then we could be in for a move down to at least February’s opening level at 0.9313, shadowed closely by the 0.93 handle.
A violation of 0.94, on the other hand, places the spotlight on the H4 Quasimodo resistance level at 0.9459 for possible shorts.
Data points to consider: US ISM non-manufacturing PMI at 3pm; FOMC member Quarles speaks at 6.15pm GMT.
Areas worthy of attention:
Supports: 0.93 handle; 0.9313; H4 trendline support; 0.9233; 0.9163.
Resistances: 0.94 handle; 0.9395; 0.9444; 0.9443-0.9515.
DOW 30:
Weekly gain/loss: -3.05%
Weekly closing price: 24538
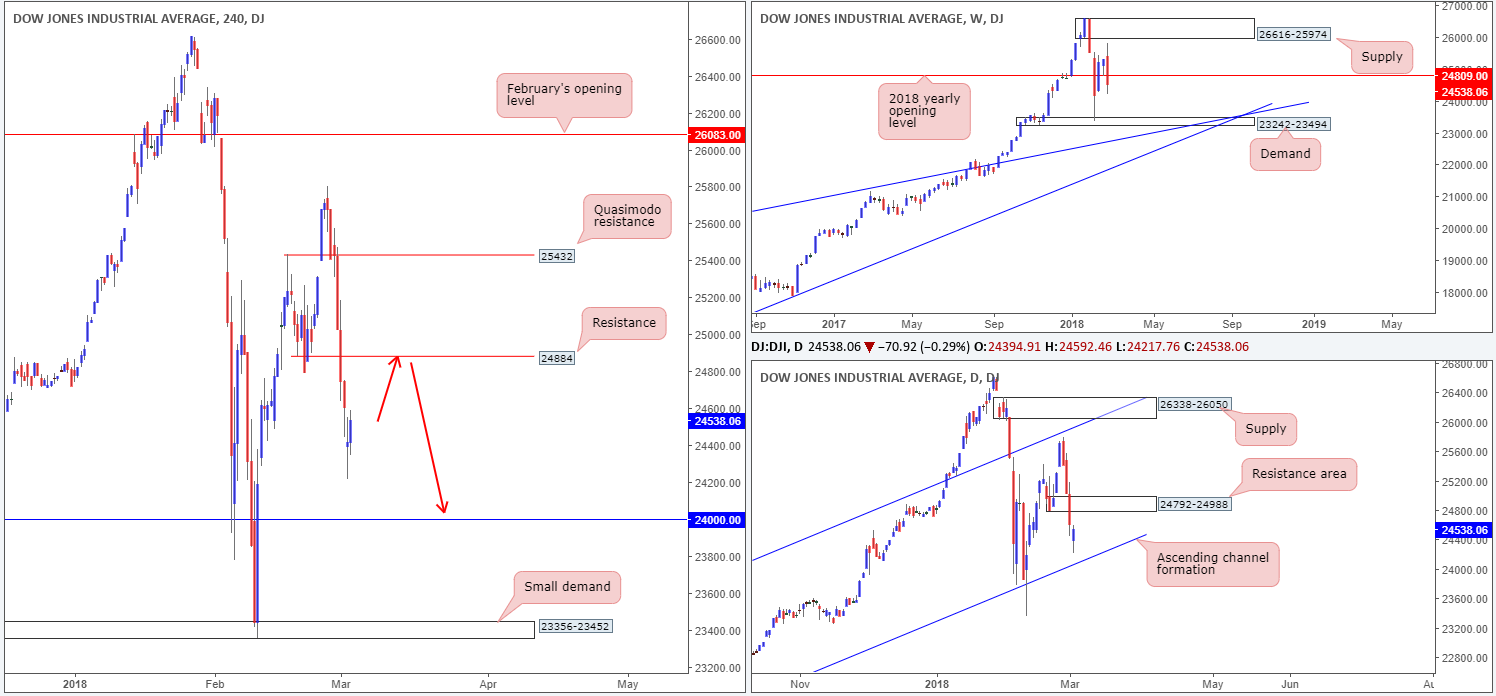
After a solid rejection seen from a small weekly demand area at 23242-23494, and two subsequent weeks of gains above the 2018 yearly opening level at 24809, the index recently came to a screeching halt just ahead of a weekly supply base at 26616-25974. Forming a weekly bearish engulfing pattern, last week’s action aggressively turned lower, trading back beneath the 2018 line and erasing a large portion of recent upside. Therefore, the aforementioned weekly demand is in sight going into the new week.
Branching down to the daily timeframe, it’s clear to see the unit bottomed just ahead of a daily channel support extended from the low 17883, after roaring through a daily demand area at 24792-24988 (now acting resistance zone).
Last week’s downturn, influenced by Federal Reserve Chairman Jerome Powell’s testimony before congress and US President Trump’s announcement regarding tariffs on imported steel and aluminum, saw multiple H4 tech supports destroyed. To the upside, H4 resistance stands at 24884, whereas lower on the curve we have support potentially coming in from the 24K mark.
Potential trading zones:
As far as we’re concerned, the most logical trade point in this market right now is the noted H4 resistance at 24884. Not only is it positioned within the walls of a daily resistance area at 24792-24988, it is also seen plotted not too far from the 2018 yearly opening band at 24809. Should your trading plan agree, we would also recommend waiting for additional candle confirmation in the form a H4 full or near-full-bodied bearish candle. This will help avoid a fakeout and emphasize bearish intent.
Data points to consider: US ISM non-manufacturing PMI at 3pm; FOMC member Quarles speaks at 6.15pm GMT.
Areas worthy of attention:
Supports: 24000; daily channel support; 23242-23494.
Resistances: 24884; 24792-24988; 24809.
GOLD:
Weekly gain/loss: -0.56%
Weekly closing price: 1322.3
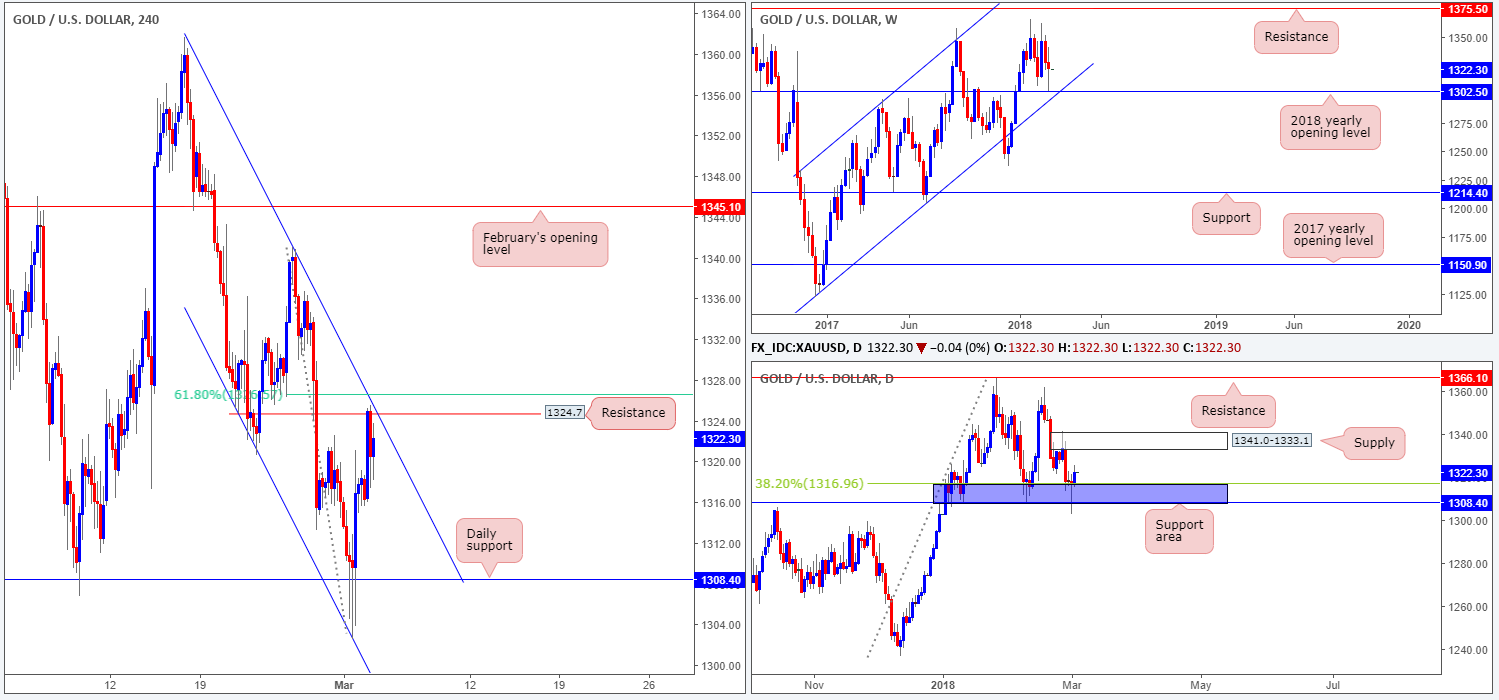
As is evident from the weekly timeframe, the price of gold came within a few a pips of connecting with the 2018 yearly opening level at 1302.5, before printing an end-of-week correction tail. It might also be worth noting that this line converges with a long-term weekly channel support extended from the low 1122.8. Further upside from this point could drag the unit in the direction of weekly resistance at 1375.5, followed closely by a weekly 38.2% Fib resistance at 1381.0 (not seen on the screen).
Meanwhile, down on the daily timeframe, recent action saw a daily support area marked in blue at 1308.4-1316.9 brought into the fight (comprised of a daily support and 38.2% Fib support level). Notice here that the 2018 yearly opening line mentioned above is situated beneath this area. A push higher from here has the daily supply zone at 1341.0-1333.1 to target.
The daily support level at 1308.4 (the lower edge of the current daily support area) seen on the H4 timeframe provided the yellow metal a platform to trade higher on Thursday, following three back-to-back H4 buying tails. Fueled by a downturn in US dollar markets, this eventually saw H4 price elevate up to H4 resistance at 1324.7, which is closely positioned to a 61.8% H4 Fib resistance at 1326.6 and a H4 channel resistance taken from the high 1361.7.
Potential trading zones:
Selling from the current H4 resistance level is tempting when one considers its surrounding confluence. However, taking into account that both weekly and daily structure suggests further upside could be on the horizon, a short in this market does not look quite so attractive. This is, unless of course, you’re content with trading into potential higher-timeframe opposition.
Usually, in cases such as these one could simply wait and see if price breaks higher. This would be particularly difficult in this situation, though, as beyond 1324.7, upside is limited by a nearby daily supply zone mentioned above at 1341.0-1333.1. Therefore, it appears that irrespective of the direction one selects, there isn’t a clear path seen at the moment.
Areas worthy of attention:
Supports: 1308.4/1316.9; 1302.5; weekly channel support.
Resistances: 1324.7; 1326.6; H4 channel resistance.
This site has been designed for informational and educational purposes only and does not constitute an offer to sell nor a solicitation of an offer to buy any products which may be referenced upon the site. The services and information provided through this site are for personal, non-commercial, educational use and display. IC Markets does not provide personal trading advice through this site and does not represent that the products or services discussed are suitable for any trader. Traders are advised not to rely on any information contained in the site in the process of making a fully informed decision.
This site may include market analysis. All ideas, opinions, and/or forecasts, expressed or implied herein, information, charts or examples contained in the lessons, are for informational and educational purposes only and should not be construed as a recommendation to invest, trade, and/or speculate in the markets. Any trades, and/or speculations made in light of the ideas, opinions, and/or forecasts, expressed or implied herein, are committed at your own risk, financial or otherwise.
The use of the site is agreement that the site is for informational and educational purposes only and does not constitute advice in any form in the furtherance of any trade or trading decisions.
The accuracy, completeness and timeliness of the information contained on this site cannot be guaranteed. IC Markets does not warranty, guarantee or make any representations, or assume any liability with regard to financial results based on the use of the information in the site.
News, views, opinions, recommendations and other information obtained from sources outside of www.icmarkets.com.au, used in this site are believed to be reliable, but we cannot guarantee their accuracy or completeness. All such information is subject to change at any time without notice. IC Markets assumes no responsibility for the content of any linked site. The fact that such links may exist does not indicate approval or endorsement of any material contained on any linked site.
IC Markets is not liable for any harm caused by the transmission, through accessing the services or information on this site, of a computer virus, or other computer code or programming device that might be used to access, delete, damage, disable, disrupt or otherwise impede in any manner, the operation of the site or of any user’s software, hardware, data or property.


