
DXY:
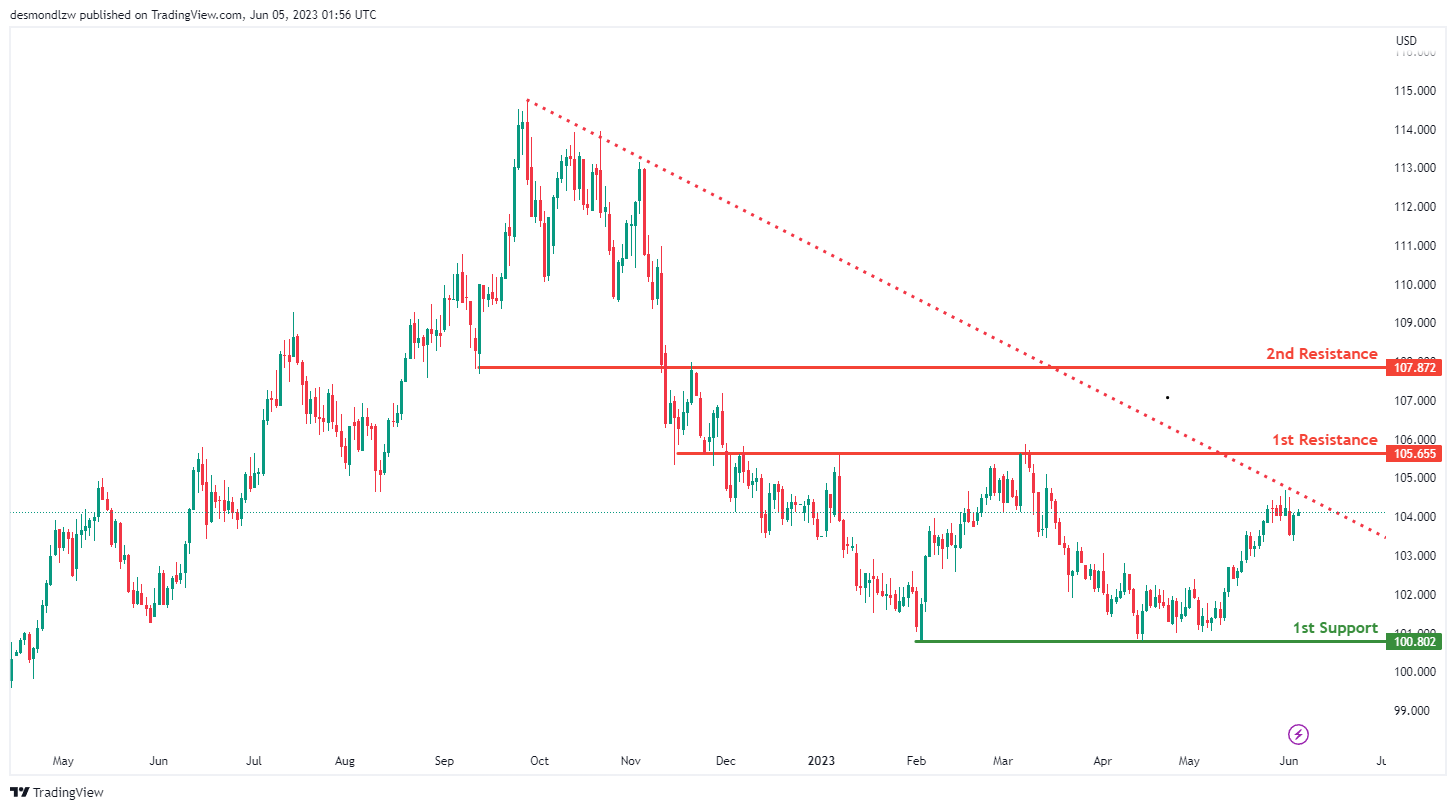
The DXY instrument is currently demonstrating bearish momentum, with the price falling below a significant descending trend line, suggesting that a continuation of bearish momentum is likely.
The price may potentially make a bearish reaction off the first resistance level and fall to the first support level. The first support level is located at 100.80 and is significant due to its role as a multi-swing low support.
The first resistance level is at 105.65, which is significant due to its status as an overlap resistance, meaning it could potentially halt or reverse any bullish price movement.
The second resistance level is at 107.87, which is also an overlap resistance, serving as another potential obstacle for bullish price movements.
EUR/USD:
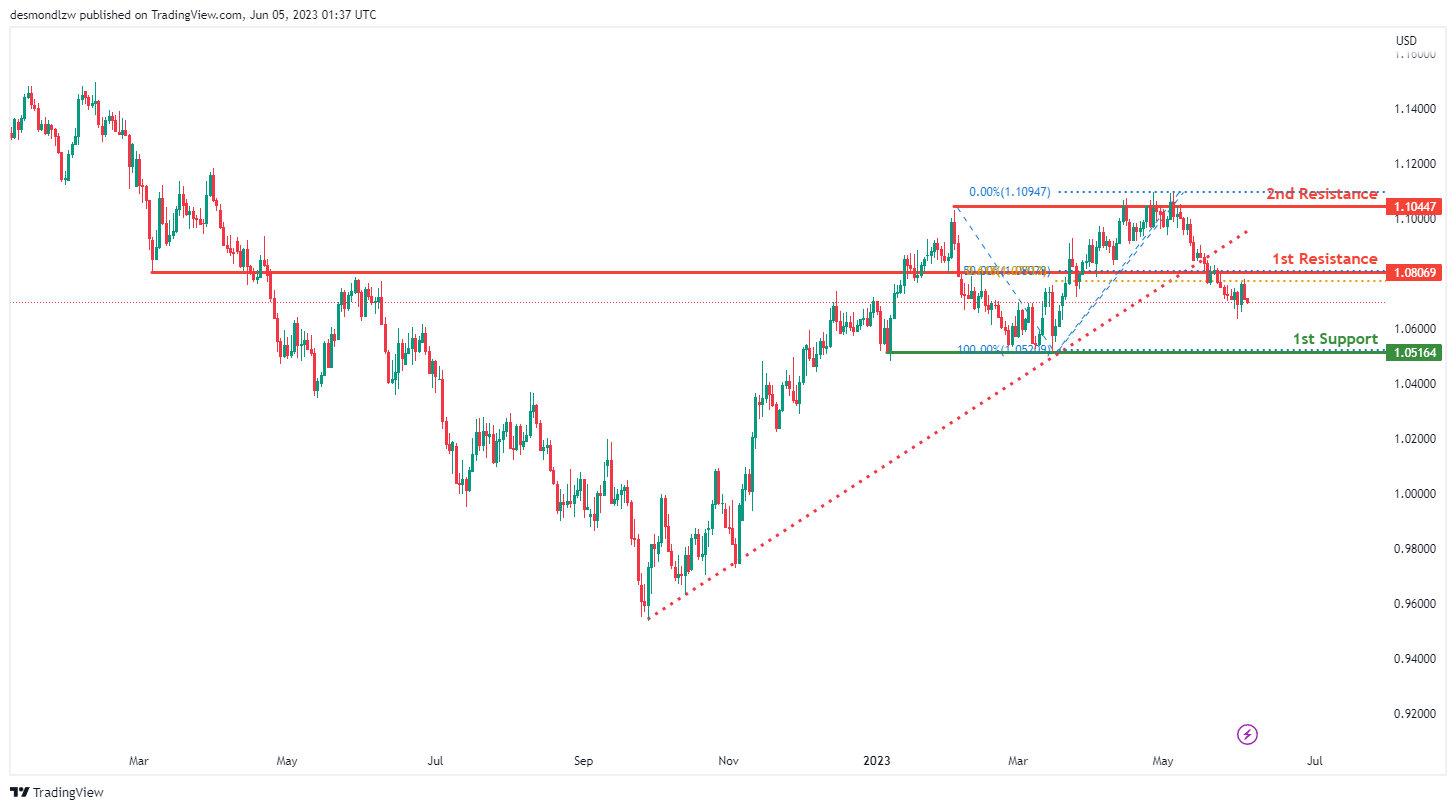
The EUR/USD instrument currently exhibits a bearish momentum. This has been triggered by the price breaking below an ascending support line, suggesting a potential continuation of the bearish move.
The price could potentially continue its bearish trend towards the first support level. This support, located at 1.0080, has a multi-swing low support status, making it a potentially significant level where buyers might enter the market and halt or reverse the bearish trend.
On the other side, the first resistance level is at 1.0806. This level is an overlap resistance and aligns with the 50% Fibonacci retracement level, giving it additional significance as a potential barrier to any bullish price movements.
The second resistance level is at 1.1044, identified as a multi-swing high resistance. This suggests it’s a significant level where sellers have previously entered the market and could do so again, potentially halting or reversing any bullish price movements.
GBP/USD:
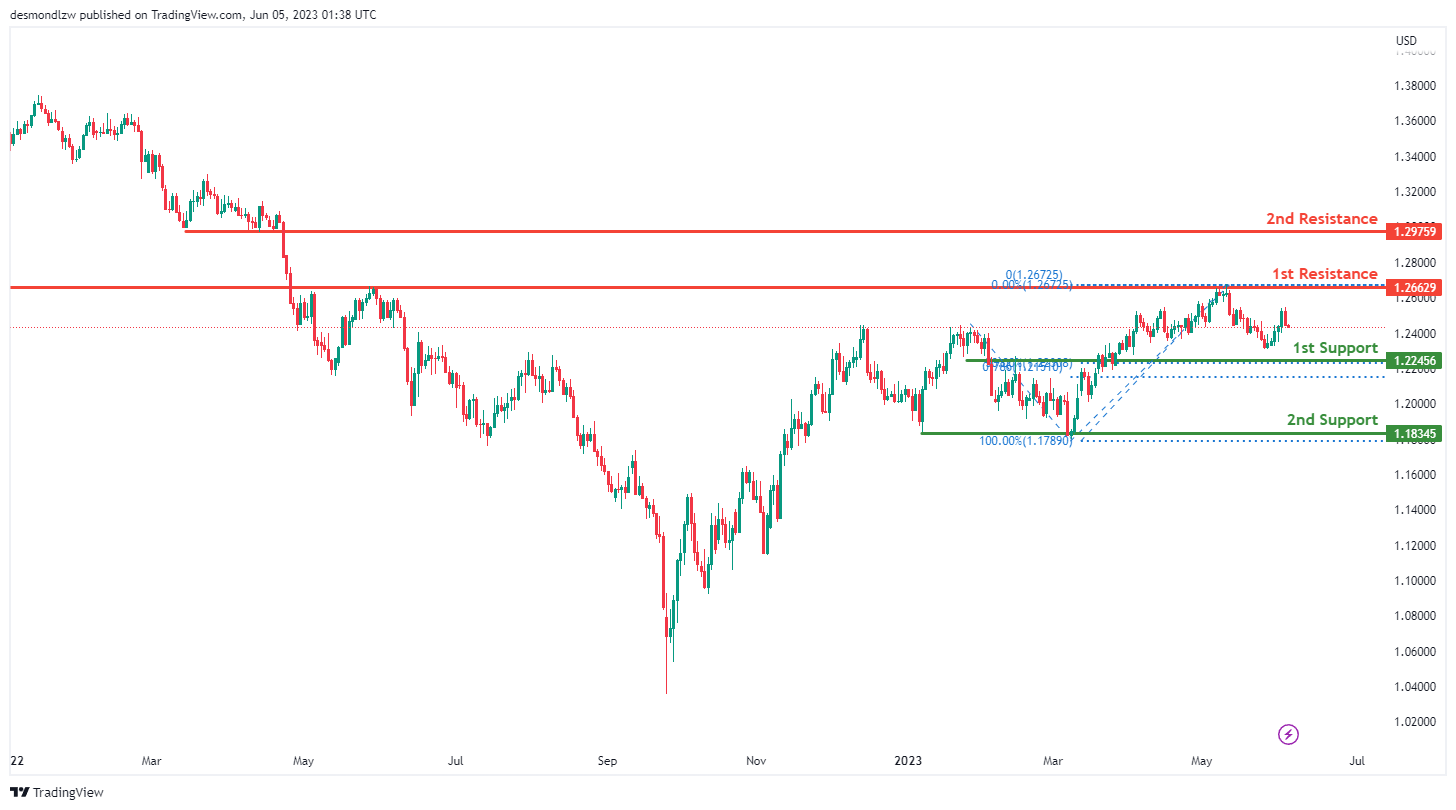
The GBP/USD instrument is currently demonstrating bearish momentum. There is potential for the price to continue its bearish trend, moving towards the first support level.
The first support is located at 1.2245, acting as an overlap support. Additionally, this level coincides with both the 50% Fibonacci retracement and the 61.80% Fibonacci projection levels, indicating significant potential for market activity and possible trend reversal.
Further down, the second support stands at 1.1834, serving as a multi-swing low support. This level could potentially attract buyers, providing a robust defense against further price drops.
On the flip side, the first resistance level is positioned at 1.2662, functioning as an overlap resistance. This could potentially pose challenges for any upward price movement.
Moreover, the second resistance level is located at 1.2975, identified as a pullback resistance. This level might act as a significant barrier to upward price momentum, with sellers likely to enter the market at this point.
USD/CHF:
The USD/CHF chart is currently showing a bullish momentum. This suggests that the price could potentially break through the first resistance level and rise towards the second resistance.
The first level of support is at 0.8977, which serves as an overlap support. This level might serve as a significant area where buyers could enter the market, thereby preventing the price from falling further.
The second level of support is at 0.8827, serving as a multi-swing low support. This level could also attract buyers, providing a robust defense against further price dips.
On the other hand, the first level of resistance is at 0.9088, which serves as an overlap resistance. This level could potentially act as a temporary barrier to the upward price movement.
The second resistance level is at 0.9197. This level serves as a pullback resistance and aligns with the 61.80% Fibonacci Retracement and the 100% Fibonacci Projection. This confluence of technical indicators might strengthen its significance, potentially posing a significant challenge to further upward price movement.
USD/JPY:
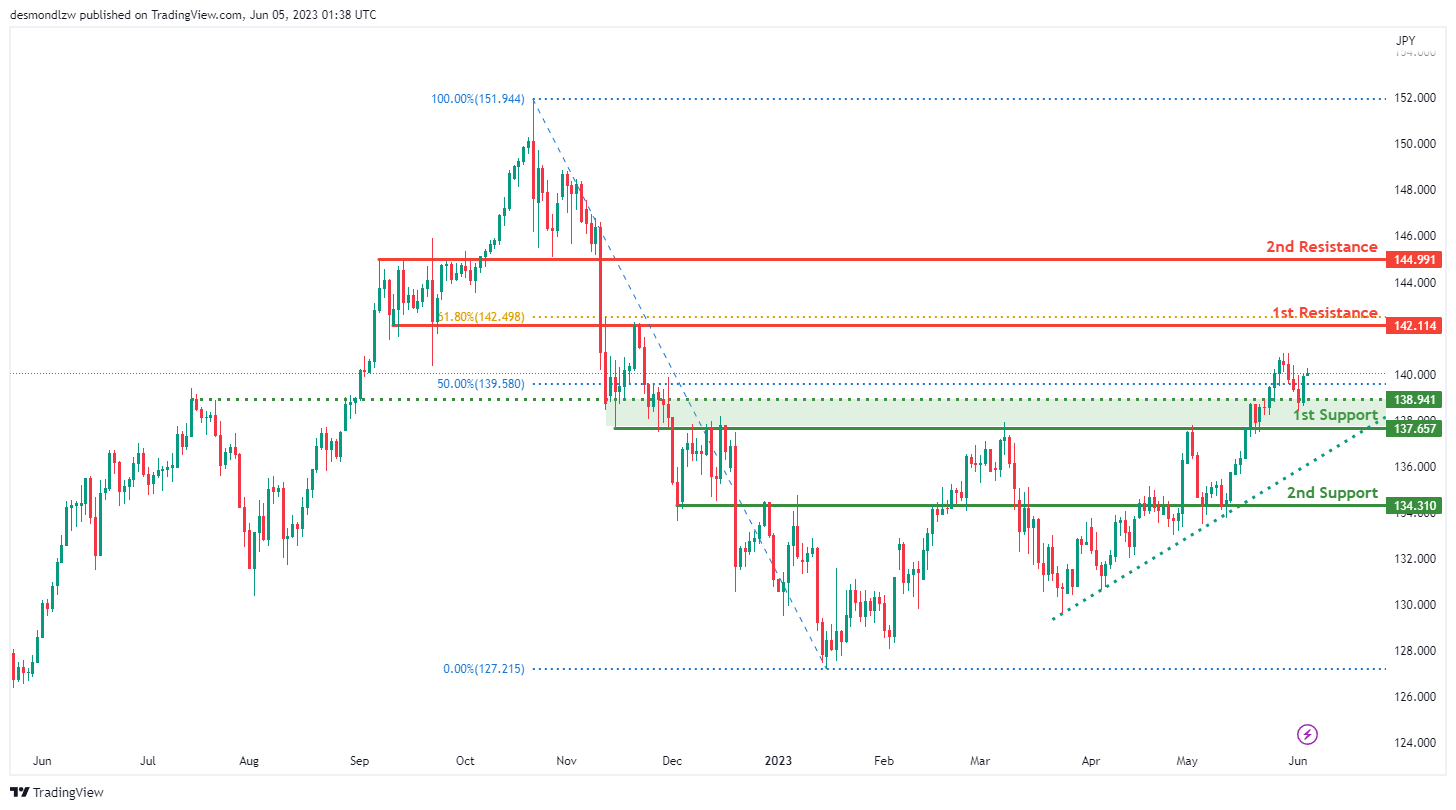
The USD/JPY chart is currently exhibiting a bullish momentum. This can be attributed to the price being above a significant ascending trendline, which indicates that further bullish momentum may be expected.
Based on this momentum, the price could potentially continue to rise towards the first resistance level.
The first support level is located at 137.65 and is seen as an overlap support as well as aligning with the 50% Fibonacci retracement level. This adds to its significance as a potential area where buyers might enter the market, thus preventing further price declines.
Should the price break below this level, the second support level is located at 134.31 and is identified as a multi-swing low support. This level could also attract buyers, further preventing the price from falling.
On the other hand, the first resistance level is located at 142.11 and is identified as an overlap resistance, also aligning with the 61.80% Fibonacci retracement level. This level could pose a challenge to any potential upward price movements.
The second resistance level is situated at 144.99 and is seen as a pullback resistance. This level could also act as a barrier to further price increases.
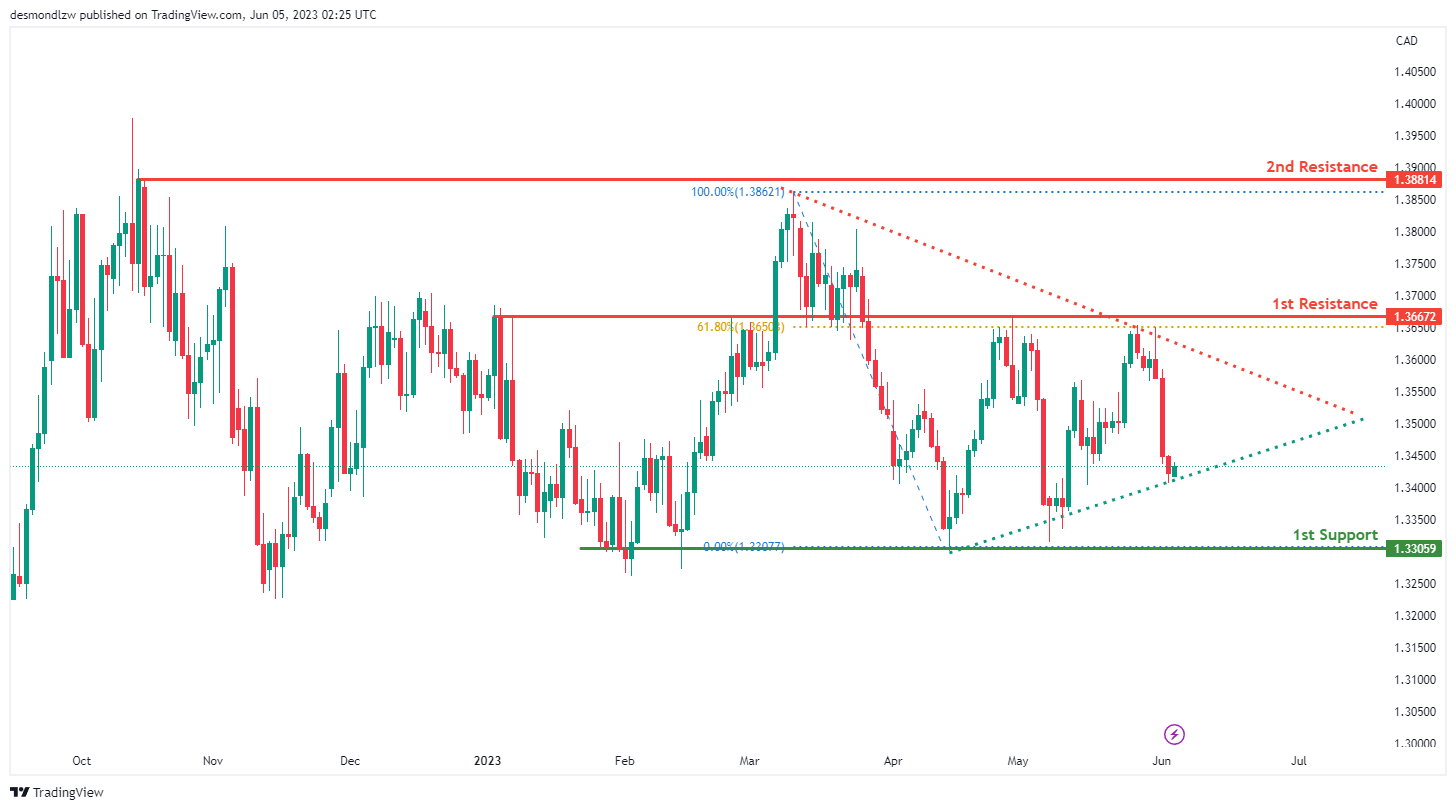
USD/CAD:
The USD/CAD chart is currently displaying a neutral momentum, suggesting an indecisive market.
The price could potentially fluctuate between the first resistance and first support levels due to this uncertainty.
The first support level is at 1.3305 and is identified as a multi-swing low support. This level represents an area of significant buying interest, which could prevent further price declines.
On the other hand, the first resistance level is at 1.3667. This level serves as an overlap resistance and aligns with the 61.80% Fibonacci retracement, enhancing its potential to halt upward price movements.
The second resistance level is at 1.3881 and is recognized as a swing high resistance. This level could also serve as a hurdle to further price increases.
A noteworthy observation is the presence of a symmetrical triangle chart pattern. This pattern typically represents a period of consolidation before the price is forced to breakout or breakdown. A break above the pattern’s upper trendline could signal a bullish breakout, while a break below the lower trendline might indicate a bearish breakdown.
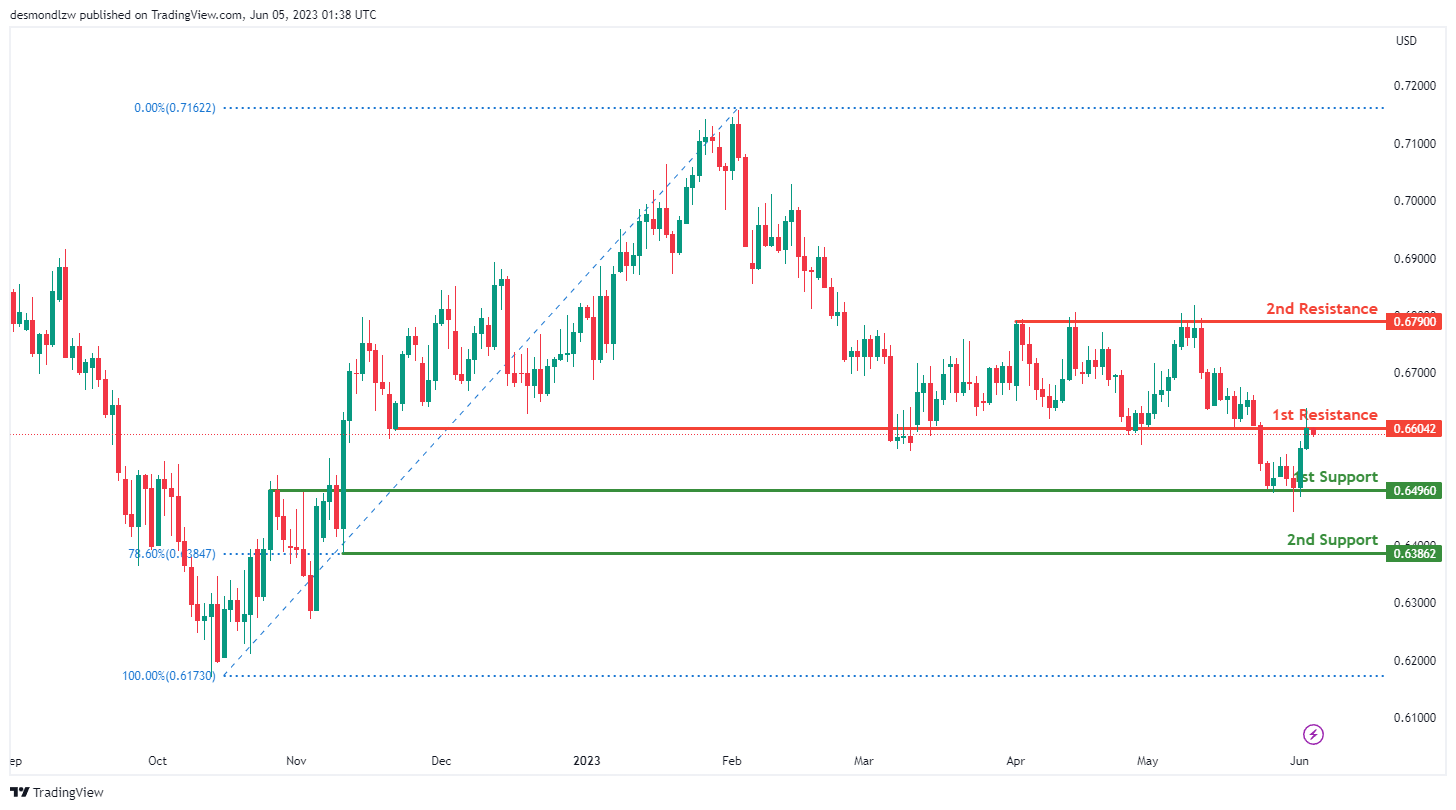
AUD/USD:
The AUD/USD chart is currently demonstrating a bearish momentum, suggesting a downward trend in the market.
Considering this bearish momentum, it’s plausible that the price may react bearishly off the first resistance level and drop towards the first support level.
The first support level is located at 0.6496. This is identified as an overlap support, an area in the market structure that has previously attracted buyers.
The second support level is at 0.6386, serving as a swing low support and aligning with the 78.60% Fibonacci retracement. This enhances its significance as a potential buying zone.
On the contrary, the first resistance level is at 0.6604. Recognized as an overlap resistance, this level could temporarily halt any bullish price movements.
Additionally, the second resistance level is at 0.6790. This multi-swing high resistance level could pose a significant challenge to further price increases.
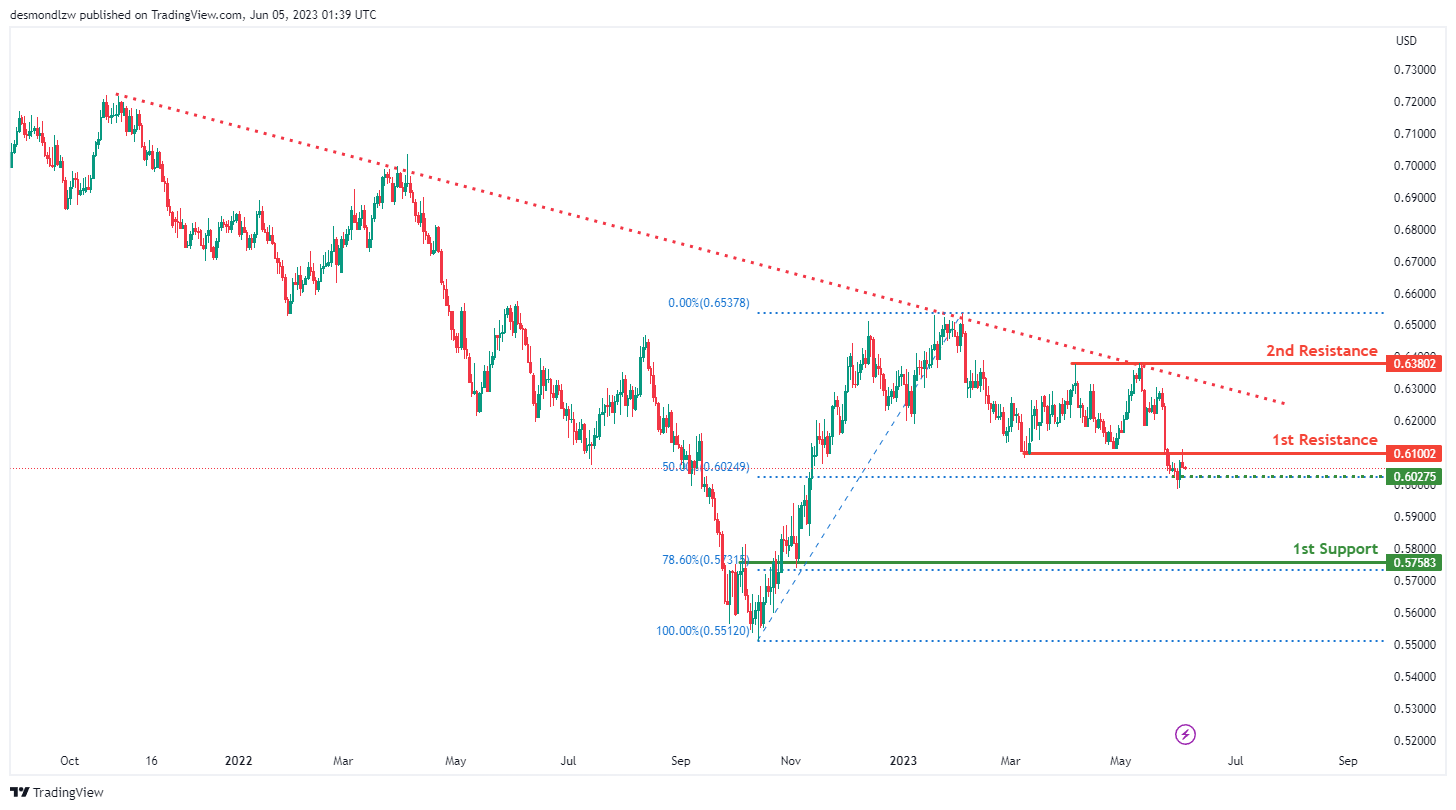
NZD/USD
The NZD/USD chart is currently demonstrating bearish momentum, with the price being below a major descending trend line which suggests a continuation of the bearish trend.
In light of this bearish momentum, it’s possible that the price may react bearishly off the first resistance level and drop towards the first support level.
The first support level is at 0.5758, identified as an overlap support and aligning with the 78.60% Fibonacci retracement. This adds to its significance as a potential buying zone in the market structure.
An intermediate support level is also present at 0.6027, serving as a swing low support and aligning with the 50% Fibonacci retracement, further reinforcing its potential significance.
In contrast, the first resistance level is at 0.6100, recognized as an overlap resistance. This level could act as a barrier to potential bullish price movements.
Finally, the second resistance level is at 0.6380, identified as a multi-swing high resistance, which could pose a challenge to further price increases.
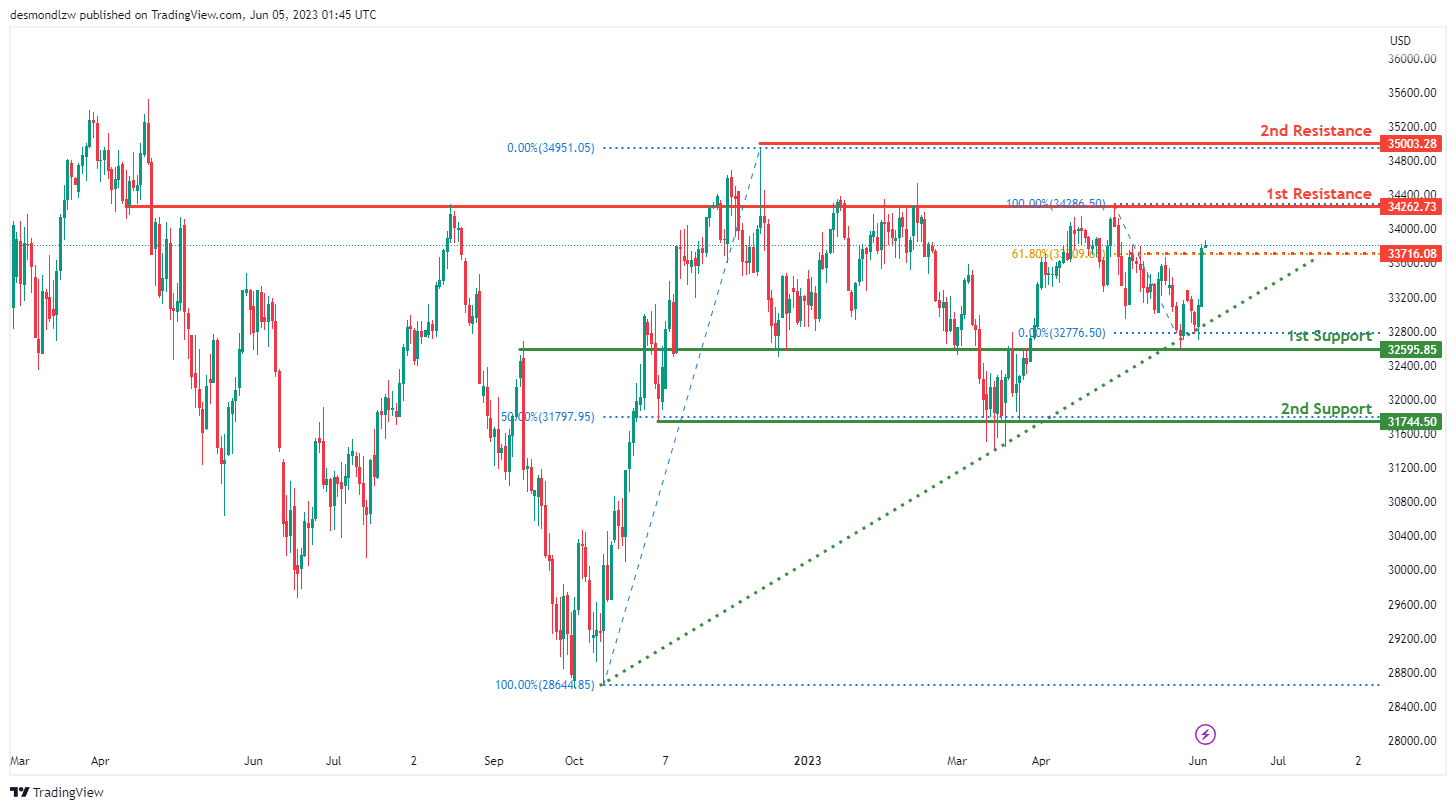
DJ30:
The DJ30 (Dow Jones Industrial Average) chart is currently exhibiting bullish momentum, which is reinforced by the fact that the price is above a significant ascending trend line, suggesting that further bullish movement is on the horizon.
Given this momentum, it’s possible that the price might continue to rise towards the first resistance level. The first support level is found at 32595.85, serving as an overlap support and aligns with the 78.60% Fibonacci retracement level, reinforcing its importance.
An intermediate support level is located at 31744.50. This multi-swing low support is significant and is associated with the 50% Fibonacci retracement level.
The first resistance level is at 34267.73 and is identified as an overlap resistance, which could act as a temporary barrier to further price increases.
The second resistance level is at 35003.28 and is categorized as a swing high resistance, suggesting that it could pose a challenge to further bullish momentum.
An intermediate resistance level is at 33716.08, which is a swing high resistance and coincides with the 61.80% Fibonacci retracement level, suggesting that it might act as a temporary barrier to price increases.
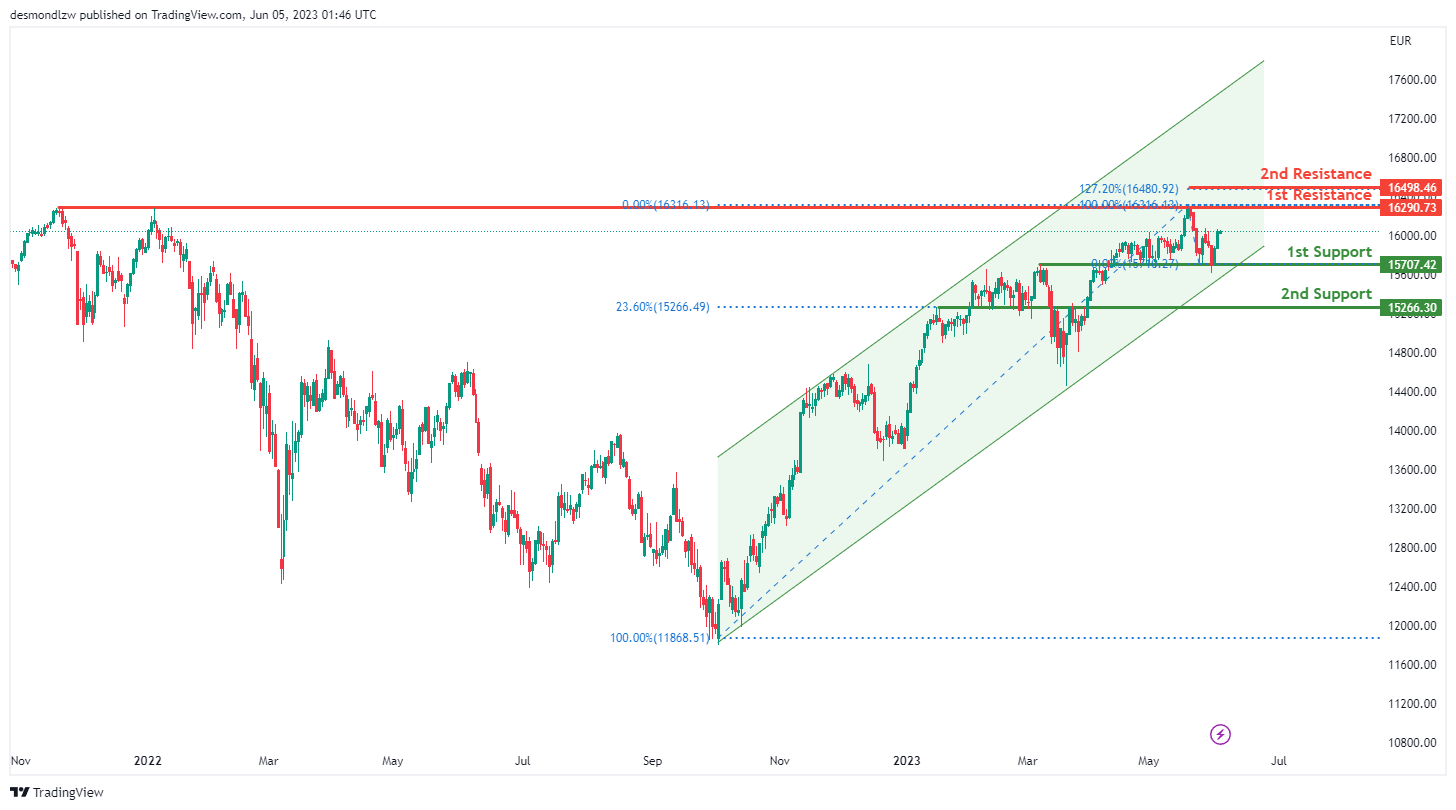
GER30:
The GER30 (Germany 30) chart currently shows bullish momentum, supported by the fact that the price is within a bullish ascending channel, indicating potential for further upward movement.
Given this momentum, the price might potentially continue its ascent towards the first resistance level. The first support level is set at 15707.42, defined as an overlap support, enhancing its significance in the chart.
An intermediate support level is located at 15266.30, acting as a pullback support and coinciding with the 23.60% Fibonacci retracement level, reinforcing its importance.
The first resistance level is placed at 16290.73. This level is considered a multi-swing high resistance and could act as a temporary barrier to further price increases.
The second resistance level is found at 35003.28, aligning with the 127.20% Fibonacci extension. This suggests that it could provide a considerable challenge to continued bullish momentum.
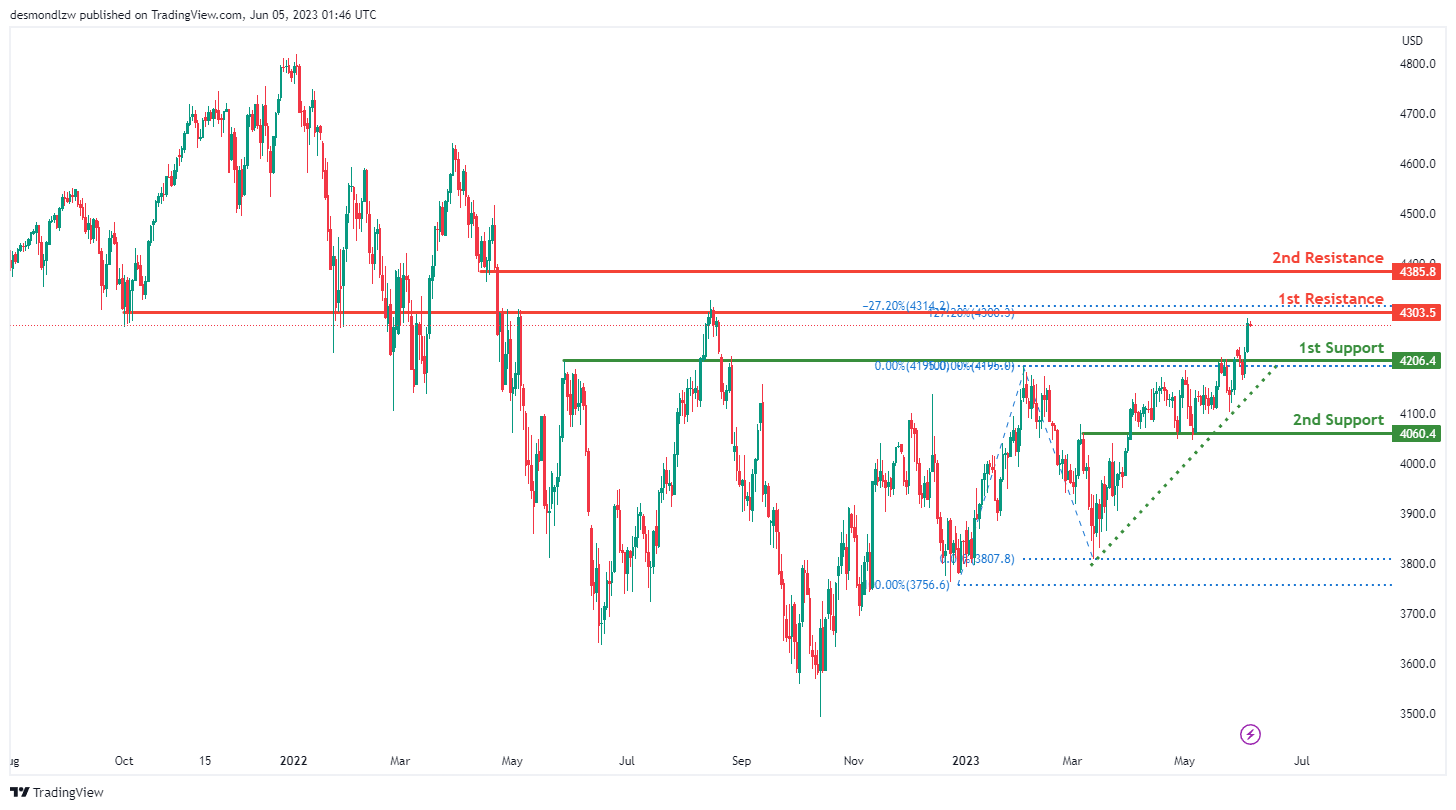
US500
The US500 chart currently displays bullish momentum, as the price is above a significant ascending trend line, indicating the potential for further bullish momentum.
Given the current momentum, the price could potentially drop to the first support level in the short term before bouncing back and rising to the first resistance level.
The first support level is at 4206.4 and is identified as a pullback support, which strengthens its significance in the chart.
An intermediate support level is at 4060.4 and is identified as an overlap support, which further emphasizes its significance.
The first resistance level is at 4303.5. This level is seen as an overlap resistance and aligns with the 127.20% Fibonacci Extension and -27% Fibonacci Expansion. This alignment, known as Fibonacci confluence, can add to the level’s credibility as a potential resistance point.
The second resistance level is at 4385.8, recognized as a pullback resistance, which could potentially act as a temporary barrier to further price increases.
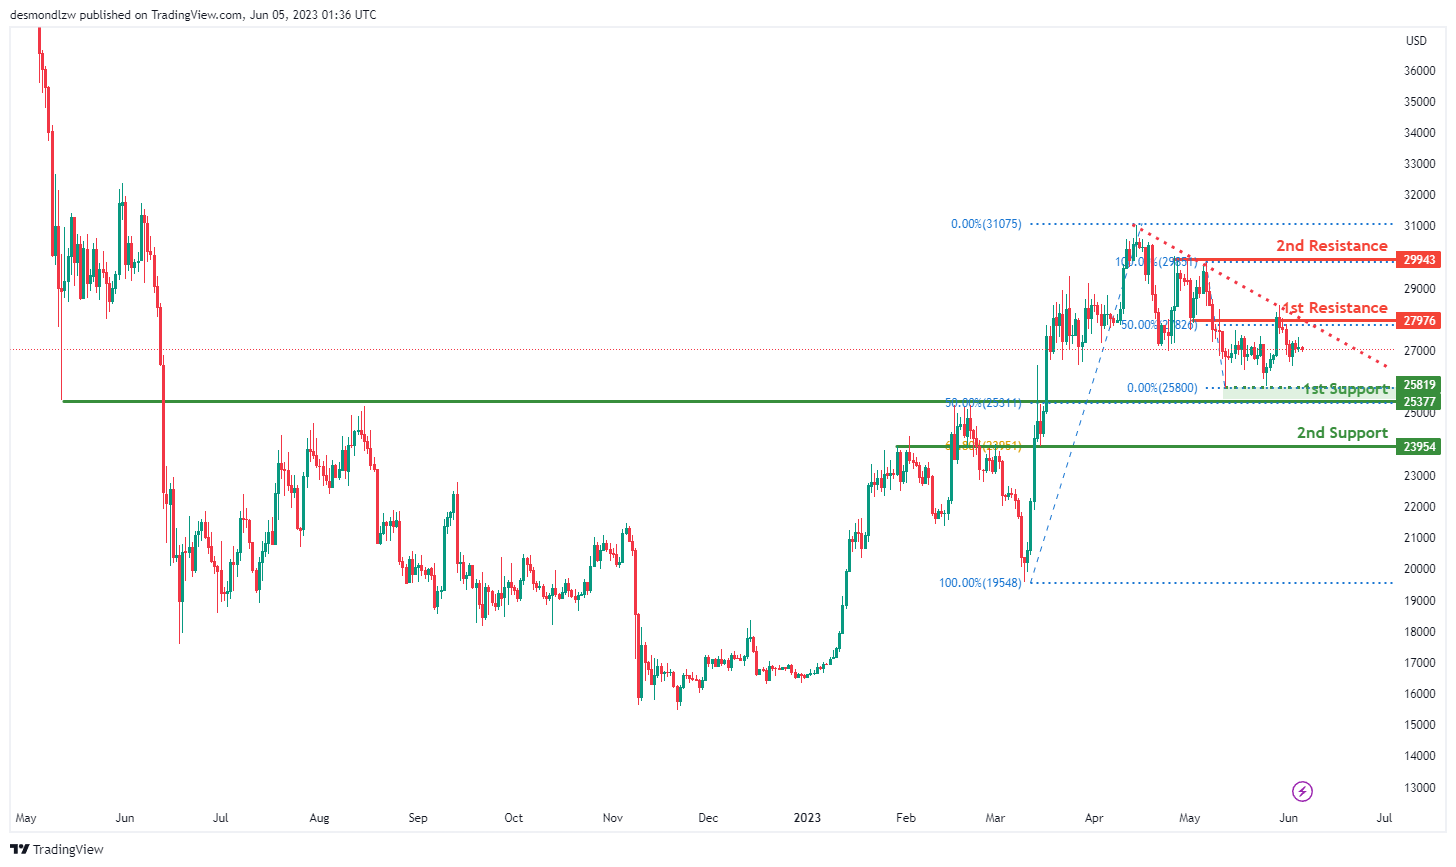
BTC/USD:
The BTC/USD chart currently exhibits a bearish momentum, with the price below a significant descending trend line, suggesting potential further bearish movements.
In light of this bearish momentum, the price could potentially continue its downward movement towards the first support level.
The first support level is at 25377, identified as a pullback support. This level aligns with the 50% Fibonacci Retracement, reinforcing its significance.
A second support level is at 23954, identified as an overlap support, which also aligns with the 61.80% Fibonacci Retracement, enhancing its significance.
The first resistance level is at 27976. This level is identified as an overlap resistance and coincides with the 50% Fibonacci Retracement, adding to its importance as a potential resistance point.
The second resistance level is at 29943, recognized as a multi-swing high resistance, potentially acting as a temporary barrier to further price increases.
There is also an intermediate support level at 25819, recognized as a swing low support, which could provide additional support to the price.
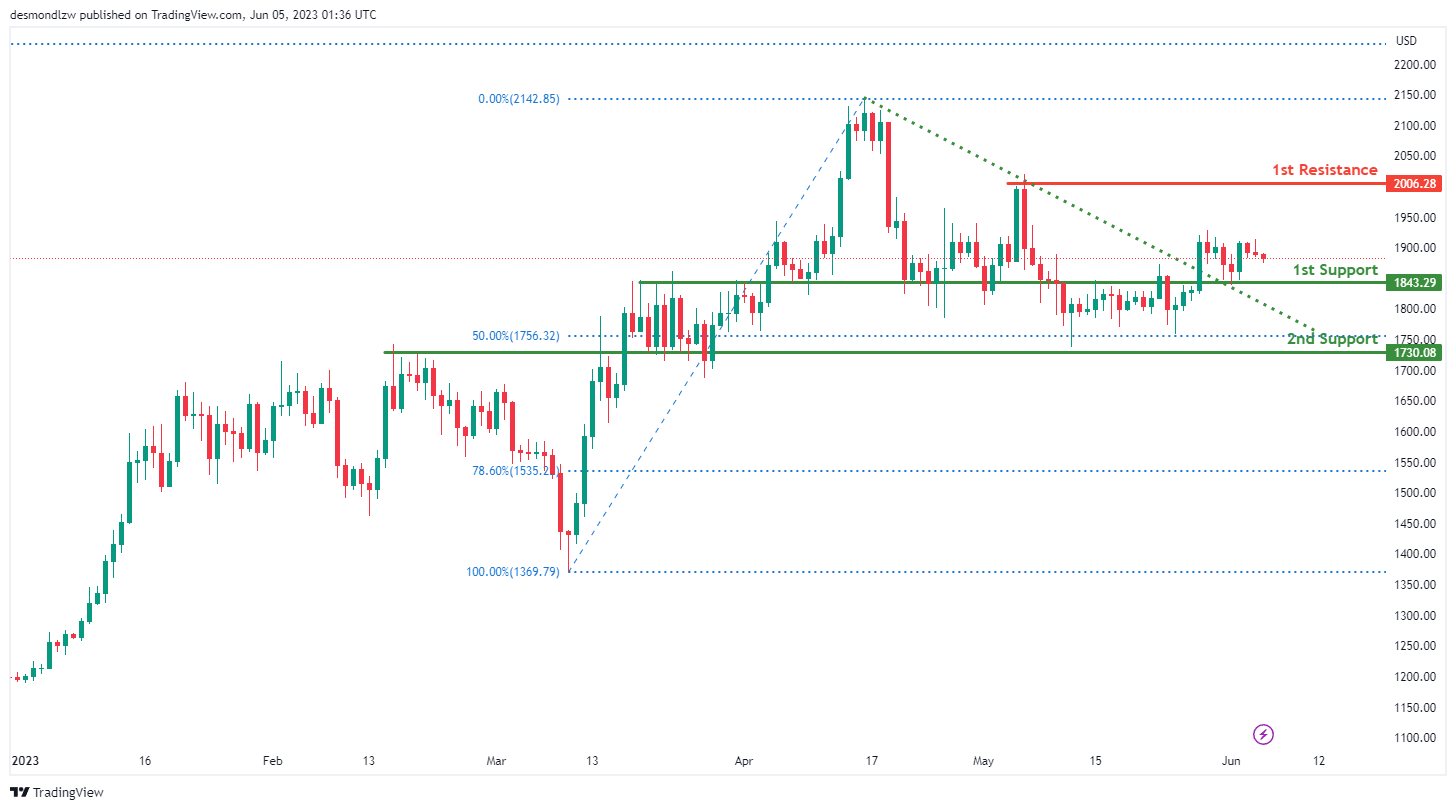
ETH/USD:
The ETH/USD chart currently shows a bullish momentum, with the price having broken above a significant descending resistance line, suggesting potential further bullish movements.
Given this bullish momentum, the price could potentially continue its upward trend towards the first resistance level.
The first support level is at 1843.29, identified as an overlap support. This level serves as a significant area where buyers have previously entered the market, adding to its significance.
The second support level is at 1730.08, also identified as an overlap support. This level also aligns with the 50% Fibonacci Retracement, enhancing its importance as a potential support area.
The first resistance level is at 2006.28. This level is recognized as a swing high resistance, indicating its historical significance as a price level where selling pressure has emerged, potentially acting as a temporary barrier to further price increases.
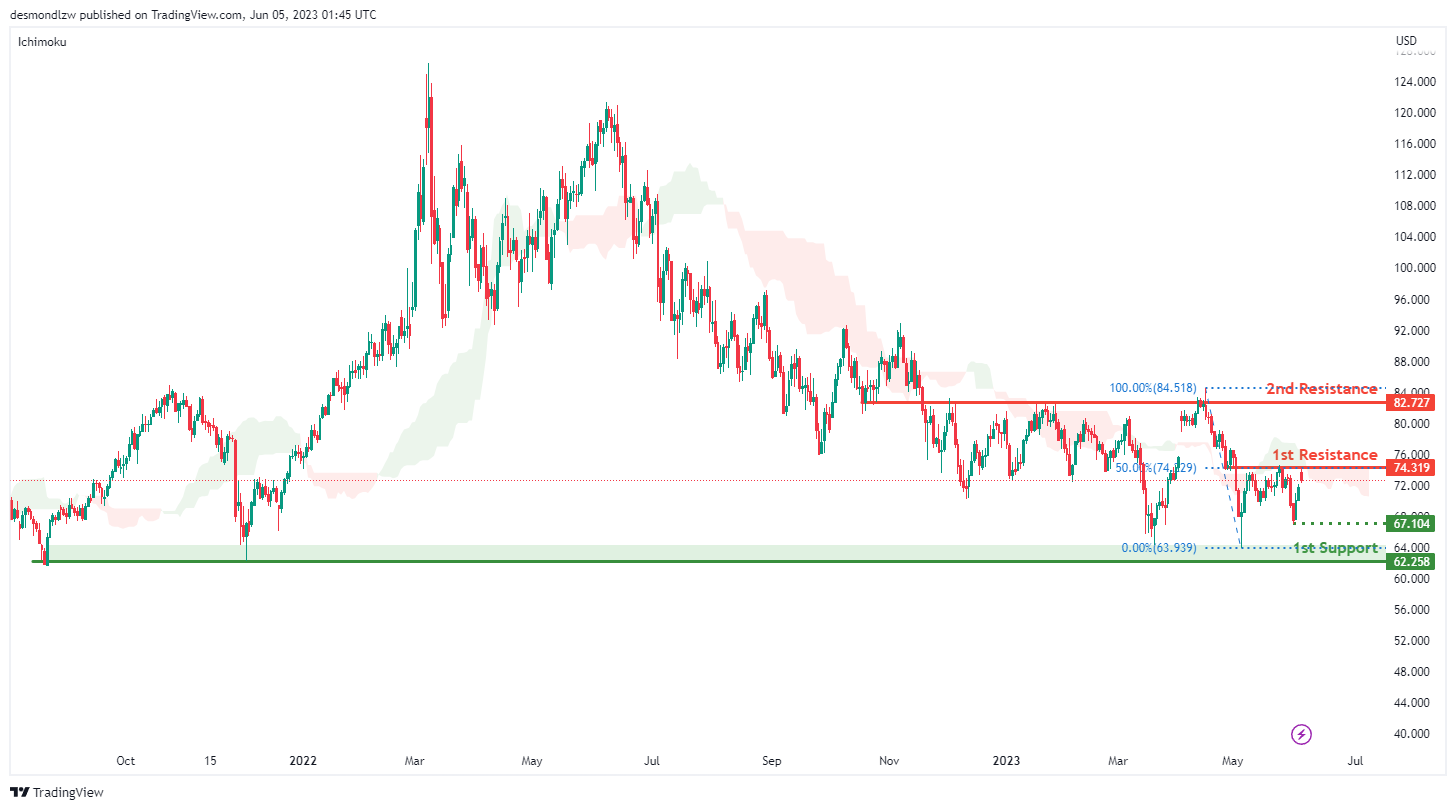
WTI/USD:
The WTI chart currently exhibits a bearish momentum, as the price is below the bearish Ichimoku cloud, suggesting potential further downward movements.
Given this bearish momentum, the price could potentially react off the first resistance level and continue its downward trend towards the first support level.
The first support level is at 62.25, identified as a multi-swing low support. This level has historically served as a significant area where buyers have entered the market, adding to its importance as a potential support area.
The first resistance level is at 74.31, recognized as an overlap resistance. This level also coincides with the 50% Fibonacci retracement, enhancing its significance as a potential barrier to further price increases.
The second resistance level is at 82.72, identified as an overlap resistance. This level represents a price point where sellers have previously entered the market, potentially acting as another barrier to upward price movements.
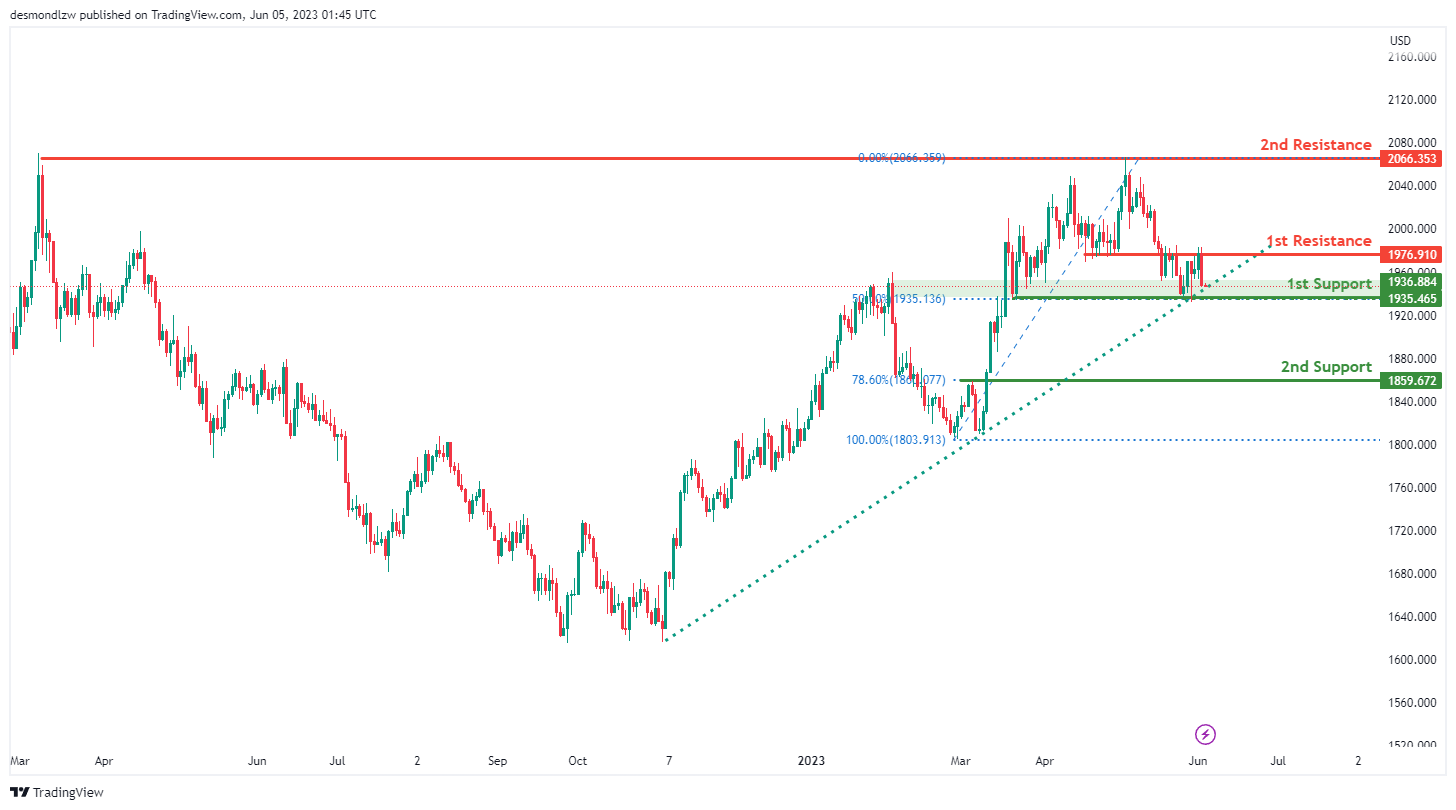
XAU/USD (GOLD):
The XAU/USD chart currently exhibits a bullish momentum, with the price above a major ascending trend line. This implies that there’s potential for further upward movements.
In this bullish context, the price could potentially continue its upward trend towards the first resistance level.
The first support level is at 1935.46. This level, recognized as a multi-swing low support, also coincides with the 50% Fibonacci retracement level, strengthening its significance as a potential area where buyers may enter the market.
The second support level is at 1859.67. This pullback support level is also at the 78.60% Fibonacci retracement level, enhancing its importance as a potential price floor.
The first resistance level is at 1976.91, identified as an overlap resistance. This is an area where sellers have previously entered the market, possibly acting as a barrier to further price increases.
The second resistance level is at 2066.35, noted as a multi-swing high resistance. This level could serve as another significant barrier to further upward price movement.
The accuracy, completeness and timeliness of the information contained on this site cannot be guaranteed. IC Markets does not warranty, guarantee or make any representations, or assume any liability regarding financial results based on the use of the information in the site.
News, views, opinions, recommendations and other information obtained from sources outside of www.icmarkets.com, used in this site are believed to be reliable, but we cannot guarantee their accuracy or completeness. All such information is subject to change at any time without notice. IC Markets assumes no responsibility for the content of any linked site.
The fact that such links may exist does not indicate approval or endorsement of any material contained on any linked site. IC Markets is not liable for any harm caused by the transmission, through accessing the services or information on this site, of a computer virus, or other computer code or programming device that might be used to access, delete, damage, disable, disrupt or otherwise impede in any manner, the operation of the site or of any user’s software, hardware, data or property.


