
DXY:
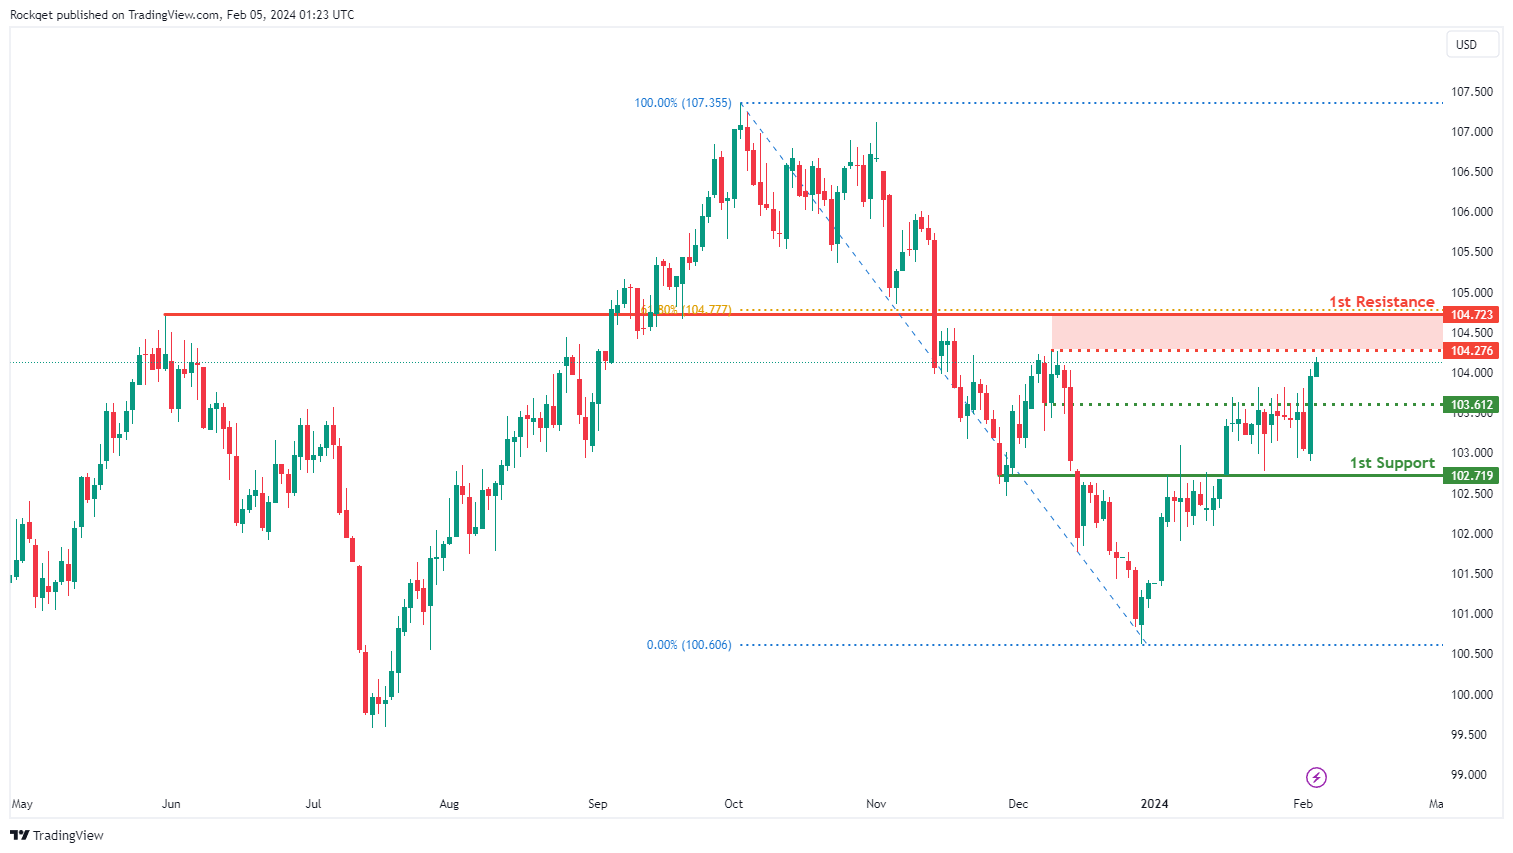
The DXY chart currently exhibits a bearish overall momentum, indicating a downward trend. According to the analysis, the price could potentially rise towards the 1st resistance in the short term before reversing off it and dropping towards the 1st support.
The 1st support level at 102.71 is identified as an overlap support, suggesting that it has historical significance and could potentially act as a strong support level where selling pressure may subside.
There is also an intermediate support level at 103.61, described as a pullback support, which further emphasizes its importance as a potential support zone.
On the resistance side, the 1st resistance level at 104.72 is categorized as a pullback resistance, and it is reinforced by the presence of the 61.80% Fibonacci Retracement. This level may pose a temporary obstacle to the bearish momentum.
There is also an intermediate resistance level at 104.61, identified as a swing high resistance, suggesting that it represents a historical point where the price has encountered resistance.
EUR/USD:
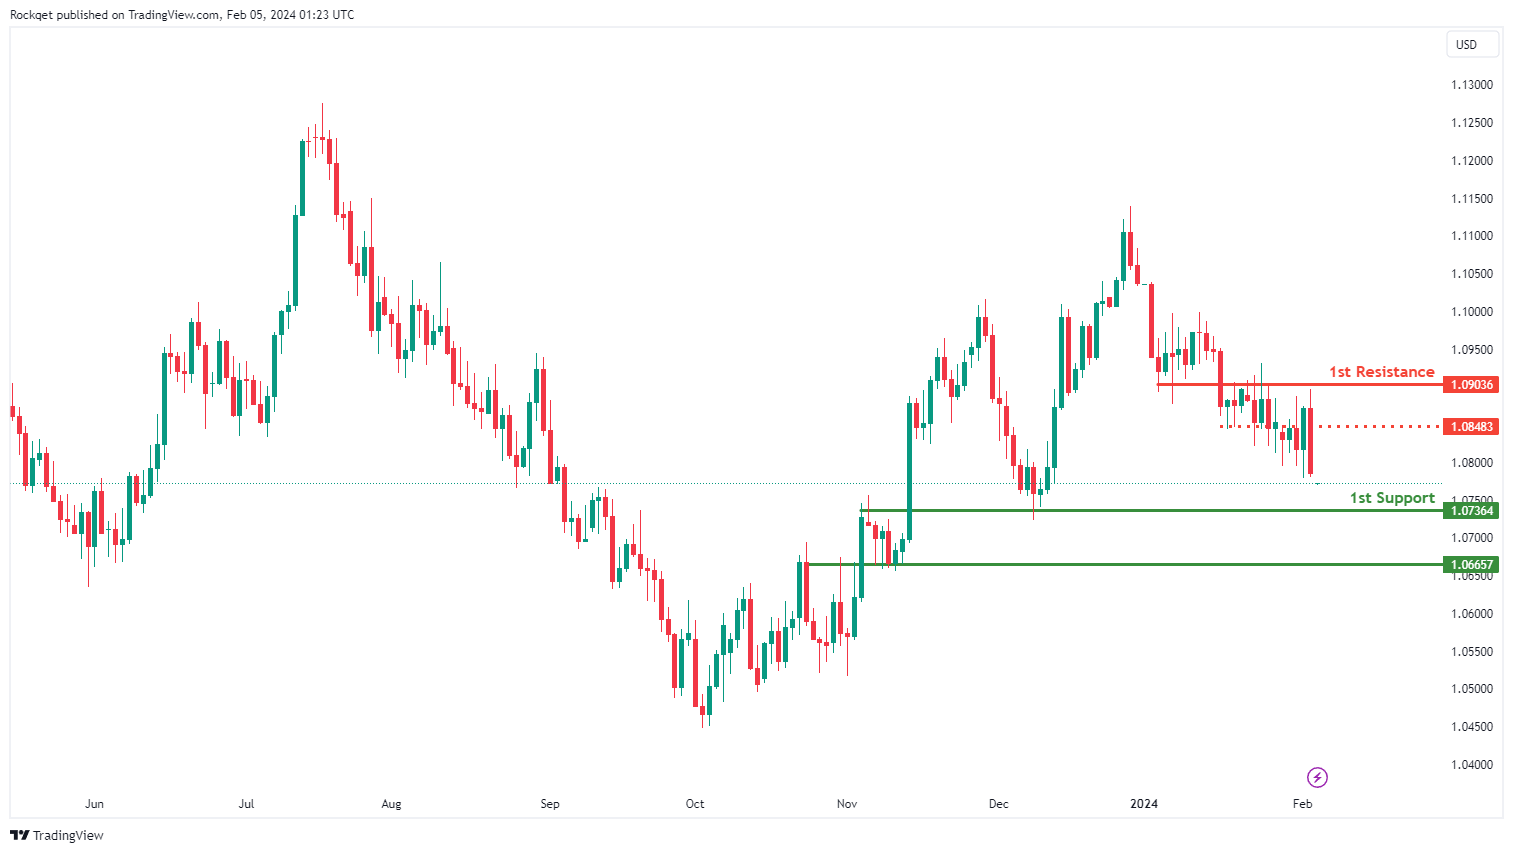
The EUR/USD chart currently exhibits a bullish overall momentum, indicating an upward trend. According to the analysis, the price could potentially make a bullish bounce off the 1st support level and head towards the 1st resistance.
The 1st support level at 1.0736 is identified as an overlap support, suggesting that it has historical significance and could potentially act as a strong support level where buying interest may emerge.
There is also a 2nd support level at 1.0665, described as an overlap support, which further emphasizes its importance as a potential support zone.
On the resistance side, the 1st resistance level at 1.0903 is categorized as an overlap resistance, indicating that it represents a historical point where the price has encountered resistance in the past.
There is also an intermediate resistance level at 1.0848, identified as a pullback resistance, suggesting that it may pose a temporary obstacle to the bullish momentum.
EUR/JPY:
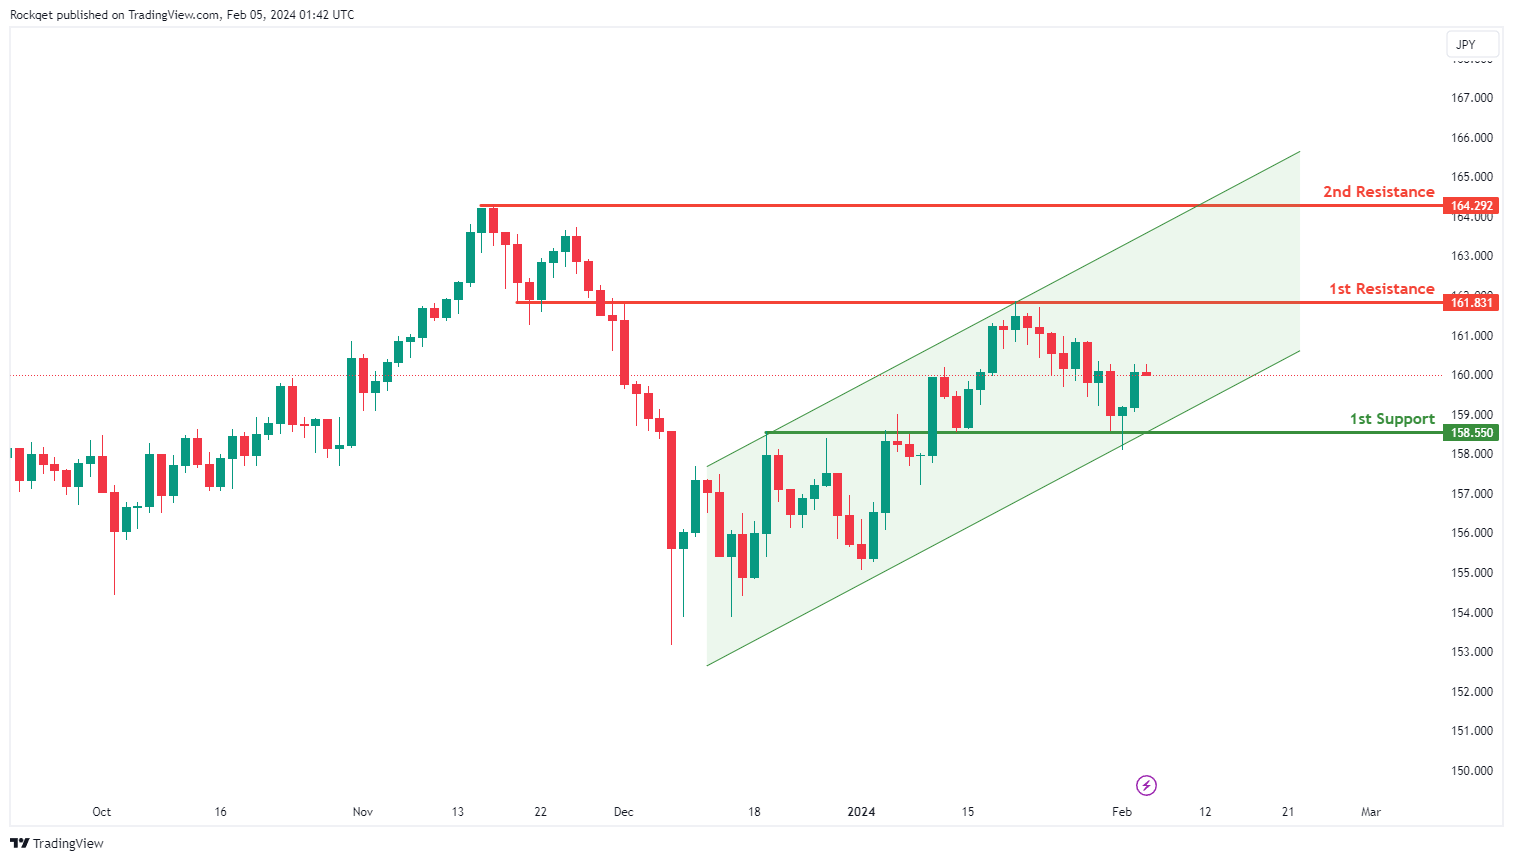
The EUR/JPY chart currently exhibits a bullish overall momentum, signaling a predominant upward trend in the market. Several factors contribute to this positive sentiment, reinforcing the potential for sustained upward movement in the price.
The 1st support at 158.550 is considered advantageous for several reasons. Primarily, it is identified as an overlap support, aligning with a historical level where buying interest has previously materialized.
Additionally, the 2nd support, which is not specified, would benefit from additional clarification to enhance the depth of the analysis.
On the resistance side, the 1st resistance at 161.831 is highlighted for its alignment with an overlap resistance, indicating a historical area where selling pressure has been evident.
The 2nd resistance at 164.292 is also noted, coinciding with swing high resistance, contributing to its significance as a potential barrier to bullish momentum.
EUR/GBP:
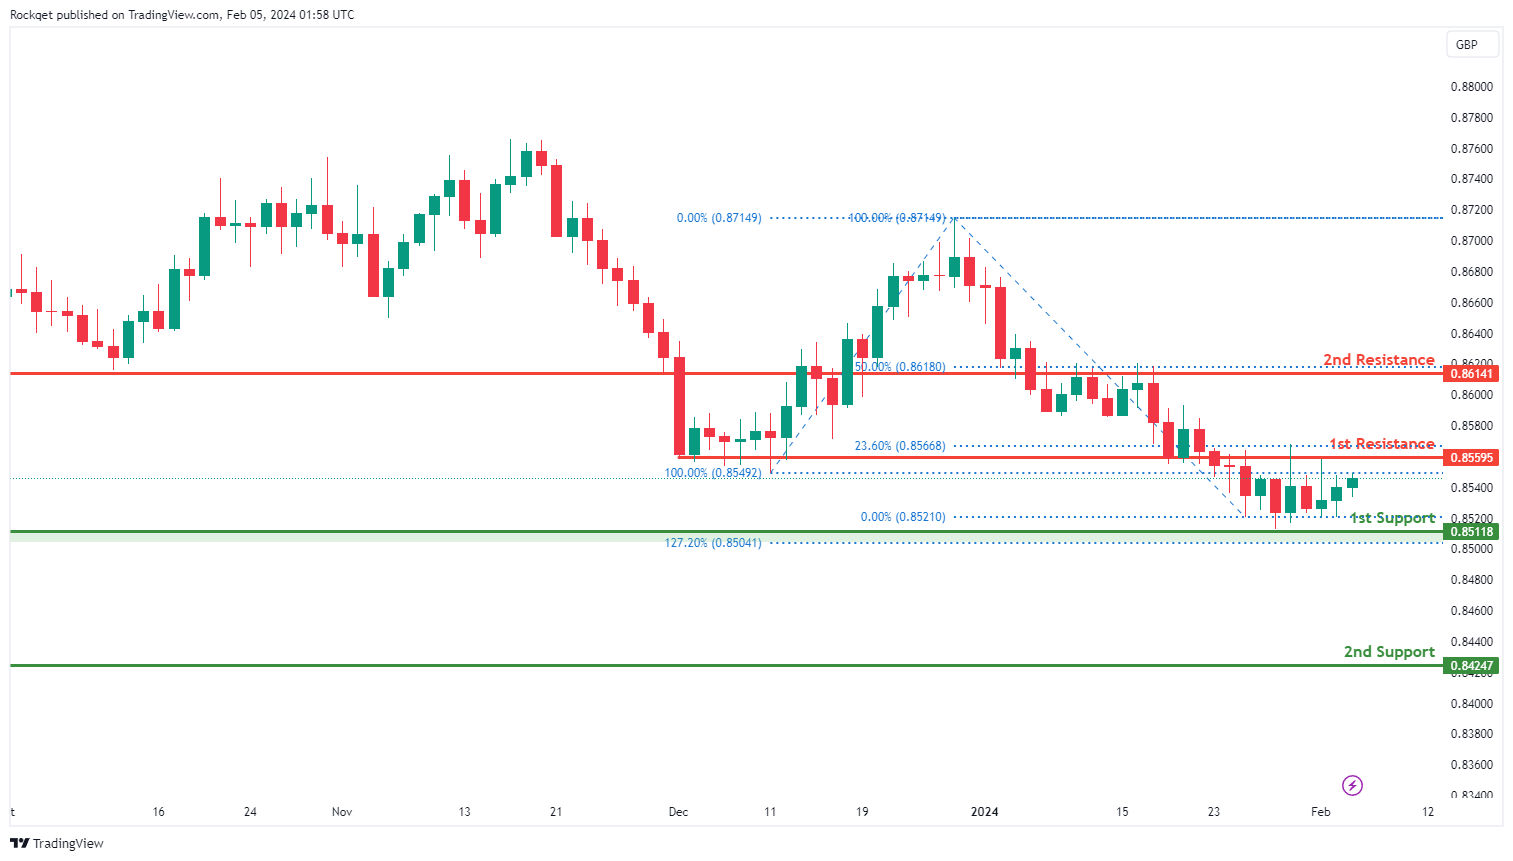
The EUR/GBP chart currently indicates a bullish overall momentum, suggesting a prevailing upward trend. Various factors contribute to this bullish sentiment, pointing towards the potential for continued upward movement in the price.
The 1st support at 0.85118 is considered advantageous for several reasons. It is identified as a swing low support and aligns with the 127.20% Fibonacci Extension, indicating a historical level where buying interest has previously emerged.
The 2nd support at 0.84247 is also recognized as a swing low support, further strengthening the potential support zone.
On the resistance side, the 1st resistance at 0.85595 is highlighted for its alignment with an overlap resistance and the 23.60% Fibonacci Retracement. This suggests a potential barrier to the bullish momentum.
The 2nd resistance at 0.86141 is also noted, coinciding with an overlap resistance and the 50% Fibonacci Retracement, adding further significance to this resistance level.
GBP/USD:
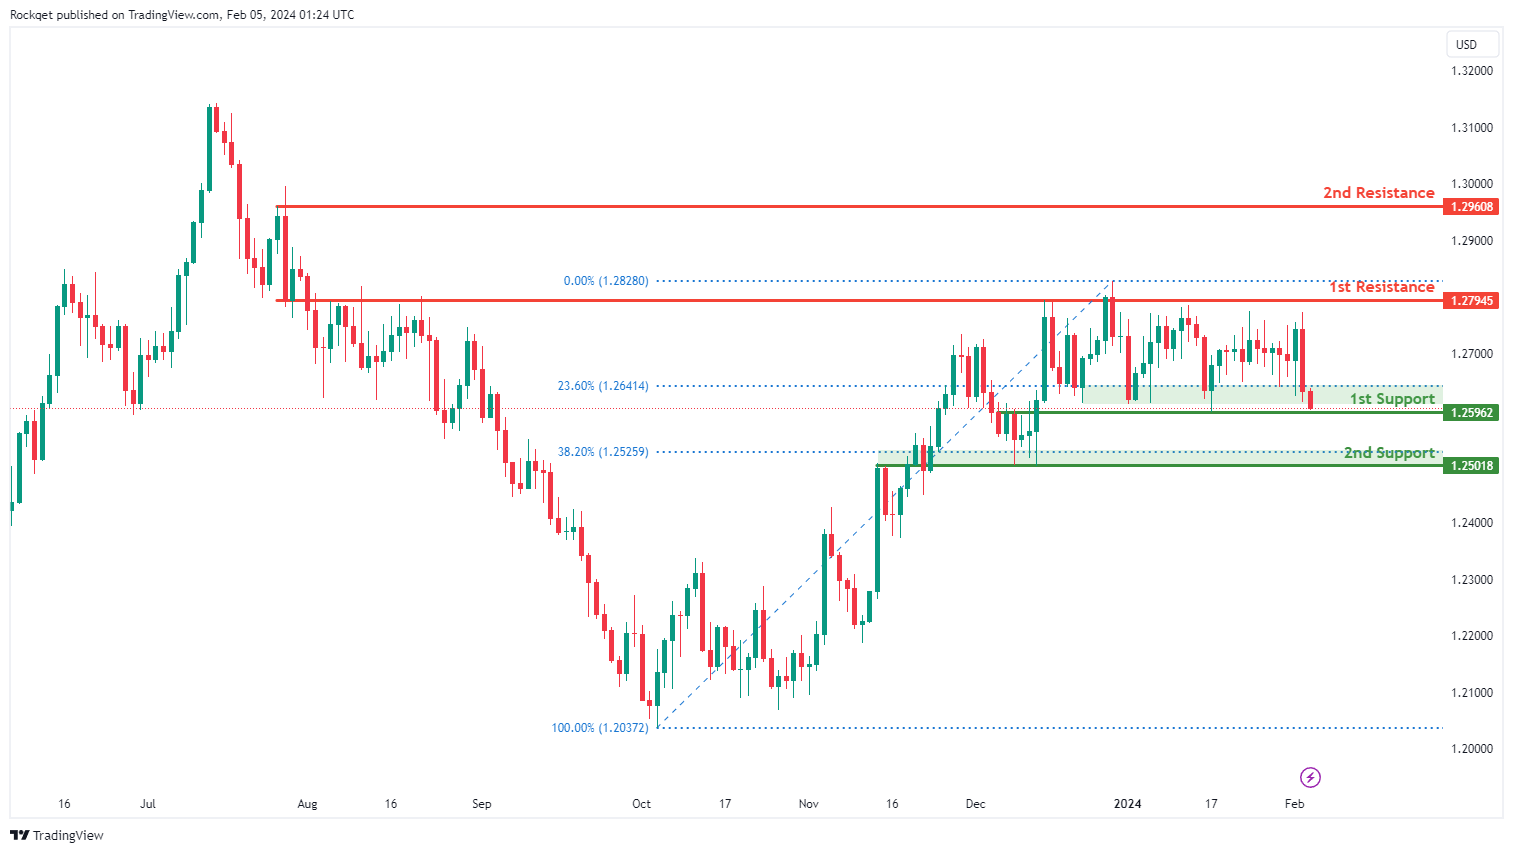
The GBP/USD chart currently exhibits a bullish overall momentum, indicating an upward trend. According to the analysis, the price could potentially experience a bullish bounce off the 1st support level and head towards the 1st resistance.
The 1st support level at 1.2596 is identified as an overlap support and is reinforced by the presence of the 23.60% Fibonacci Retracement. This suggests that it has historical significance and could potentially act as a strong support level where buying interest may emerge.
There is also a 2nd support level at 1.2501, described as an overlap support, and it is associated with the 38.20% Fibonacci Retracement, further emphasizing its importance as a potential support zone.
On the resistance side, the 1st resistance level at 1.2794 is categorized as an overlap resistance, indicating that it represents a historical point where the price has encountered resistance in the past.
There is also a 2nd resistance level at 1.2960, identified as a swing high resistance, suggesting that it is another historical level where the price has faced resistance.
GBP/JPY:
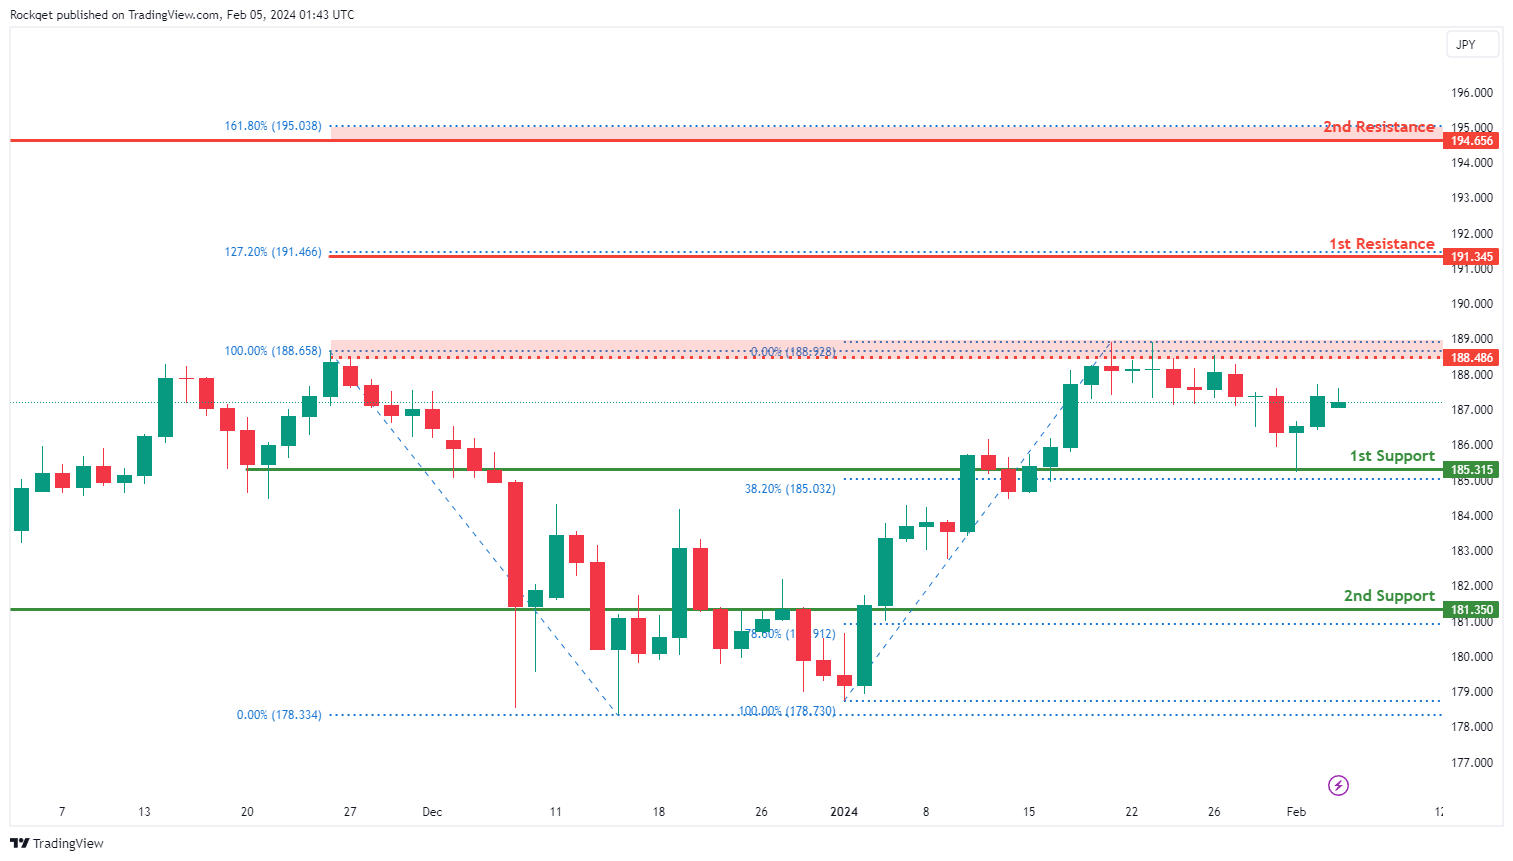
The GBP/JPY chart currently reflects a neutral overall momentum, indicating a lack of a clear trend direction. The price could potentially exhibit a range-bound movement, fluctuating between the 1st resistance and 1st support levels.
The 1st support at 185.315 is viewed favorably for multiple reasons. It is identified as an overlap support and coincides with the 38.20% Fibonacci Retracement, suggesting a historical level where buying interest has previously been observed.
The 2nd support at 181.350 is also recognized as an overlap support and aligns with the 78.60% Fibonacci Retracement, providing additional strength to the potential support zone.
On the resistance side, the 1st resistance at 191.345 is emphasized, aligning with the 127.20% Fibonacci Extension. This level suggests a potential barrier to the price movement.
The 2nd resistance at 194.656 is also noted, coinciding with a swing high resistance and the 161.80% Fibonacci Extension, adding further significance to this resistance level.
Intermediate resistance at 188.49 is highlighted as well, indicating a potential level of pullback resistance.
USD/CHF:
The USD/CHF chart currently exhibits a bearish overall momentum, indicating a downward trend. According to the analysis, the price could potentially experience a bearish reaction off the 1st resistance level and drop to the 1st support.
The 1st support level at 0.8561 is identified as an overlap support and is reinforced by the presence of the 38.20% Fibonacci Retracement. This suggests that it has historical significance and could potentially act as a strong support level where buying interest may emerge.
There is also a 2nd support level at 0.8402, described as a multi-swing low support, further emphasizing its importance as a potential support zone.
On the resistance side, the 1st resistance level at 0.8691 is categorized as an overlap resistance, indicating that it represents a historical point where the price has encountered resistance in the past.
There is also a 2nd resistance level at 0.8895, identified as an overlap resistance with the presence of both the 61.80% Fibonacci Retracement and the 78.60% Fibonacci Projection. This confluence of Fibonacci levels suggests a stronger resistance zone.

USD/JPY:
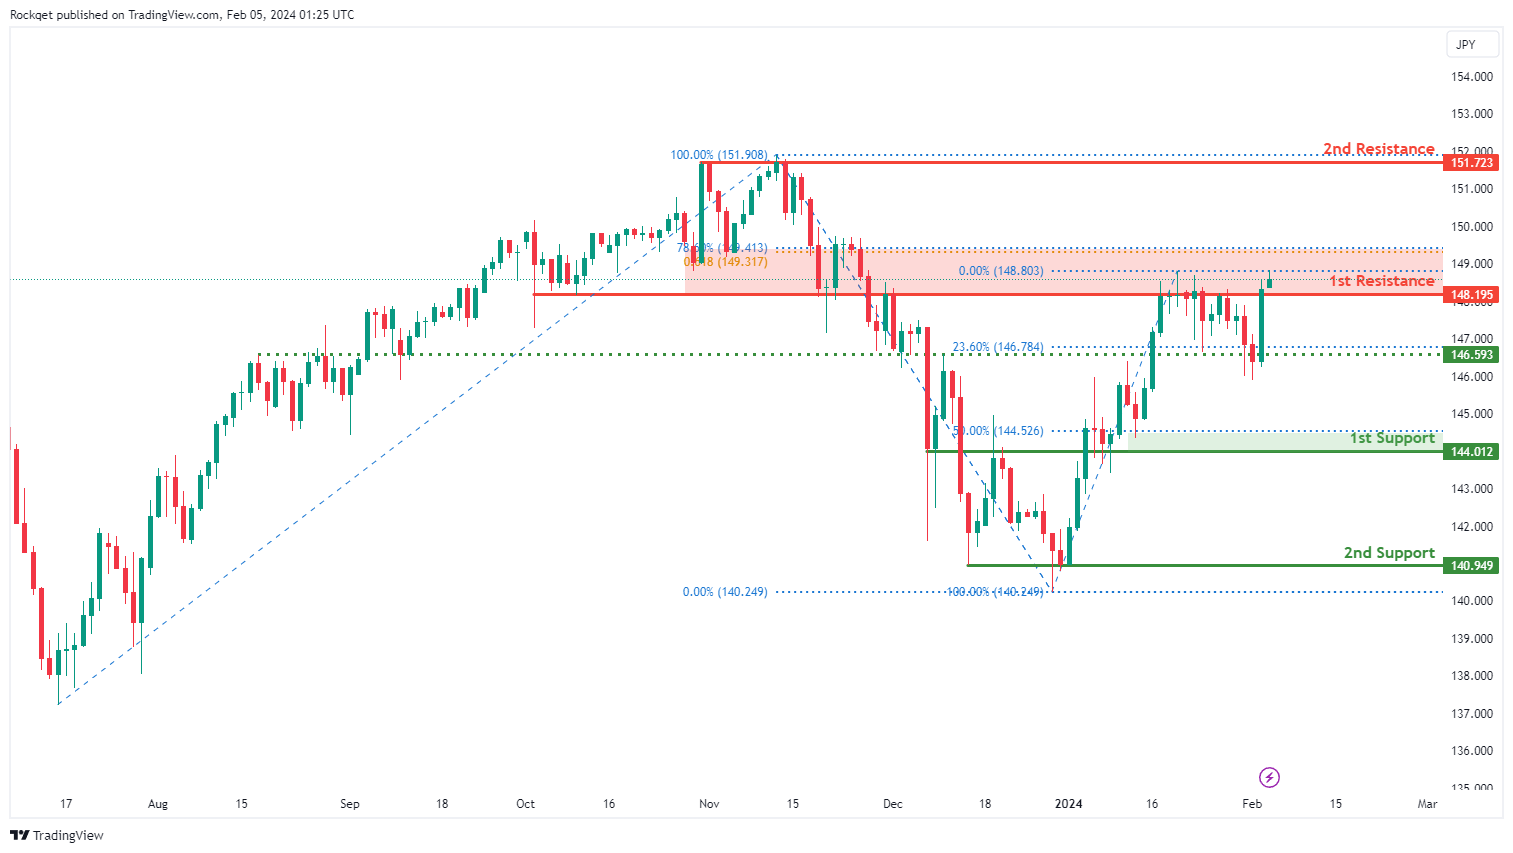
The USD/JPY chart currently exhibits a bearish overall momentum, indicating a downward trend. According to the analysis, the price could potentially experience a bearish reaction off the 1st resistance level and drop to the 1st support.
The 1st support level at 144.01 is identified as an overlap support and is reinforced by the presence of the 50% Fibonacci Retracement. This suggests that it has historical significance and could potentially act as a strong support level where buying interest may emerge.
There is also a 2nd support level at 140.94, described as a multi-swing low support, further emphasizing its importance as a potential support zone.
On the resistance side, the 1st resistance level at 148.19 is categorized as an overlap resistance, indicating that it represents a historical point where the price has encountered resistance in the past.
There is also a 2nd resistance level at 151.72, identified as a multi-swing high resistance, suggesting that it is another historical level where the price has faced resistance.
Intermediate support at 146.59 is also noted, marked as an overlap support with the presence of the 23.60% Fibonacci Retracement.
USD/CAD:
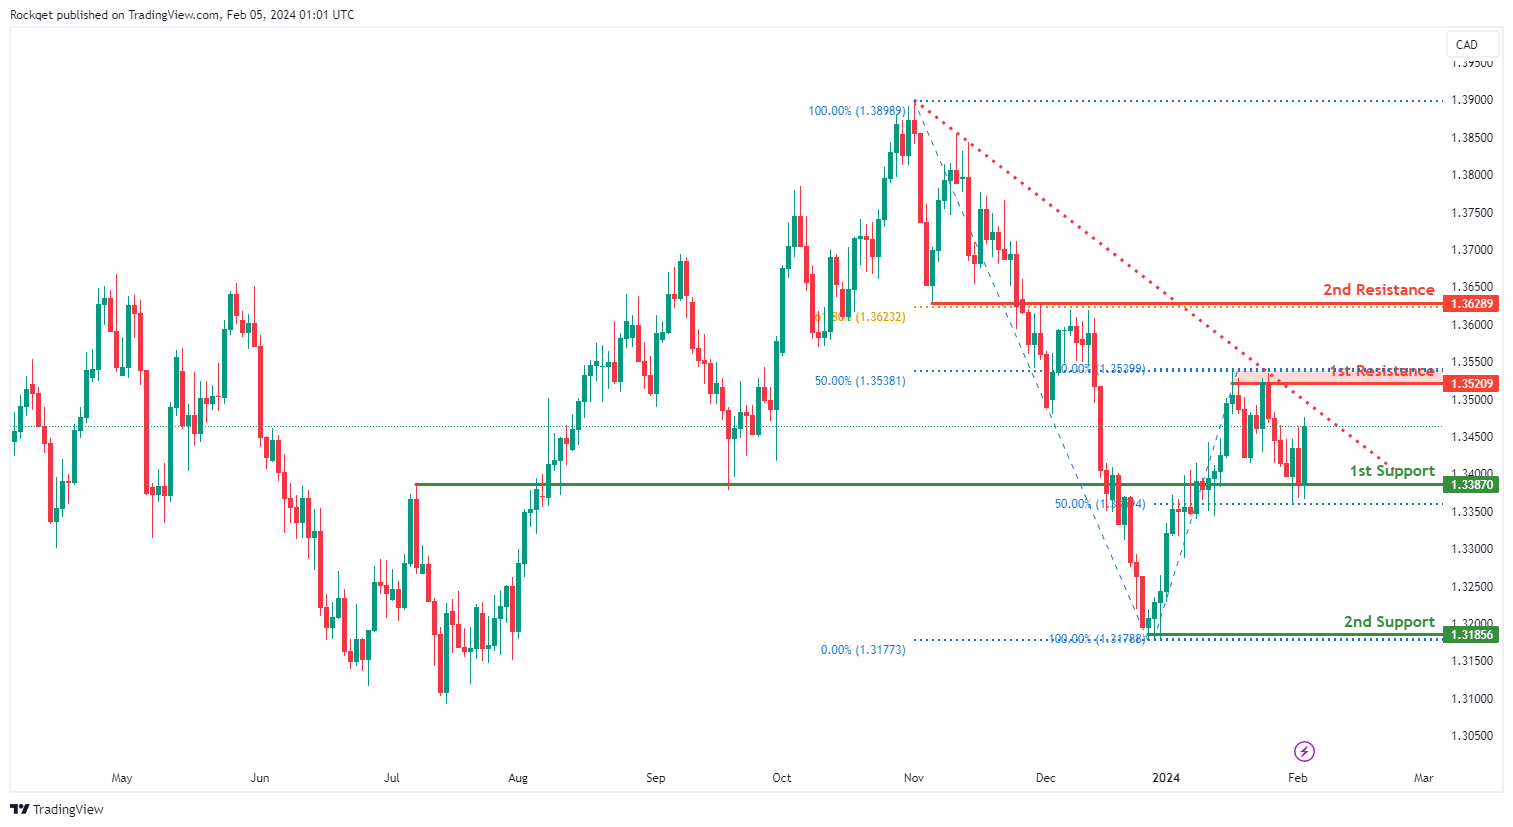
The USD/CAD chart currently exhibits an overall bullish momentum. In this context, there is a potential scenario for price to make a bullish continuation towards the 1st resistance should it break above the descending trendline.
The 1st resistance level at 1.3520 is identified as a pullback resistance that aligns close to the 50.00% Fibonacci retracement level. Higher up, the 2nd resistance level at 1.3628 is noted as an overlap resistance that aligns with the 61.80% Fibonacci retracement level, further highlighting its importance as a potential resistance point.
To the downside, the 1st support level at 1.3387 is identified as an overlap support that aligns close to the 50.00% Fibonacci Retracement level. Further below, the 2nd support level at 1.3185 is marked as a swing-low support, further emphasizing its importance as a potential support zone.
AUD/USD:
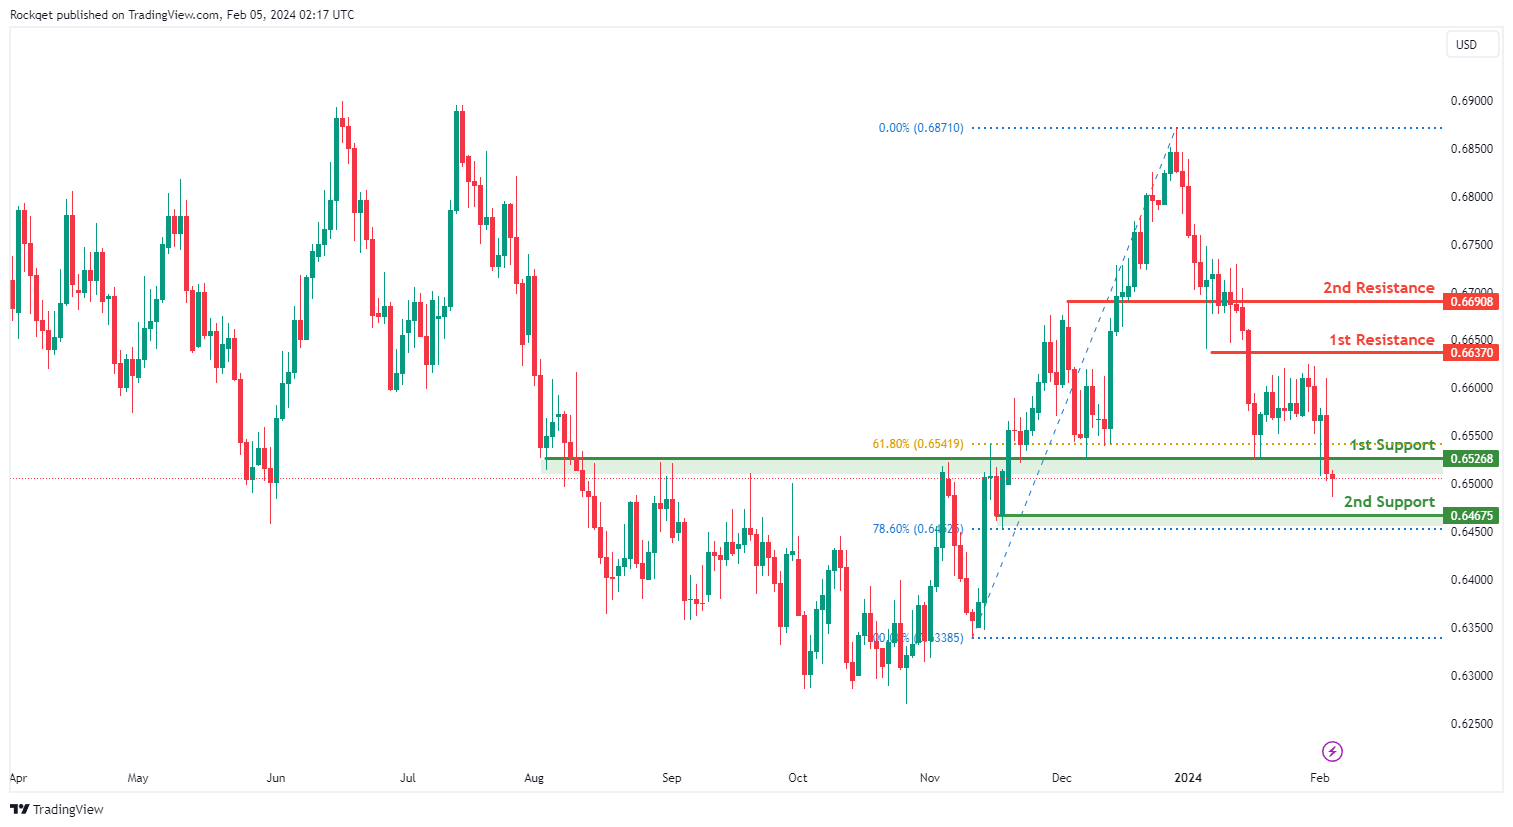
The AUD/USD chart currently exhibits an overall bearish momentum. In this context, there is a potential scenario for price to fall towards the 1st support and make a small bullish bounce before resuming the downturn.
The 1st support level at 0.6526 is identified as an overlap support that aligns close to the 61.80% Fibonacci retracement level. Further below, the 2nd support level at 0.6467 is also noted as a pullback support that aligns close to the 78.60% Fibonacci Retracement level, further emphasizing its importance as a potential support zone.
To the upside, the 1st resistance level at 0.6637 is identified as a pullback resistance. Higher up, the 2nd resistance level at 0.6690 is marked as an overlap resistance, further highlighting its importance as a potential resistance point.
NZD/USD
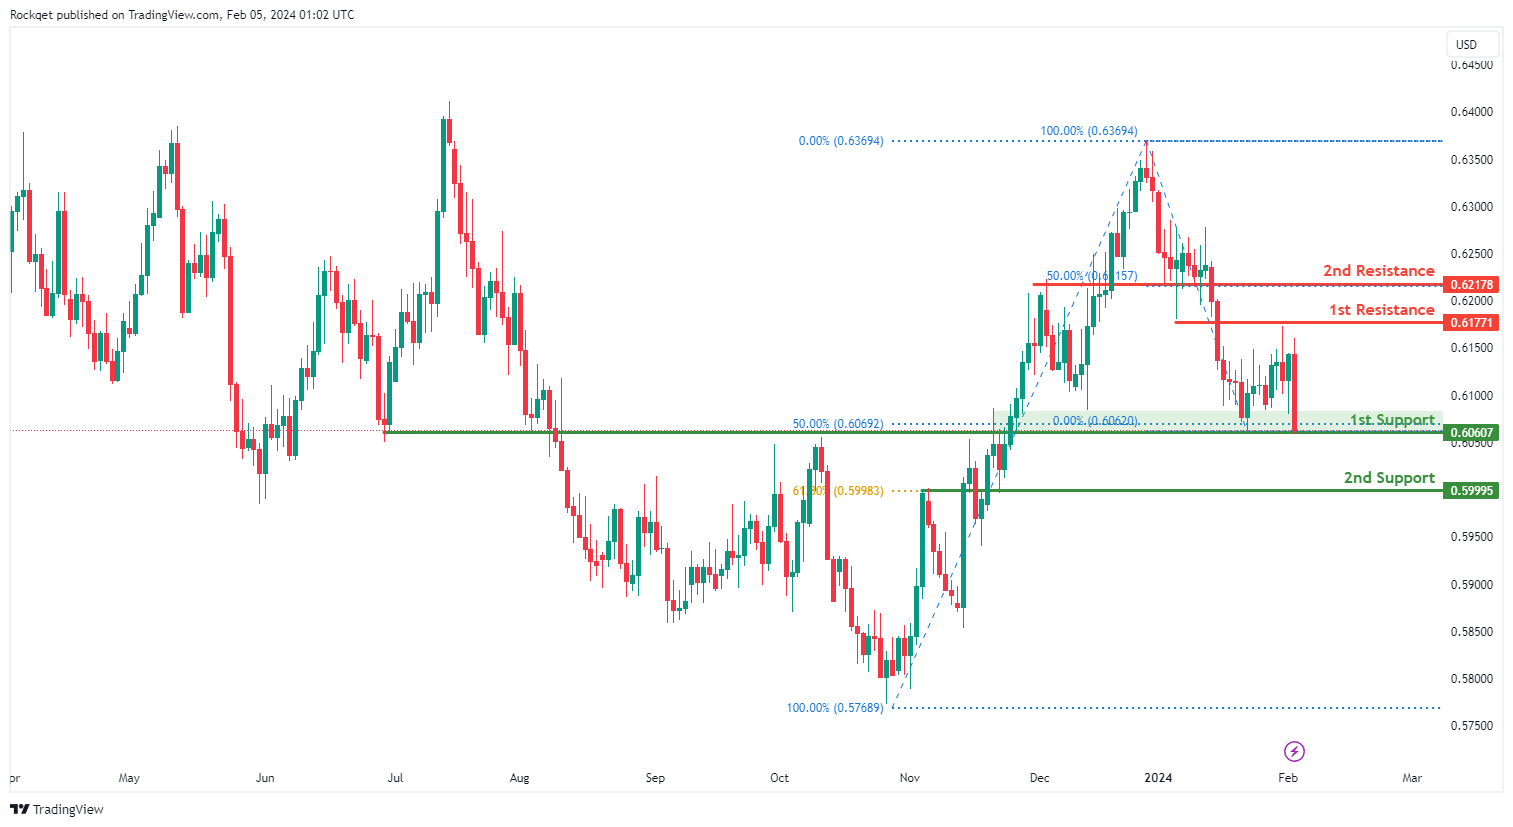
The NZD/USD chart currently exhibits an overall bearish momentum. In this context, there is a potential scenario for price to fall towards the 1st support and make a small bullish bounce before resuming the downturn.
The 1st support level at 0.6060 is identified as an overlap support that aligns close to the 50.00% Fibonacci Retracement level. Further below, the 2nd support level at 0.5999 is also noted as an overlap support that aligns with the 61.80% Fibonacci Retracement level, further emphasizing its importance as a potential support zone.
To the upside, the 1st resistance level at 0.6177 is identified as an overlap resistance. Higher up, the 2nd resistance level at 0.6217 is also marked as an overlap resistance that aligns with the 50.00% Fibonacci Retracement level, further highlighting its importance as a potential resistance point.
DJ30:
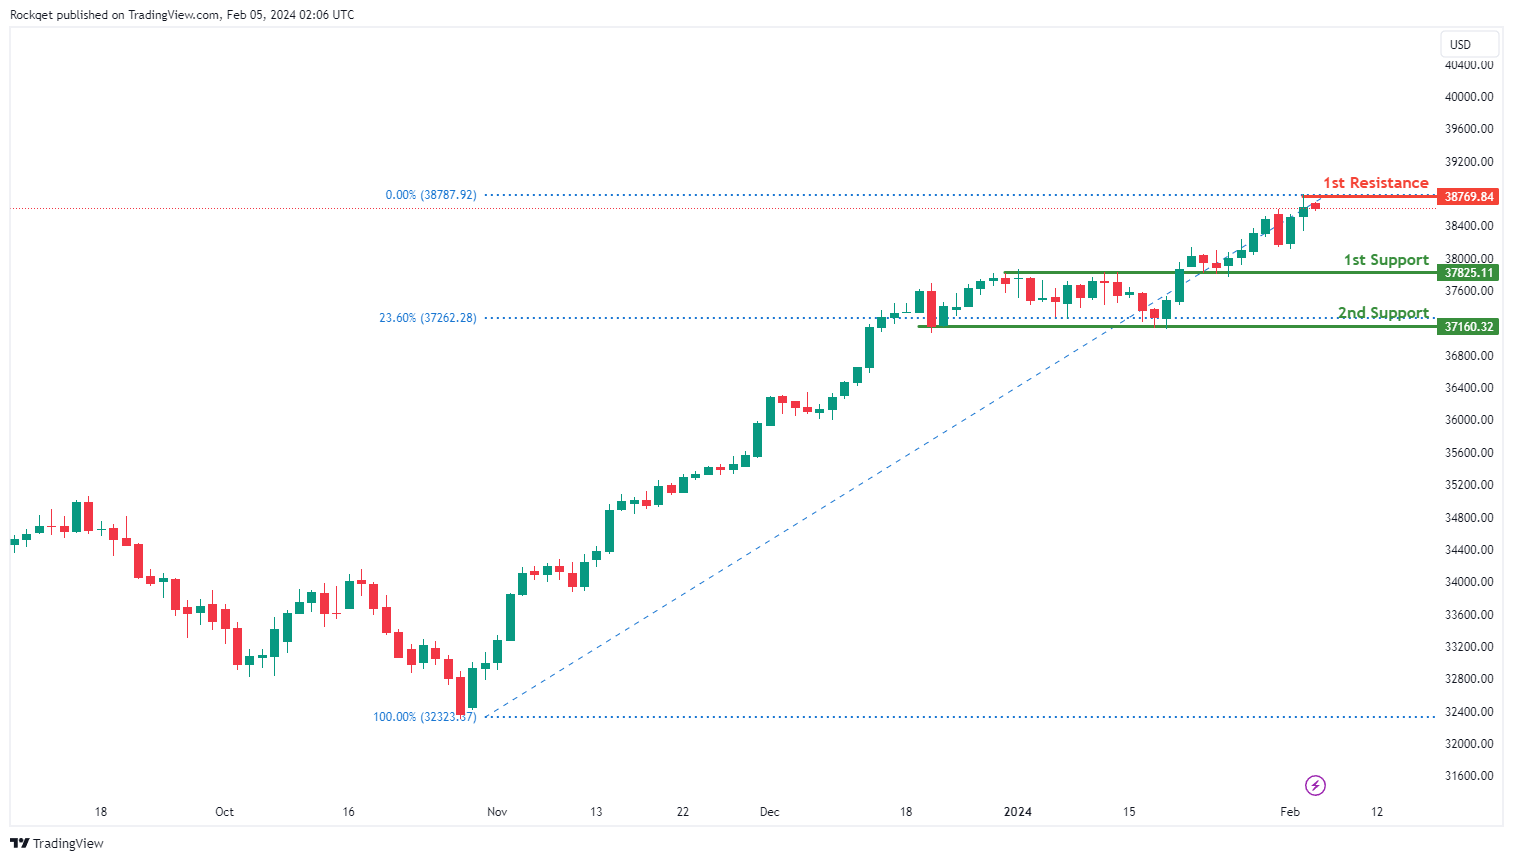
The DJ30 chart currently displays a bullish overall momentum, indicating a prevailing upward trend. There is a potential for a bullish continuation towards the 1st resistance level.
The 1st support at 37825.11 is considered favorable for several reasons. Firstly, it is identified as an overlap support, signifying a historical level where buying interest has previously emerged.
The 2nd support at 37160.32 is recognized as a pullback support, providing additional reinforcement to the potential support zone.
On the resistance side, the 1st resistance at 38769.84 is highlighted, aligning with a swing high resistance. This level suggests a potential barrier to the bullish momentum.
GER40:
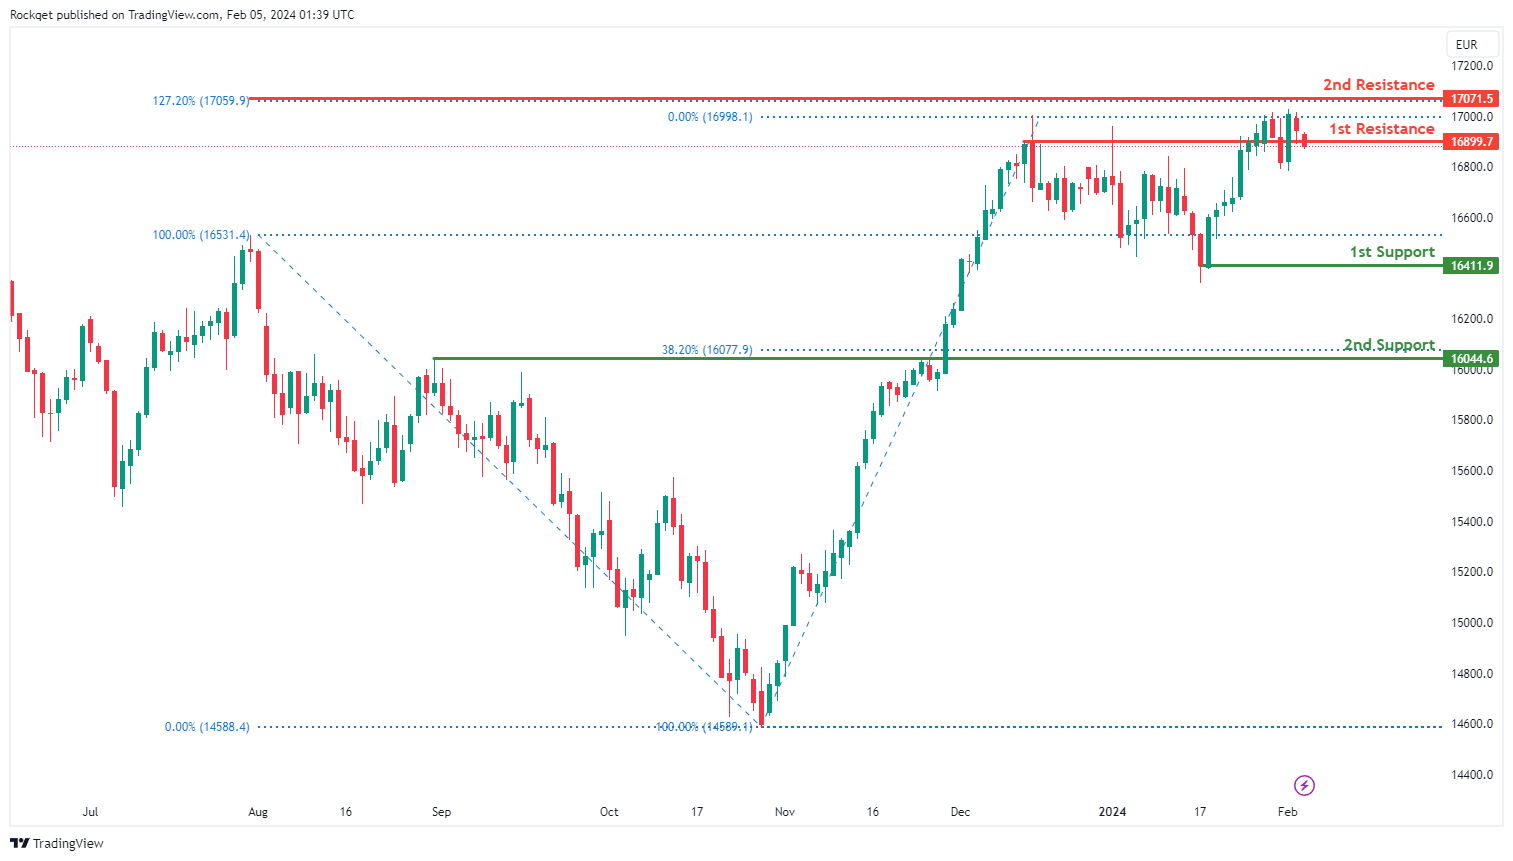
The GER40 chart currently exhibits a bearish overall momentum, indicating a prevailing downward trend. Several factors contribute to this bearish sentiment, supporting the potential for continued downward movement in the price.
The 1st support at 16411.9 is considered favorable for various reasons. Firstly, it is identified as an overlap support, suggesting a historical level where buying interest has previously emerged.
Additionally, the 2nd support at 16044.6 is recognized as both an overlap support and aligns with the 38.20% Fibonacci Retracement, providing additional strength to the potential support zone.
On the resistance side, the 1st resistance at 16899.7 is highlighted as it aligns with a pullback resistance, indicating a potential barrier to the bearish momentum.
The 2nd resistance at 17071.5 is also recognized, coinciding with the 127.20% Fibonacci Extension, adding further significance to this resistance level.
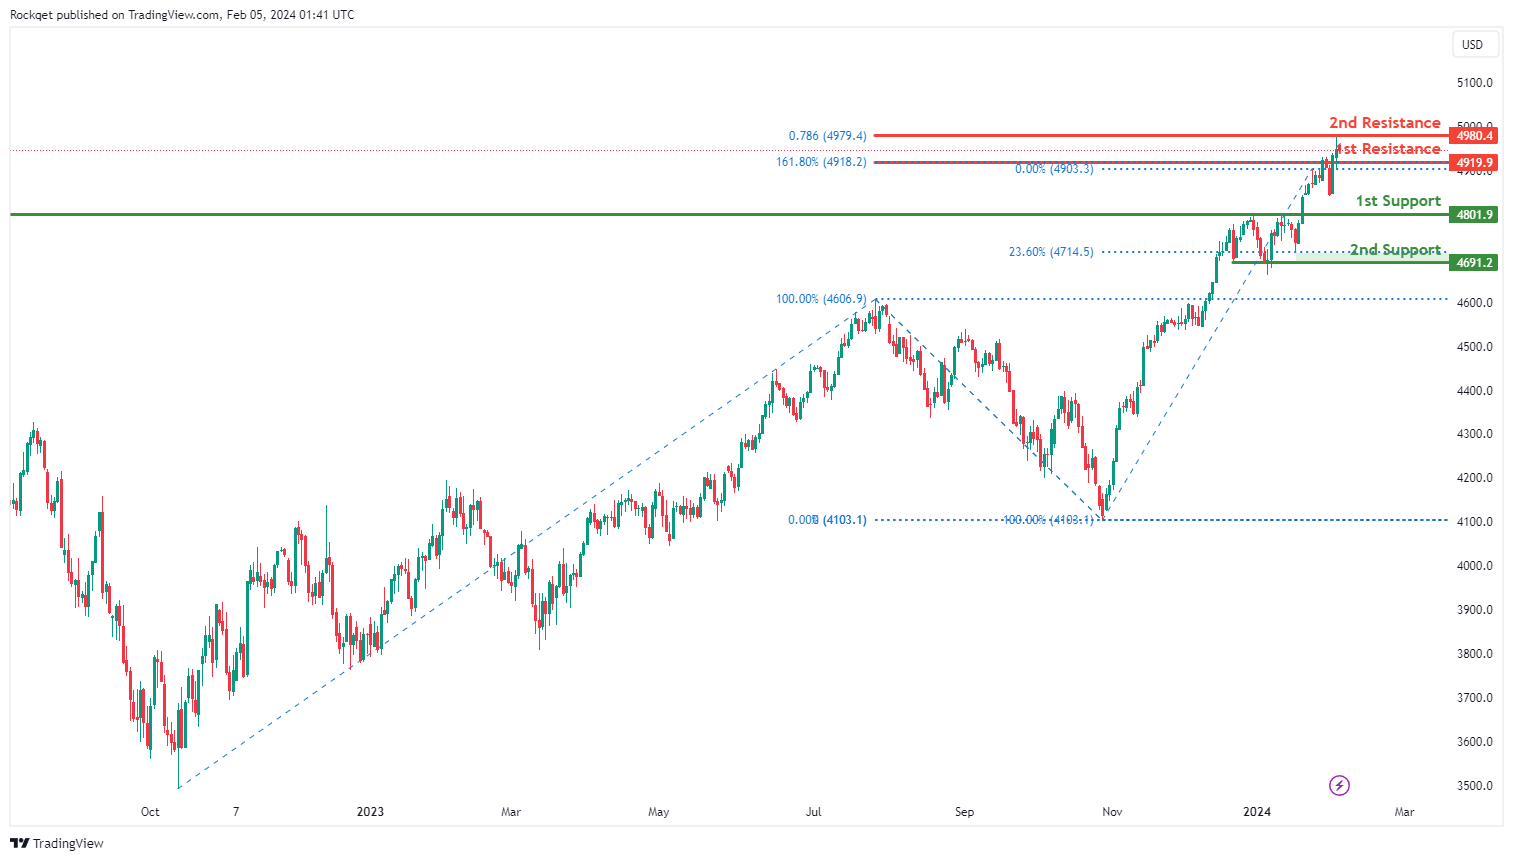
US500:
The US500 chart currently exhibits a bullish overall momentum, indicating a prevailing upward trend. There is a potential for a bullish breakthrough of the 1st resistance, with a subsequent rise to the 2nd resistance.
The 1st support at 4801.9 is considered favorable for various reasons. It is identified as an overlap support, suggesting a historical level where buying interest has previously emerged.
The 2nd support at 4691.2 is also recognized as a pullback support and aligns with the 23.60% Fibonacci Retracement, providing additional strength to the potential support zone.
On the resistance side, the 1st resistance at 4919.9 is highlighted, aligning with the 161.80% Fibonacci Extension. This suggests a potential breakout level where bullish momentum may accelerate.
The 2nd resistance at 4980.4 is also recognized, coinciding with the 78.60% Fibonacci Projection, adding further significance to this resistance level.
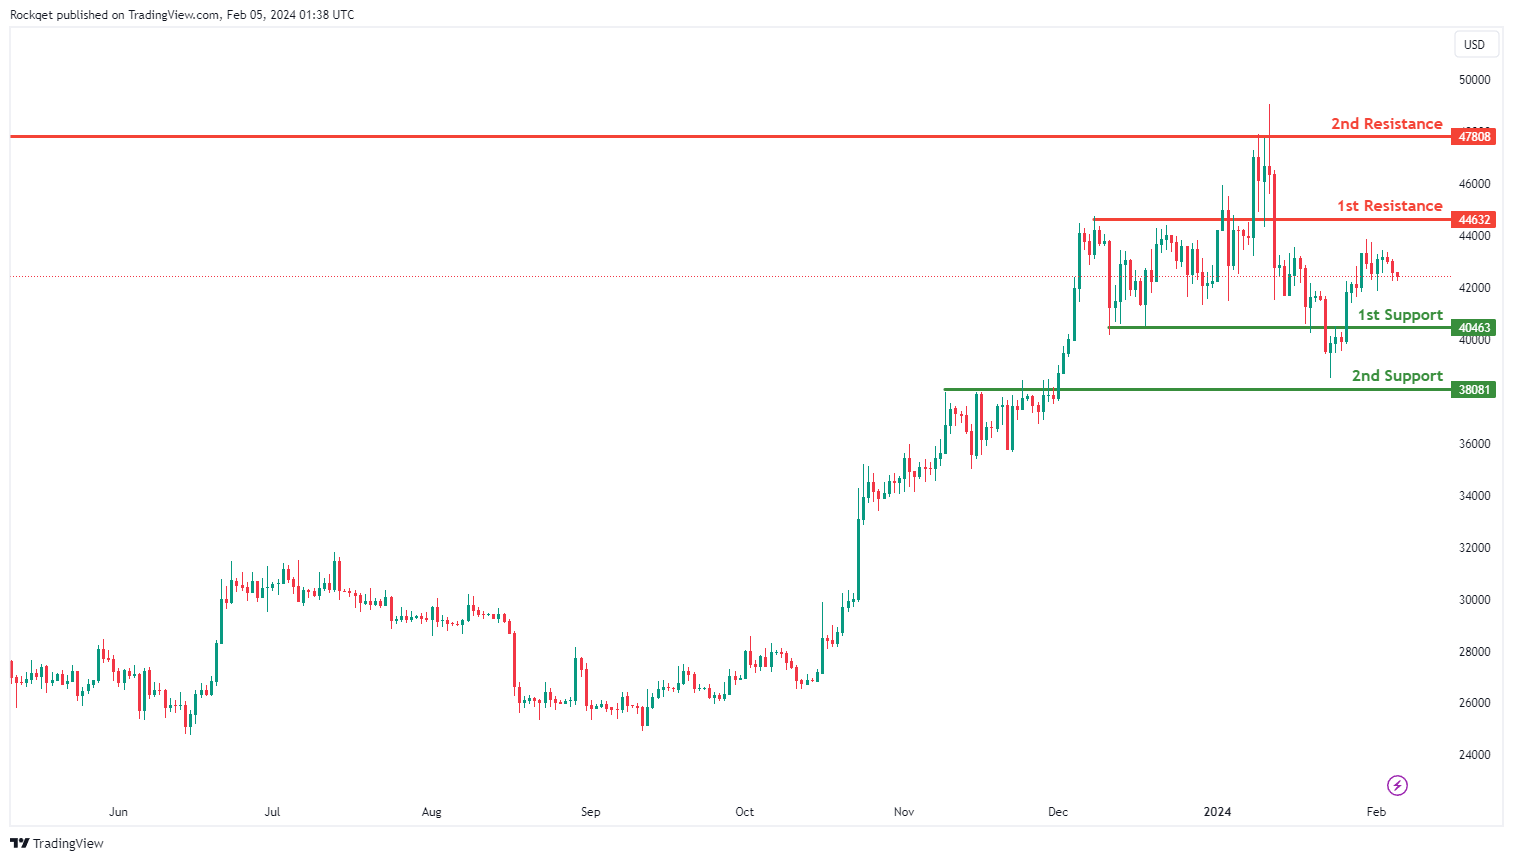
BTC/USD:
The BTC/USD chart currently demonstrates a neutral overall momentum, indicating a lack of a clear trend direction. The price could potentially make fluctuations between the 1st resistance and 1st support levels.
The 1st support at 40463 is viewed favorably for several reasons. Firstly, it is identified as an overlap support, suggesting a historical level where buying interest has previously emerged.
Additionally, the 2nd support at 38081 is recognized as a pullback support, providing additional strength to the potential support zone.
On the resistance side, the 1st resistance at 44632 is emphasized, aligning with an overlap resistance. This suggests a potential barrier to upward movement in the price.
The 2nd resistance at 47808 is also recognized, coinciding with multi-swing high resistance, adding further significance to this resistance level.
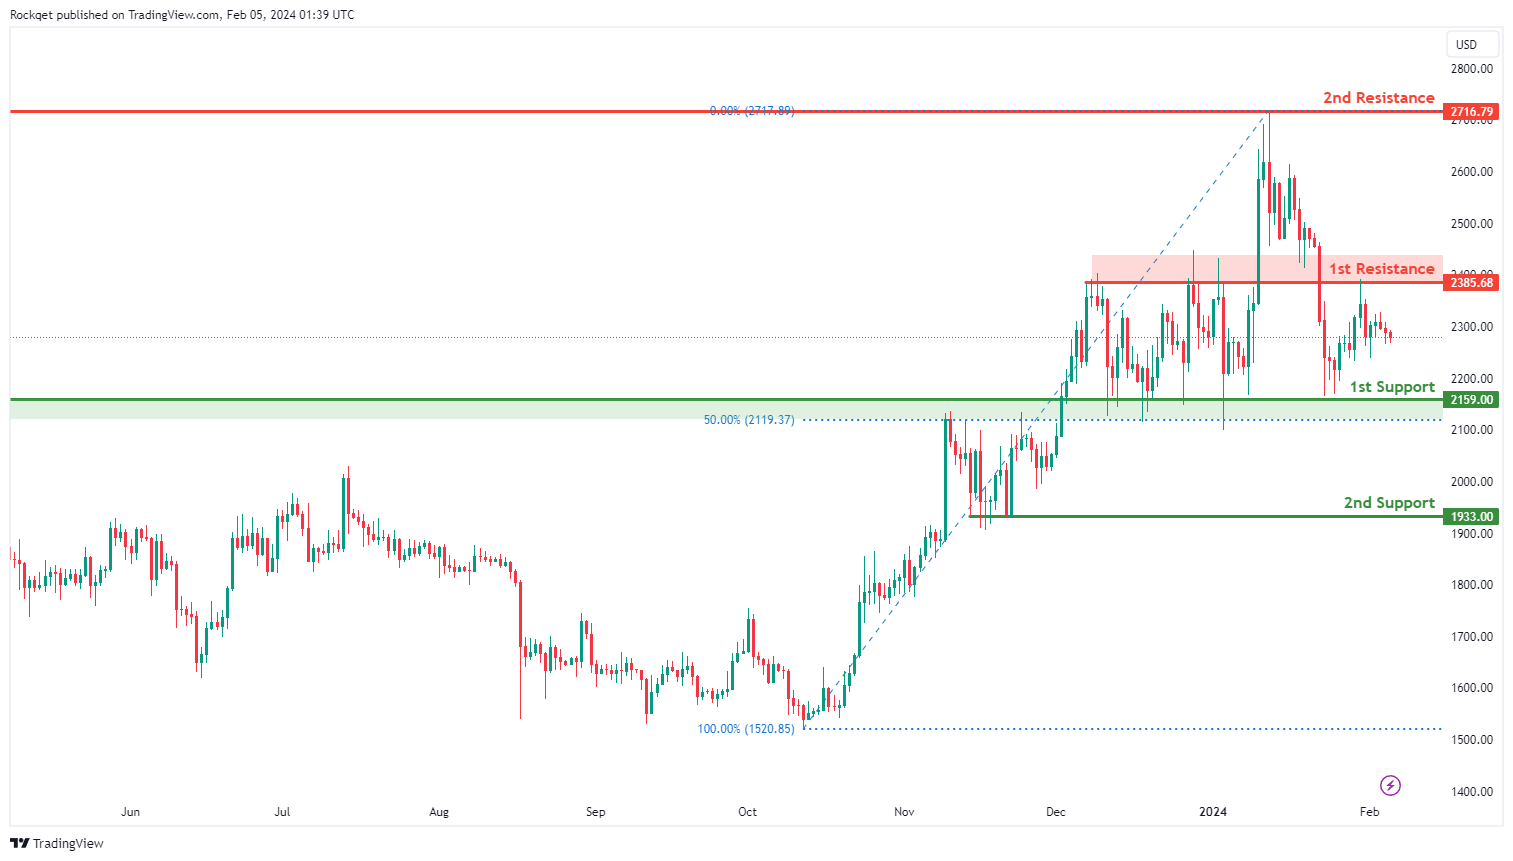
ETH/USD:
The ETH/USD chart currently demonstrates a neutral overall momentum, suggesting a lack of a clear directional trend. There is a potential for price to fluctuate between the 1st resistance and 1st support levels.
The 1st support at 2159.00 is considered favorable for various reasons. It is identified as an overlap support and aligns with the 50% Fibonacci Retracement, indicating a historical level where buying interest has previously emerged.
The 2nd support at 1933.00 is recognized as a pullback support, providing additional strength to the potential support zone.
On the resistance side, the 1st resistance at 2385.68 is highlighted, representing a level where selling pressure may emerge.
The 2nd resistance at 2716.79 is also recognized as an overlap resistance, adding further significance to this resistance level.
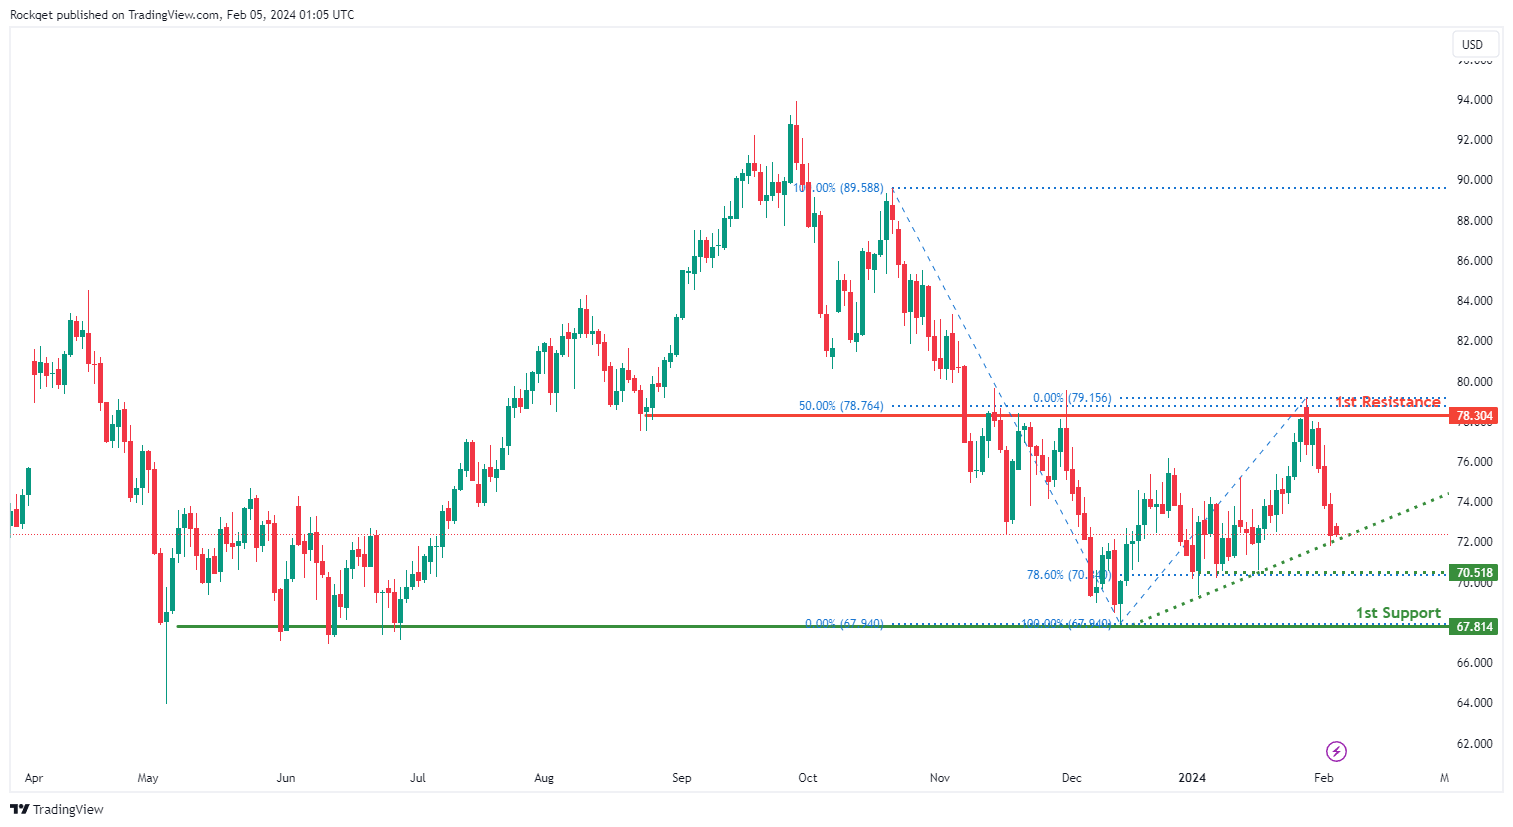
WTI/USD:
The WTI (West Texas Intermediate) chart currently exhibits an overall bearish momentum.In this context, there is a potential scenario for price to fall towards the 1st support should it break below the ascending trendline.
The intermediate support level at 70.51 is identified as a pullback support that aligns with the 78.60% Fibonacci retracement level while the 1st support level at 67.81 is noted as a multi-swing-low support, reinforcing its significance as a key support level.
To the upside, the 1st resistance level at 78.30 is identified as an overlap resistance that aligns with the 50.00% Fibonacci retracement level, further highlighting its importance as a potential resistance point.
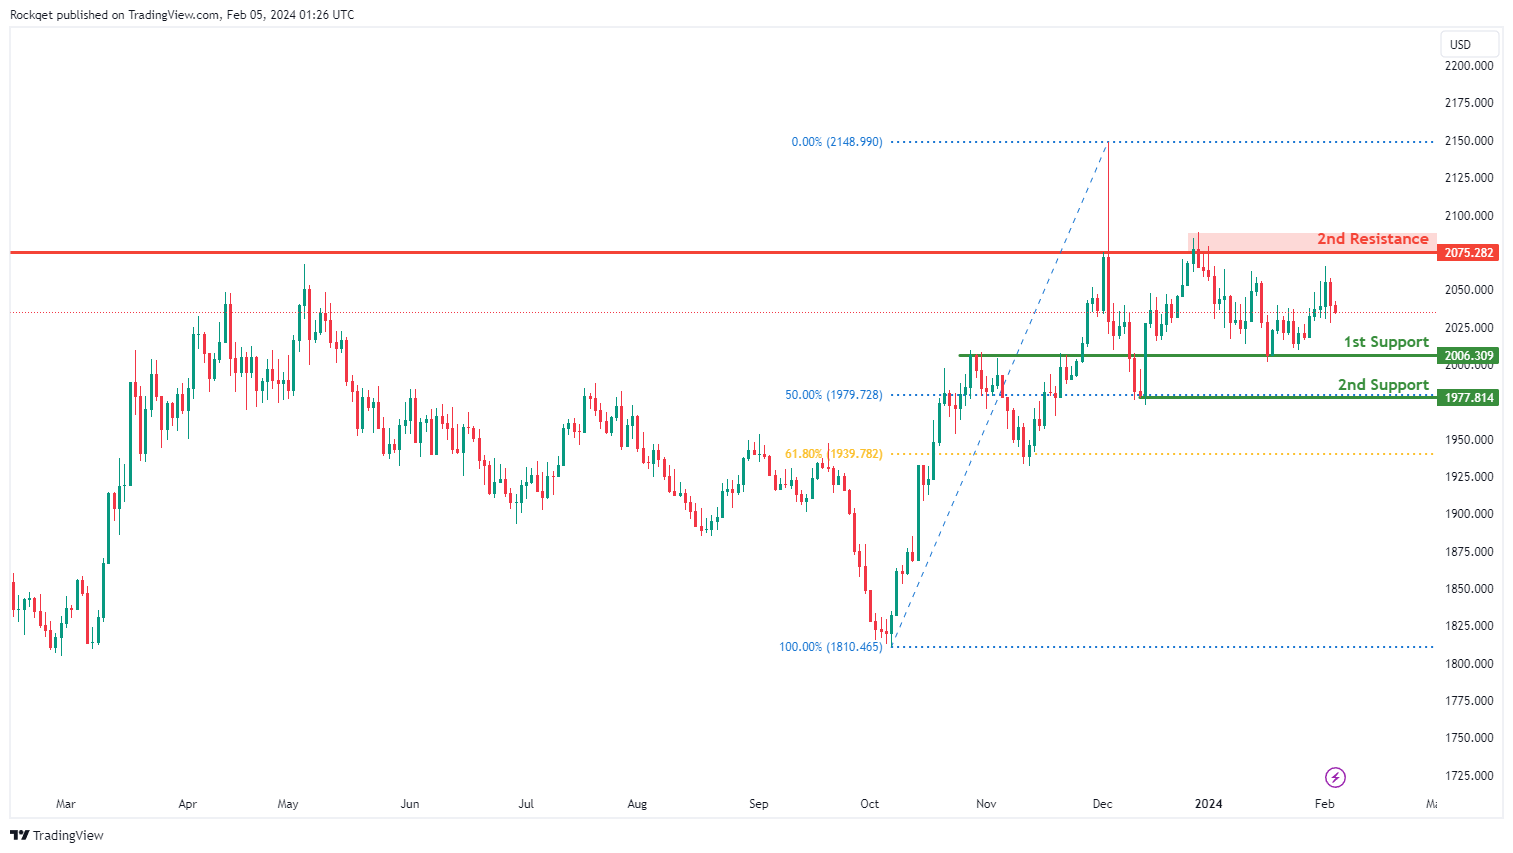
XAU/USD (GOLD):
The XAU/USD chart currently exhibits a bearish overall momentum, indicating a downward trend. According to the analysis, the price could potentially experience a bearish continuation towards the 1st support.
The 1st support level at 2006.30 is identified as an overlap support, suggesting that it represents a historical point where the price has found support in the past.
There is also a 2nd support level at 1977.81, characterized as a swing low support and associated with the 50% Fibonacci Retracement. This further reinforces its significance as a potential support zone.
On the resistance side, the 1st resistance level at 2975.28 is categorized as an overlap resistance, indicating that it represents a historical point where the price has encountered resistance.
The accuracy, completeness and timeliness of the information contained on this site cannot be guaranteed. IC Markets does not warranty, guarantee or make any representations, or assume any liability regarding financial results based on the use of the information in the site.
News, views, opinions, recommendations and other information obtained from sources outside of www.icmarkets.com, used in this site are believed to be reliable, but we cannot guarantee their accuracy or completeness. All such information is subject to change at any time without notice. IC Markets assumes no responsibility for the content of any linked site.
The fact that such links may exist does not indicate approval or endorsement of any material contained on any linked site. IC Markets is not liable for any harm caused by the transmission, through accessing the services or information on this site, of a computer virus, or other computer code or programming device that might be used to access, delete, damage, disable, disrupt or otherwise impede in any manner, the operation of the site or of any user’s software, hardware, data or property.


