
Key risk events today:
Limited.
(Previous analysis as well as outside sources – italics).
EUR/USD:
Weekly gain/loss: +1.45%
Weekly close: 1.0978
Weekly perspective:
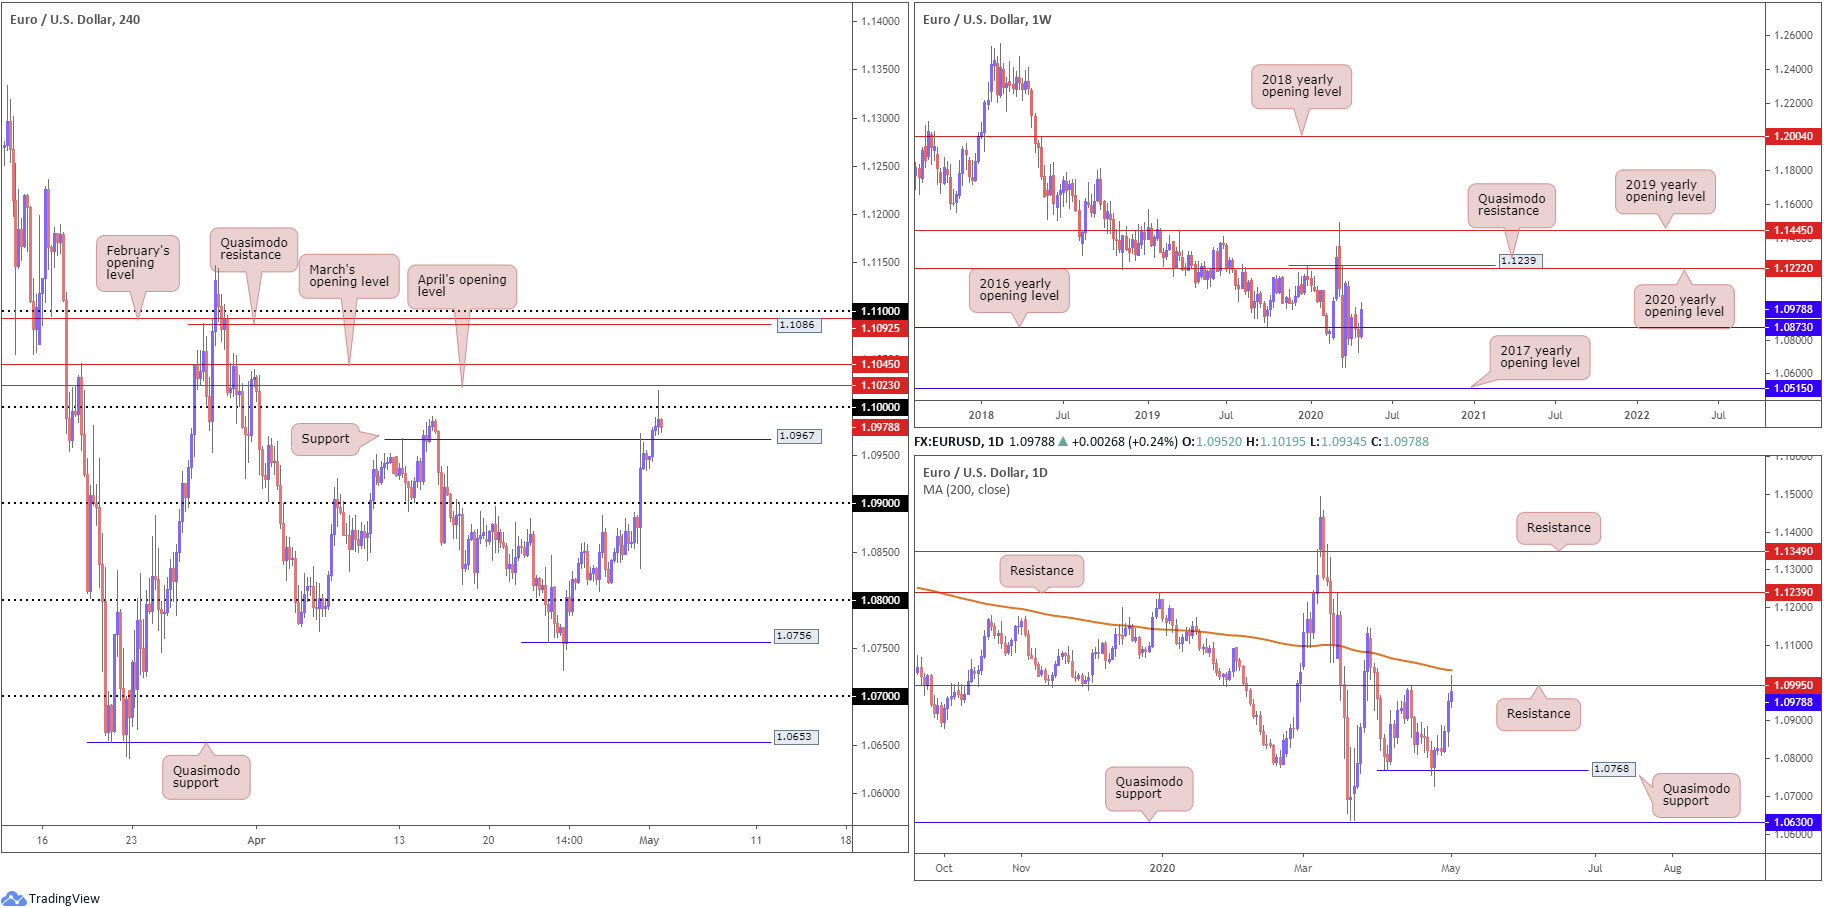
EUR/USD witnessed a resurgence of bidding last week, establishing a robust position north of the 2016 yearly opening level at 1.0873. Should the single currency remain on the winning side of the table going forward, the 2020 yearly opening level from 1.1222 could eventually put in an appearance, followed by Quasimodo resistance at 1.1239.
Daily perspective:
Wednesday observed buyers reassert their dominance, with Friday dipping a toe in waters north of resistance at 1.0995, a few pips short of the 200-day SMA (orange – 1.1034). Candlestick enthusiasts may also recognise Friday closed by way of a half-hearted shooting star pattern, considered a bearish signal at peaks.
While a rejection to the downside could be in store, we cannot rule out the possibility of fresh upside attempts to the said SMA value over the coming week, with a break exposing the 1.1147 March 27 high and resistance priced in at 1.1239 (essentially the same plot as the weekly Quasimodo resistance formation).
H4 perspective:
The euro gleaned fresh impetus on the back of weaker-than-expected US manufacturing PMI data, as we transitioned into US hours Friday. The headline release fell to 41.5 from 49.1, better than the expected 36.7.
The Institute for Supply Management noted:
The April PMI registered 41.5 percent, down 7.6 percentage points from the March reading of 49.1 percent. The New Orders Index registered 27.1 percent, a decrease of 15.1 percentage points from the March reading of 42.2 percent. The Production Index registered 27.5 percent, down 20.2 percentage points compared to the March reading of 47.7 percent[1].
The move rushed buy stops above the key figure 1.10, though topped at 1.1019 before reverting to a mild defensive play and closing ahead of support at 1.0967, a prior Quasimodo resistance level. Levels north of 1.10, April’s opening level at 1.1023 and March’s opening level at 1.1045, remain untouched for now. South of 1.0967, however, likely has traders’ crosshairs fixed on the 1.09 handle.
Areas of consideration:
A H4 close beneath 1.0967 may help confirm seller intent off daily resistance at 1.0995 this week, highlighting the possibility of an approach to 1.09, perhaps even prompting a retest at the 2016 yearly opening level from 1.0873 on the weekly timeframe. Conservative sellers will likely seek a retest at the underside of 1.0967 before pulling the trigger.
In terms of potential long opportunities this week, we don’t really see much in the offing until a H4 close above 1.1045 occurs. Even then, though, H4 Quasimodo resistance at 1.1086 stands nearby.
GBP/USD:
Weekly gain/loss: +1.02%
Weekly close: 1.2487
Weekly perspective:
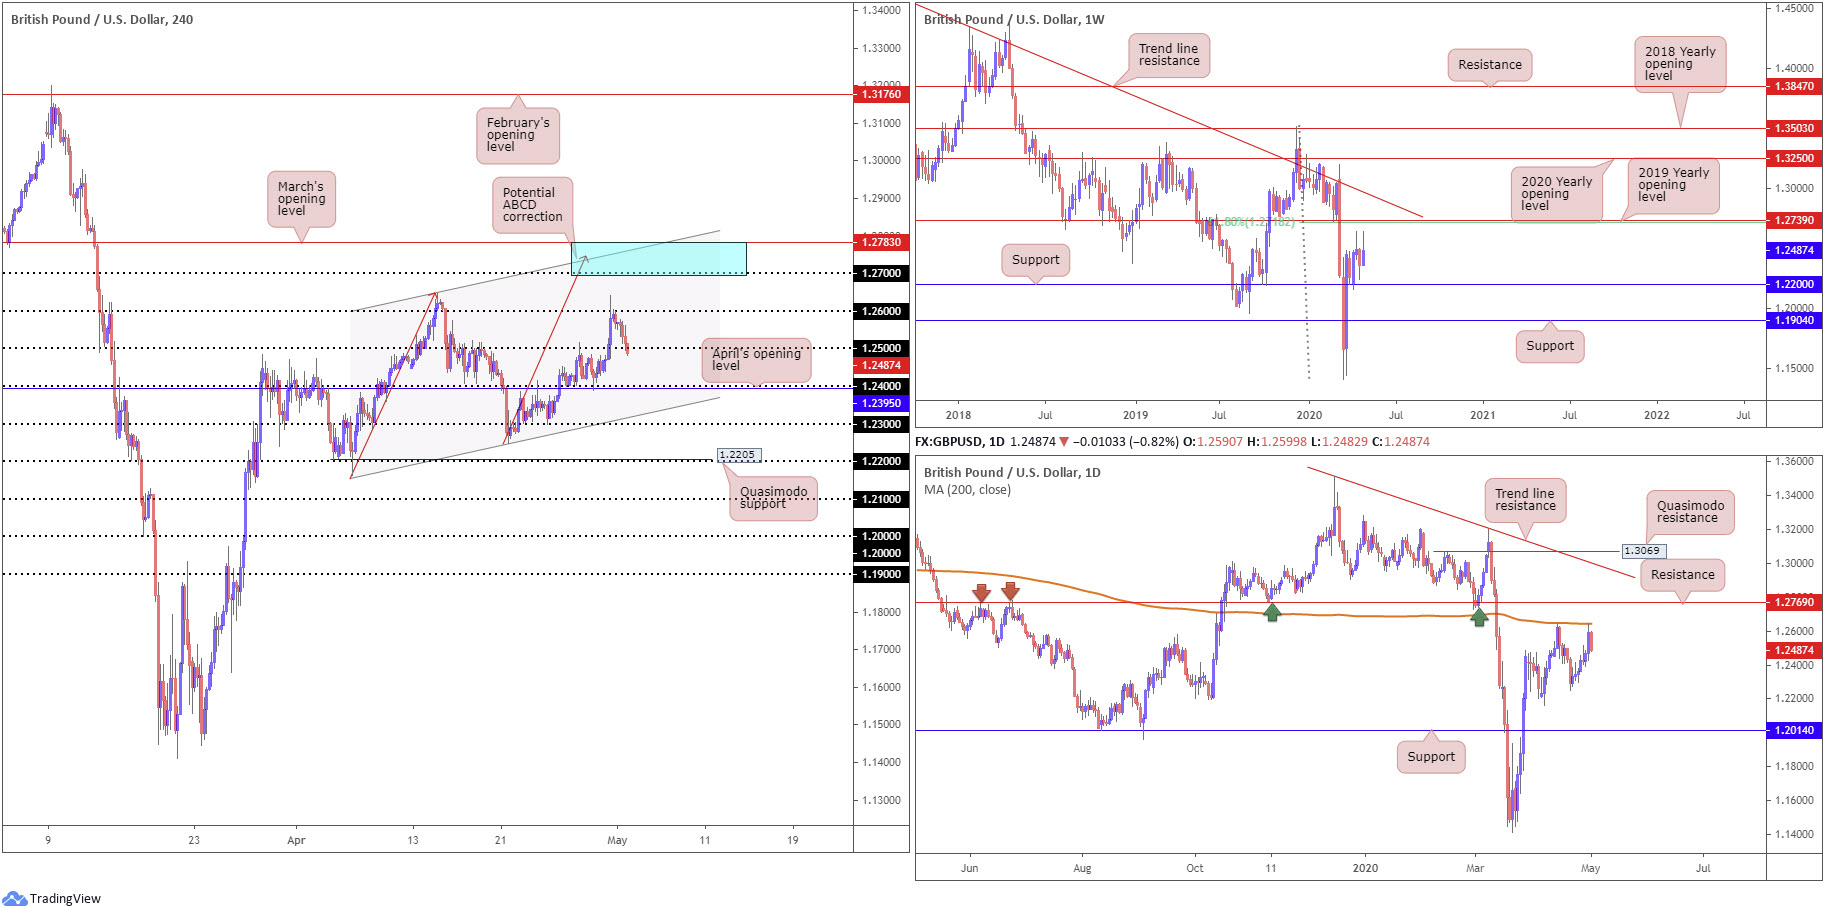
Support at 1.2200 remains a pivotal base on the weekly timeframe, holding price action higher since the beginning of April. Scope to explore higher ground is visible until reaching the 2019 yearly opening level at 1.2739, which aligns closely with a 61.8% Fibonacci retracement ratio at 1.2718. A break of the aforementioned levels reveals a long-standing trend line resistance, taken from the high 1.5930.
In addition to the above, we can also see the pair pulling back from historic lows at 1.1409, therefore sellers could eventually make a run for fresh lows.
Daily perspective:
The 200-day SMA (orange – 1.2644) remains a dominant fixture on the daily timeframe, providing resistance on two occasions in April. Friday, as evident from the chart, finished in the shape of a bearish inside day, snapping a two-day bullish phase and underlining the 1.2247 April 21 low as possible support this week. Directly north of the SMA value, traders may also want to acknowledge notable resistance coming in from 1.2769.
H4 perspective:
Sterling maintained a downward trajectory Friday, following Thursday’s failure to dethrone 1.26. Less-than-stellar US manufacturing PMI data sparked modest GBP bidding, though lacked meaning. The day concluded eroding much of Thursday’s gains, eventually shaking hands with levels a touch under 1.25.
Past 1.25, we could see the pair knocking on 1.24’s door this week, a level intersecting with April’s opening level from 1.2395. Also note the channel support, extended from the low 1.2163.
Aside from 1.26, the next port of call to the upside resides around 1.27, closely shadowed by channel resistance, taken from the high 1.2647, a potential ABCD correction (red arrows) at 1.2745 and March’s opening level at 1.2783.
Areas of consideration:
The 200-day SMA value at 1.2644 may hamper upside attempts this week, igniting the possibility of further selling beyond 1.25.
A H4 close above 1.26, however, remains interesting. In Friday’s technical briefing, we highlighted that a close above 1.26 would not only prompt breakout buying towards 1.27, it would also highlight the area marked in blue between 1.2783/1.27 (blue) as a strong reversal zone for potential shorting opportunities. In addition to the H4 confluence, you will note weekly resistance at 1.2739 (2019 yearly opening level) and daily resistance from 1.2769.
AUD/USD:
Weekly gain/loss: +0.35%
Weekly close: 0.6416
Weekly perspective:
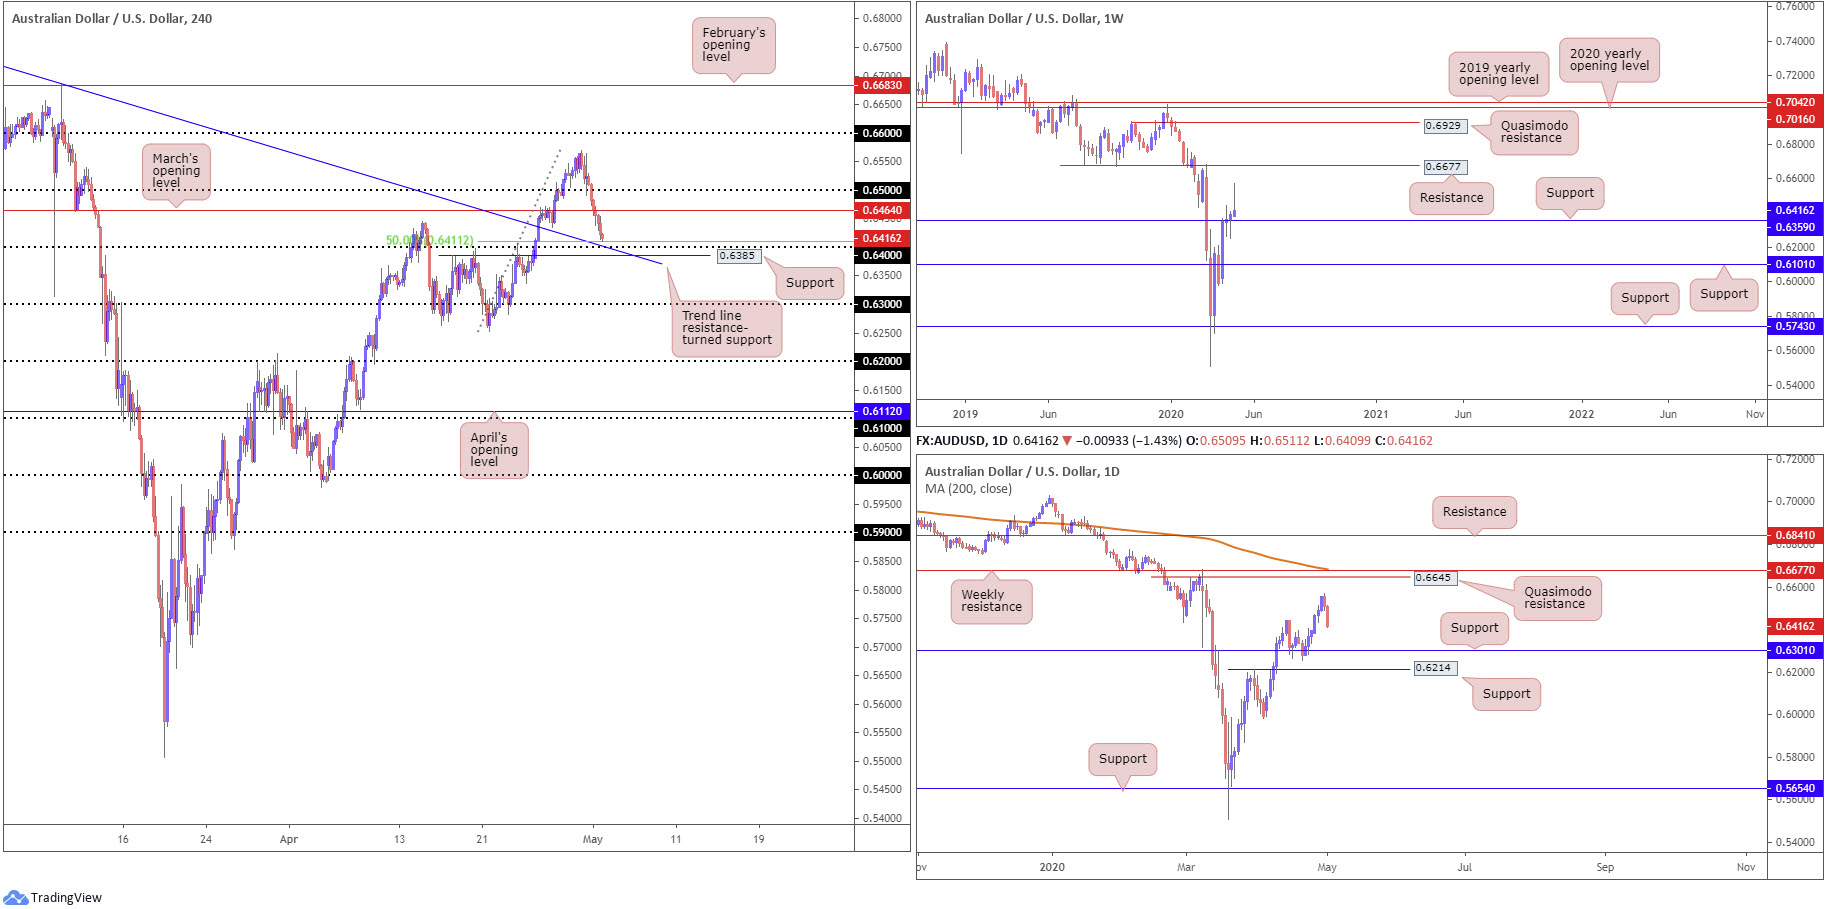
Organised as a shooting star candlestick configuration, the week closed sharply off best levels. Although a mark of seller intent, the noted candlestick signal may find difficulty attracting sellers this week due to support positioned at 0.6359.
With that being the case, pencilling in resistance at 0.6677 may be an idea in the event we pop higher.
Daily perspective:
After snapping a six-day bullish phase against the buck Thursday, Friday saw strong follow-through selling materialise, erasing more than 90 points, or 1.40%.
Support at 0.6301 may come under fire this week, with support at 0.6214 also perhaps entering the mix. With respect to resistance, a Quasimodo formation at 0.6645 is in sight, parked just ahead of the weekly resistance level mentioned above at 0.6677 and the 200-day SMA (orange – 0.6683).
H4 perspective:
Friday’s extension to the downside overthrew March’s opening level at 0.6464 in reasonably dominant fashion, and bottomed a few pips ahead of the 0.64 handle. Although a key figure by and of itself, 0.64 also comes together with a notable trend line resistance-turned support, taken from the high 0.7031, a Quasimodo resistance-turned support at 0.6385 and a 50.0% retracement value at 0.6411 (which entered play into the close).
Sub 0.64, limited support exists until crossing swords with the 0.63 handle, which also represents daily support mentioned above at 0.6301.
Areas of consideration:
While 0.64 boasts limited confluence from the higher timeframes, the H4 confluence (see above in bold) may be enough to prompt a rebound from this region this week. Prudent traders, however, may feel the need to wait for additional confirmation to form before taking action; whipsaws through round numbers are common viewing.
The fact weekly support inhabits 0.6359 may deter breakout sellers beneath 0.64 this week. Though 40 pips may still be sufficient to tempt some to engage.
USD/JPY:
Weekly gain/loss: -0.52%
Weekly close: 106.88
Weekly perspective:
The weekly timeframe continues to emphasise a bearish tone.
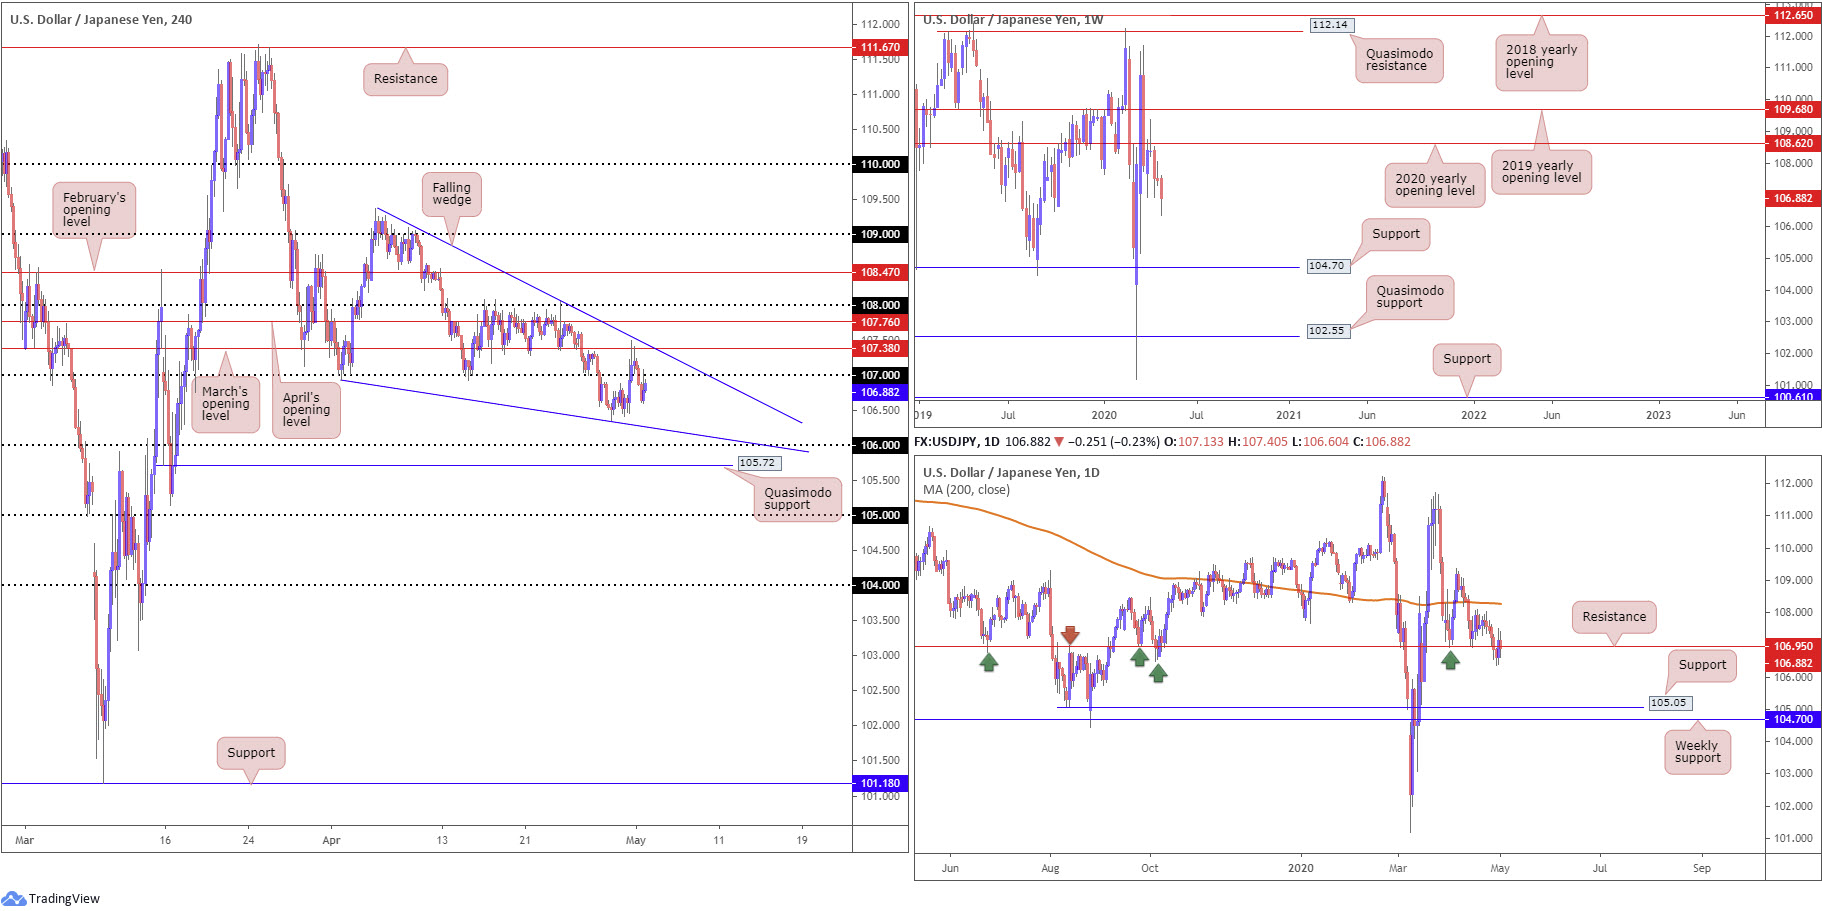
In recent action, price produced a clear-cut shooting star candlestick configuration off the 2020 yearly opening level at 108.62, with a strong follow-through move to the downside seen thereafter. Last week, as you can see, extended losses, with support not expected to emerge until reaching 104.70.
Daily perspective:
Resistance at 106.95 maintains a presence on the daily timeframe, despite Thursday’s modest recovery to highs at 107.49, one that snapped a six-day bearish phase. Additional resistance is not seen until reaching the 200-day SMA (orange – 108.27).
106.95 boasts notable history (arrows), therefore moves south of the base could see an approach form to support at 105.05 this week.
H4 perspective:
Early trade off March’s opening level at 107.38 saw the candles reclaim 107 to the downside going into the London session on Friday, and retest the base amid early US hours. Pattern-based traders will also recognise a falling wedge forming between 109.38/106.92.
The 106 handle is also a worthwhile level to have on the watchlist this week, closely shadowed by Quasimodo support priced in at 105.72.
Areas of consideration:
While price could potentially continue compressing within the H4 falling wedge pattern this week, a fakeout through orders at 106 to Quasimodo support at 105.72 is a scenario worth underlining. A whipsaw through 106 followed up with a H4 close north of the round number could signal buyers want to take things higher. However, this would entail going up against daily sellers from resistance at 106.95 and weekly directional flow.
In terms of resistance, keep eyes on the 107 handle and March’s opening level at 107.38 this week. Daily resistance at 106.95, as you’re probably aware, reinforces 107.
USD/CAD:
Weekly gain/loss: -0.04%
Weekly close: 1.4087
Weekly perspective:
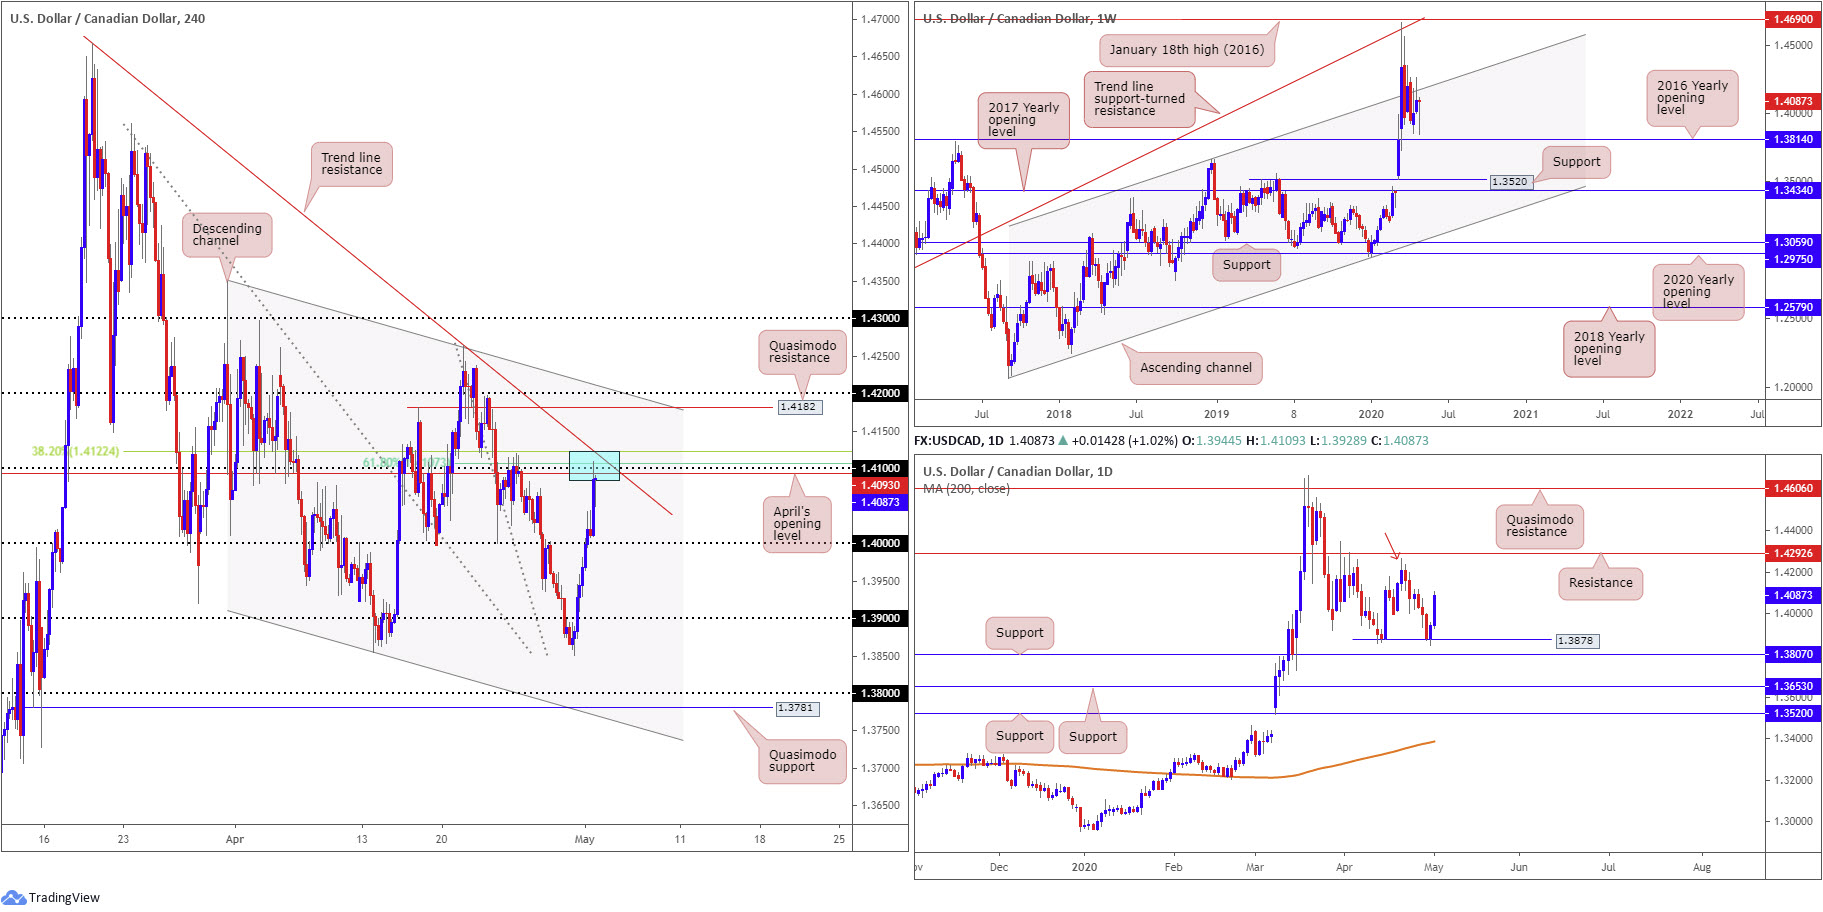
Despite ranging more than 260 pips on the week, price action concluded mostly unmoved, shaped by way of a dragonfly doji candlestick pattern, typically interpreted as a bullish reversal candlestick signal that mainly occurs at the bottom of down moves.
Structurally, channel resistance, extended from the high 1.3661, remains a prominent line on this timeframe. To the downside, the 2016 yearly opening level at 1.3814 denotes support.
Daily perspective:
Thanks to an end-of-week advance in the form of a near-full-bodied bullish candle, double-bottom support formed at 1.3878. However, traditional interpretation would have the peak at 1.4265 engulfed (red arrow) before confirming the formation as a buy signal. This would also entail overturning resistance at 1.4292.
Space below 1.3878 offers little room for manoeuvre with support positioned at 1.3807.
H4 perspective:
Friday ended the week on a strong footing, eclipsing the key figure 1.40 and testing the mettle of 1.41. There are a number of technical aspects on the H4 scale suggesting 1.41 may contain upside early week. April’s opening level stands at 1.4093, a 61.8% Fibonacci retracement ratio is seen at 1.4107, a 38.2% Fibonacci retracement ratio comes in at 1.4122 and we also have a trend line resistance, etched from the high at 1.4667 (blue).
Air above 1.41 appears relatively thin until engaging with Quasimodo resistance from 1.4182, closely surrounded by the 1.42 handle and a channel resistance, taken from the high 1.4349.
Areas of consideration:
In spite of the fact that the round number 1.41 carries little weight on the higher timeframes, the odds of a reaction forming off the said level is high owing to H4 confluence (see above in bold).
One approach, therefore, may see aggressive traders enter short at current price and position protective stop-loss orders above the H4 trend line resistance. Other traders may favour more of a conservative approach, one that determines entry on the back of a bearish candlestick signal, think shooting star patterns and bearish engulfing formations, for example.
USD/CHF:
Weekly gain/loss: -1.18%
Weekly close: 0.9609
Weekly perspective:
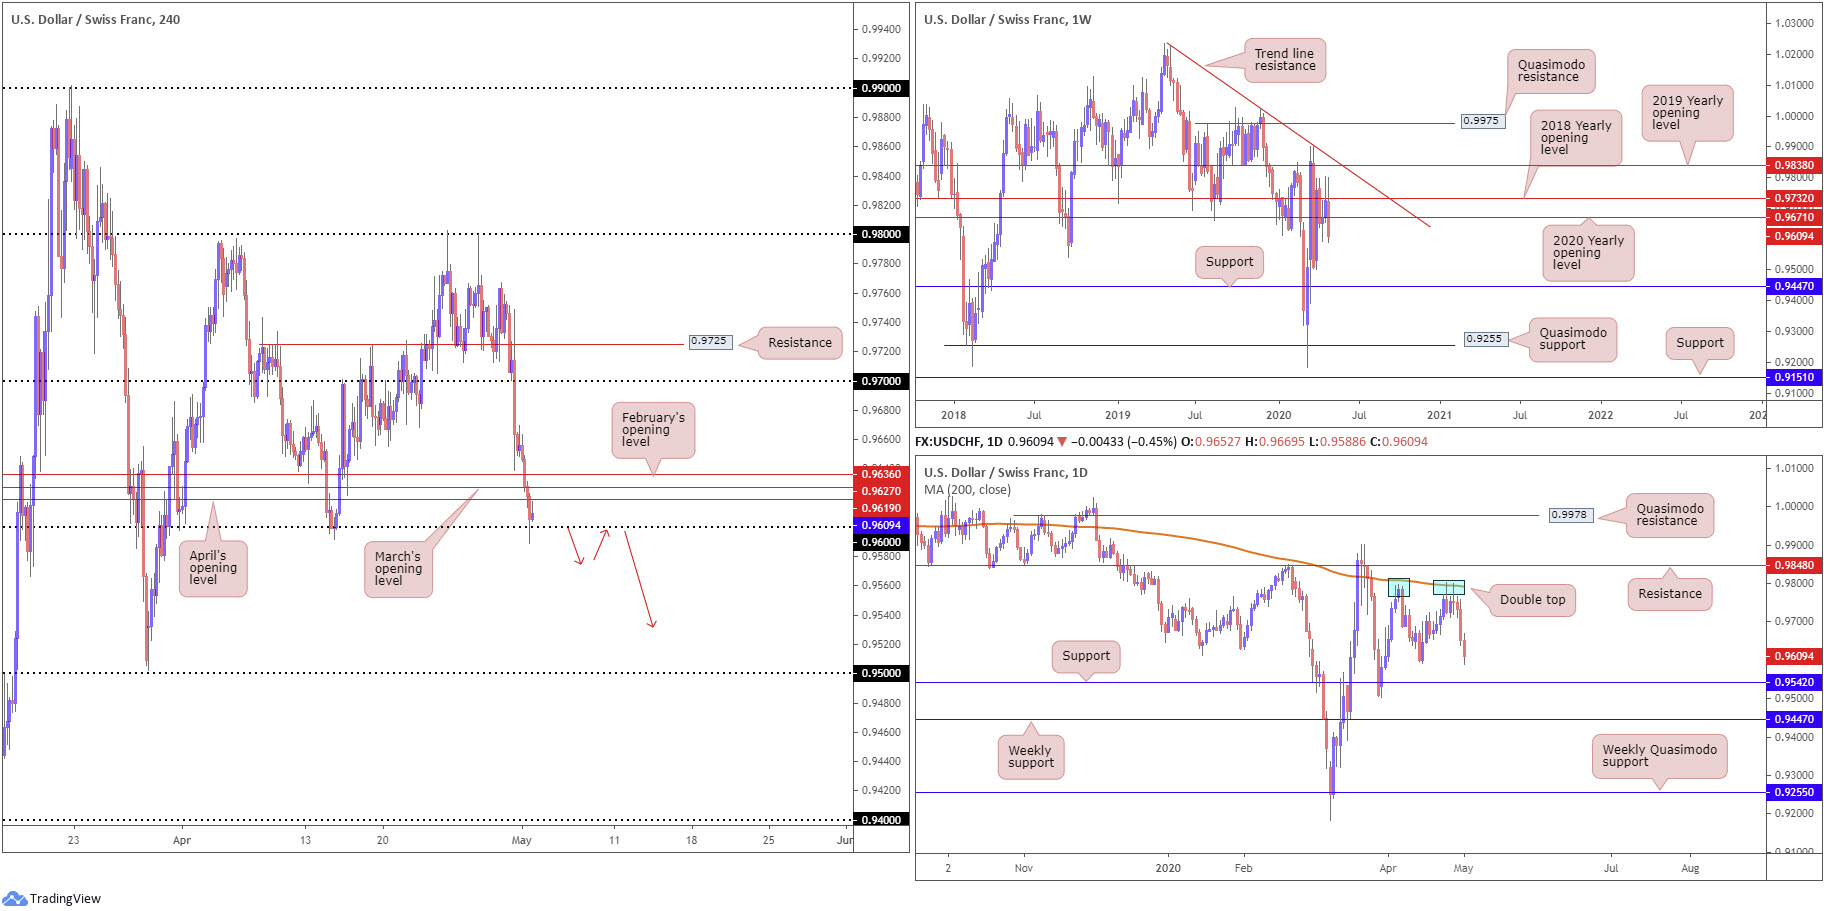
Buyers clearly lost their flavour last week as the US dollar found itself under significant pressure against the Swiss franc last week, losing more than 110 points by the close.
With the 2020 yearly opening level at 0.9671 cleared, the river south appears ‘ripple free’ until reaching support fixed at 0.9447.
Daily perspective:
Price action on the daily timeframe shows the 200-day SMA (orange – 0.9792) remained steadfast resistance, withstanding two upside attempts in recent trading. Aside from the 0.9592 April 15 low, we have support priced in at 0.9542 this week, situated ahead of weekly support at 0.9447.
Pattern traders may also recognise the potential double-top formation around 0.9800 (blue). However, traditional interpretation would have the trough at 0.9592 engulfed before confirming the formation as a sell signal. This would also entail engaging with support mentioned above at 0.9542.
H4 perspective:
Broad-based USD selling guided USD/CHF beneath 0.9619/0.9636, a zone made up of April, March and February’s opening levels, leading to a test of the 0.96 handle into the closing stages of the week. Despite mildly paring losses into the close off 0.96, we feel 0.9619/0.9636 may just be too much resistance to overcome for buyers here. This, coupled with weekly price signifying lower levels this week and daily price close to confirming a double-top scenario, may see H4 sellers attempt an approach towards 0.95.
Areas of consideration:
A H4 close beneath 0.96 is likely to be viewed as a strong bearish indicator this week, targeting daily support at 0.9542 as the initial target, followed by the 0.95 handle on the H4 and then support at 0.9447 on the weekly timeframe. Conservative traders, as per the red arrows, will likely want to see a retest at 0.96 before committing, in order to help avoid getting caught on a whipsaw.
Dow Jones Industrial Average:
Weekly gain/loss: -0.16%
Weekly close:23728
Weekly perspective:
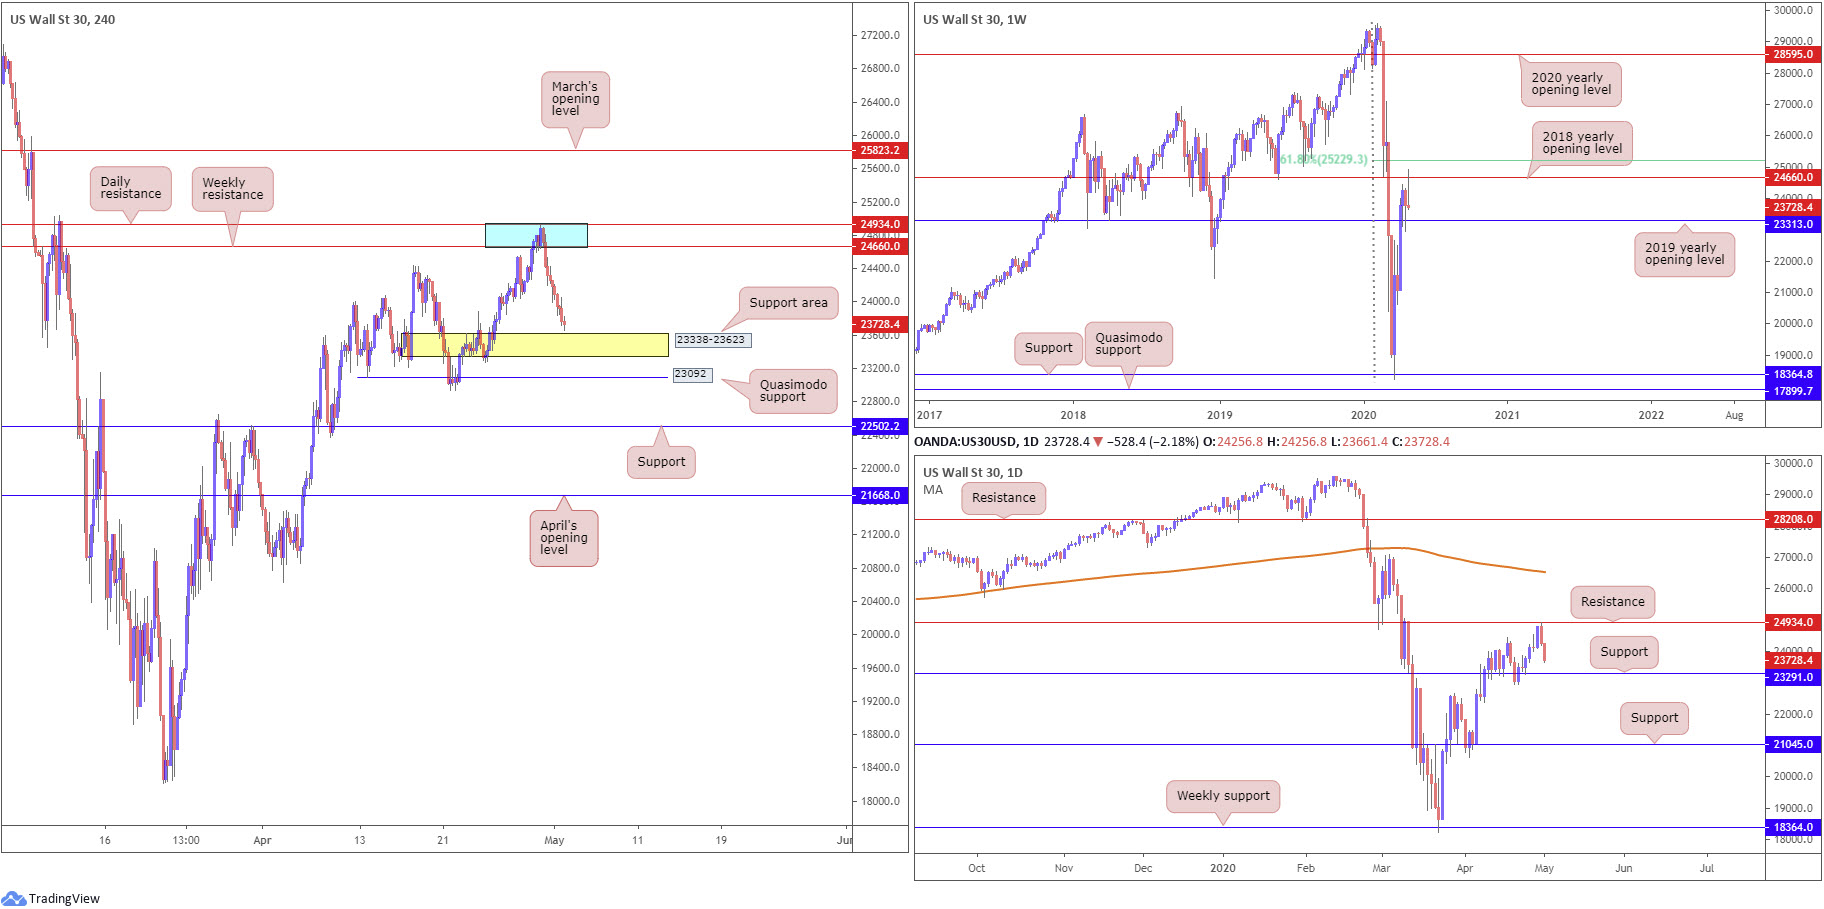
Technical action on the weekly timeframe welcomed the 2018 yearly opening level at 24660 into view last week, missing the 61.8% Fibonacci retracement ratio at 25229 by only a few points before wrapping up the week in the form of a gravestone doji candlestick pattern. This formation implies sellers may now have the upper hand.
The next downside target on this scale can be found at the 2019 yearly opening level at 23313.
Daily perspective:
From the daily timeframe, we can see price came within touching distance of connecting with resistance at 24934 Thursday before chalking up back-to-back near-full-bodied bearish candles. Support on this timeframe falls in close by at 23291, with a break perhaps uncovering support at 21045.
H4 perspective:
Major US benchmarks finished Friday in negative territory amid less-than-impressive economic data and a possible renewal of US-China trade tensions. The Dow Jones Industrial Average erased 622.03 points, or 2.55%; the S&P 500 lost 81.72 points, or 2.81%, and the tech-heavy Nasdaq 100 concluded lower by 282.33 points, or 3.14%.
For those who read Thursday’s technical briefing you may recall the following piece (italics):
Technical action observed H4 candles drive into a potential resistance area, made up of daily resistance coming in at 24934 and weekly resistance from 24660 (blue). Breaking through this zone sets the stage for an approach to the 61.8% Fibonacci retracement ratio at 25229 on the weekly timeframe, followed by March’s opening level at 25823 on the H4 scale. Downside from 24934/24660 could have H4 price drive as far south as a support area (yellow) at 23338-23623.
In Friday’s report, the following points were aired (italics):
As can be seen from the H4 timeframe this morning, in the shape of a bearish inside candlestick pattern, 24934/24660 contained upside on Thursday, sliding to lows of 23994.
Those short this market will have likely reduced risk to breakeven at this point, with eyes perhaps on the H4 support area at 23338-23623 as an initial take-profit target.
Areas of consideration:
Traders short 24934/24660 likely liquidated a large portion of their position ahead of the H4 support zone at 23338-23623 prior to the close.
Additional take-profit targets can be seen beyond the said support area at the current higher-timeframe supports (23291/23313), as well as H4 Quasimodo support at 23092. In fact, between the said Quasimodo support and higher-timeframe supports may be an area we see buyers make an appearance from this week.
XAU/USD (GOLD):
Weekly gain/loss: -1.69%
Weekly close: 1698.2
Weekly perspective:
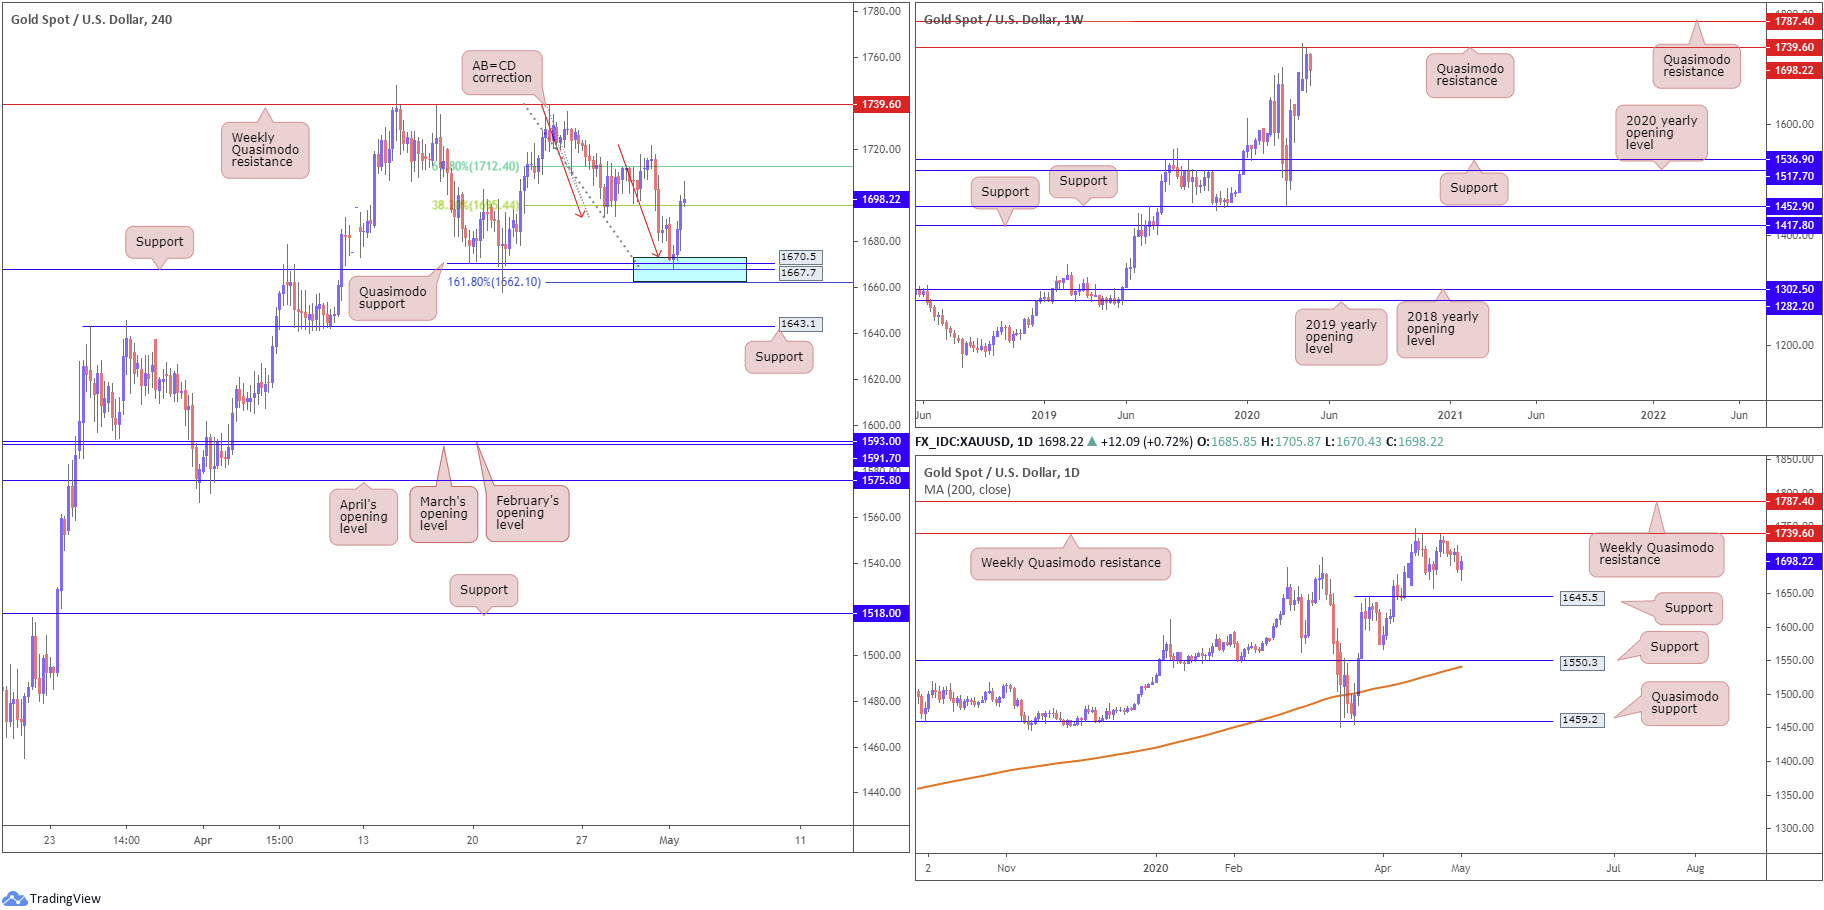
Over the past couple of weeks, we have seen buyers and sellers square off around the underside of a weekly Quasimodo resistance at 1739.6, with last week’s movement eroding nearly $30, though finished the session off worst levels.
Sustained downside from this region echoes the possibility of reaching support at 1536.9, while a breach of 1739.6 shines the spotlight on another layer of Quasimodo resistance at 1787.4.
The primary trend on gold has faced a northerly trajectory since 2016.
Daily perspective:
In similar fashion to the weekly timeframe, the weekly Quasimodo formation at 1739.6 is also posted as prominent resistance on the daily chart. The difference can be seen by way of the supports: the next support target on the daily timeframe falls in at 1645.5.
H4 perspective:
For those who read Friday’s technical briefing you may recall the following (italics):
Despite the back-to-back H4 indecision candles, recent movement positioned H4 within striking distance of a particularly interesting base of support between 1662.1/1673.1 (comprised of a 161.8% Fibonacci extension point at 1662.1, H4 support at 1667.7, Quasimodo support at 1670.5 and an AB=CD correction at 1673.1 [red arrows]).
As evident from the chart this morning, 1662.1/1673.1 (blue) rebounded price action strongly on Friday, amid risk aversion and a USD decline. Traders likely reduced risk to breakeven at the 38.2% Fibonacci retracement ratio at 1695.4, with most expecting a continuation move to the 61.8% Fibonacci retracement ratio at 1712.4 (common take-profit targets out of AB=CD corrections).
Areas of consideration:
Having seen H4 price conclude the week in the shape of a shooting star candle pattern, traders have to consider the possibility of price not reaching the 61.8% Fibonacci retracement ratio at 1712.4. However, given the primary trend faces north, further buying could still be seen, with a retest at the weekly Quasimodo from 1739.6 potentially on the cards.
In the event we print a H4 close above 1739.6 this week, we’ll likely see breakout buyers make a show, targeting weekly Quasimodo resistance at 1787.4.
The accuracy, completeness and timeliness of the information contained on this site cannot be guaranteed. IC Markets does not warranty, guarantee or make any representations, or assume any liability regarding financial results based on the use of the information in the site.
News, views, opinions, recommendations and other information obtained from sources outside of www.icmarkets.com.au, used in this site are believed to be reliable, but we cannot guarantee their accuracy or completeness. All such information is subject to change at any time without notice. IC Markets assumes no responsibility for the content of any linked site.
The fact that such links may exist does not indicate approval or endorsement of any material contained on any linked site. IC Markets is not liable for any harm caused by the transmission, through accessing the services or information on this site, of a computer virus, or other computer code or programming device that might be used to access, delete, damage, disable, disrupt or otherwise impede in any manner, the operation of the site or of any user’s software, hardware, data or property.
[1] https://www.instituteforsupplymanagement.org/ISMReport/MfgROB.cfm?navItemNumber=29317&SSO=1


