
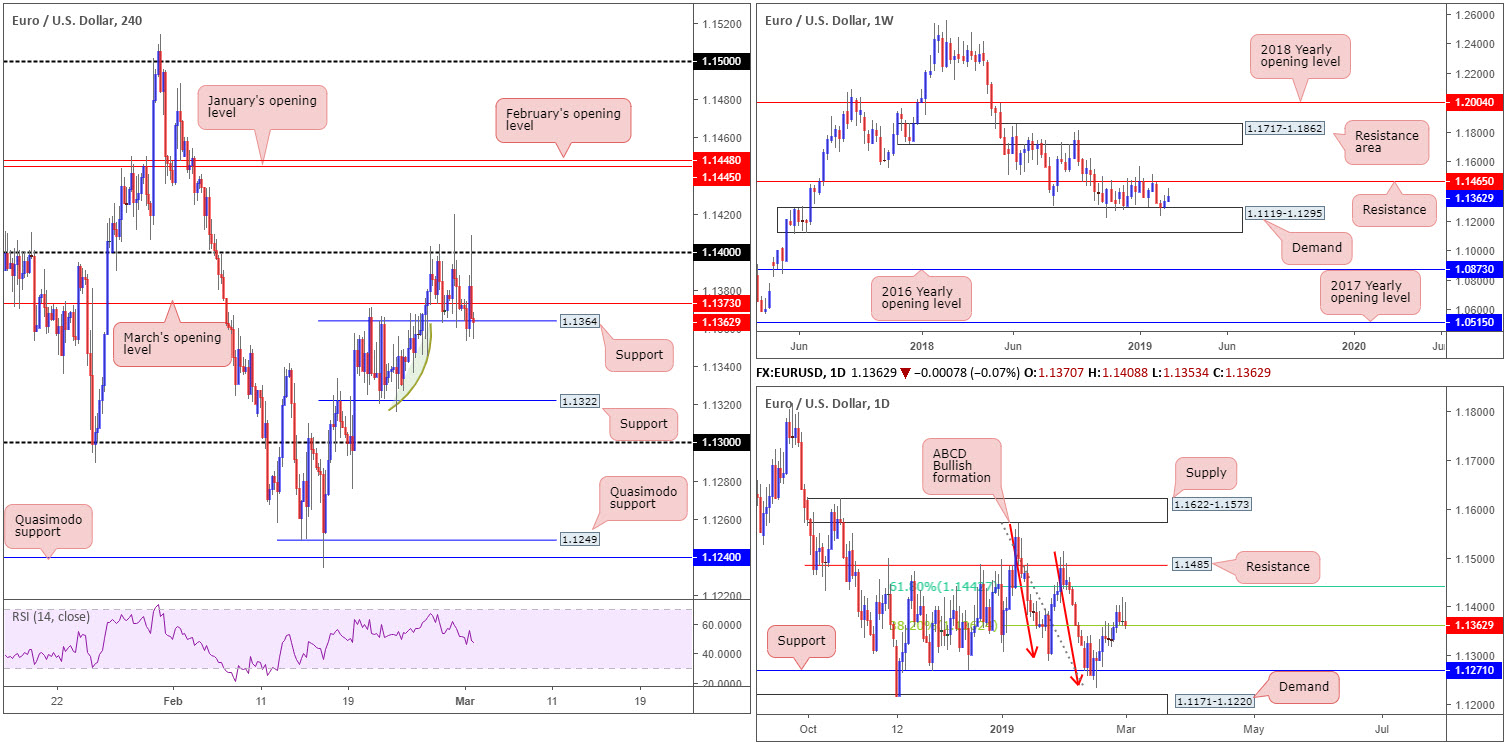
EUR/USD:
Weekly gain/loss: +0.28%
Weekly close: 1.1362
Weekly perspective:
As underscored in the previous weekly report, buyers and sellers, since October 2018, have been battling for position between a long-standing support/resistance at 1.1465 and notable demand coming in at 1.1119-1.1295.
Outside of these areas, zones on the radar fall in at a resistance area drawn from 1.1717-1.1862 and a 2016 yearly opening level at 1.0873.
Overall, the trend continues to face a southerly direction on this timeframe, with the possibility of a subsequent lower low forming in the future.
Daily perspective:
The picture on the daily timeframe reveals the pair broke above its 38.2% Fibonacci resistance value at 1.1362 early last week. This level, as highlighted in prior analysis, was the first take-profit target for many traders long the daily ABCD bullish completion point (red arrows) around 1.1240. Above this barrier, the 61.8% Fibonacci resistance at 1.1442 is in the spotlight this week – considered the second take-profit target off the said ABCD pattern.
H4 perspective:
The US ISM manufacturing PMI fell into contraction Friday, with all of the major components falling and/or missing expectations. The impact of the report sent H4 flow through 1.14, though swiftly pared gains at 1.1408 as the dollar recovered, buoyed by increasing US Treasury yields. The 10-year yield chalked up its third consecutive gain, reaching highs of 2.76%, its highest level since January 29.
Since Tuesday, however, the candles have been busy carving out a range between 1.14 and a nearby local H4 support coming in at 1.1364. Also worth noting is March’s opening level printed at 1.1373.
Should we observe 1.1364 hold ground, another attempt to retake 1.14 is likely. A push lower, however, has a reasonably clear run towards H4 support at 1.1322 (note the green arc resembles potentially consumed demand).
In terms of trend, H4 price remains entrenched within an uptrend from its February 15 bottom at 1.1234, with a higher high expected to take shape beyond 1.14, potentially towards January and February’s opening levels at 1.1445 and 1.1448, respectively.
Areas of consideration:
Having seen weekly and daily flow exhibit scope to push higher this week, along with H4 price shaking hands with local support at 1.1364, the research team remains biased to the upside.
With the above in mind, traders are urged to keep eyes on 1.14 this week. A decisive push above this number has the H4 monthly opening levels highlighted above around 1.1448/45 to target. Traders can look to either buy the breakout here, or, for more conservative traders, wait and see if a retest play is seen (preferably in the form of a H4 bullish candlestick pattern as this helps define entry/risk) before pulling the trigger.
A break below 1.1364, as underlined above, may call for a move to 1.1322. Despite this, this is a particularly chancy short, knowing you’re potentially selling into weekly and daily flow.
Today’s data points: Limited.
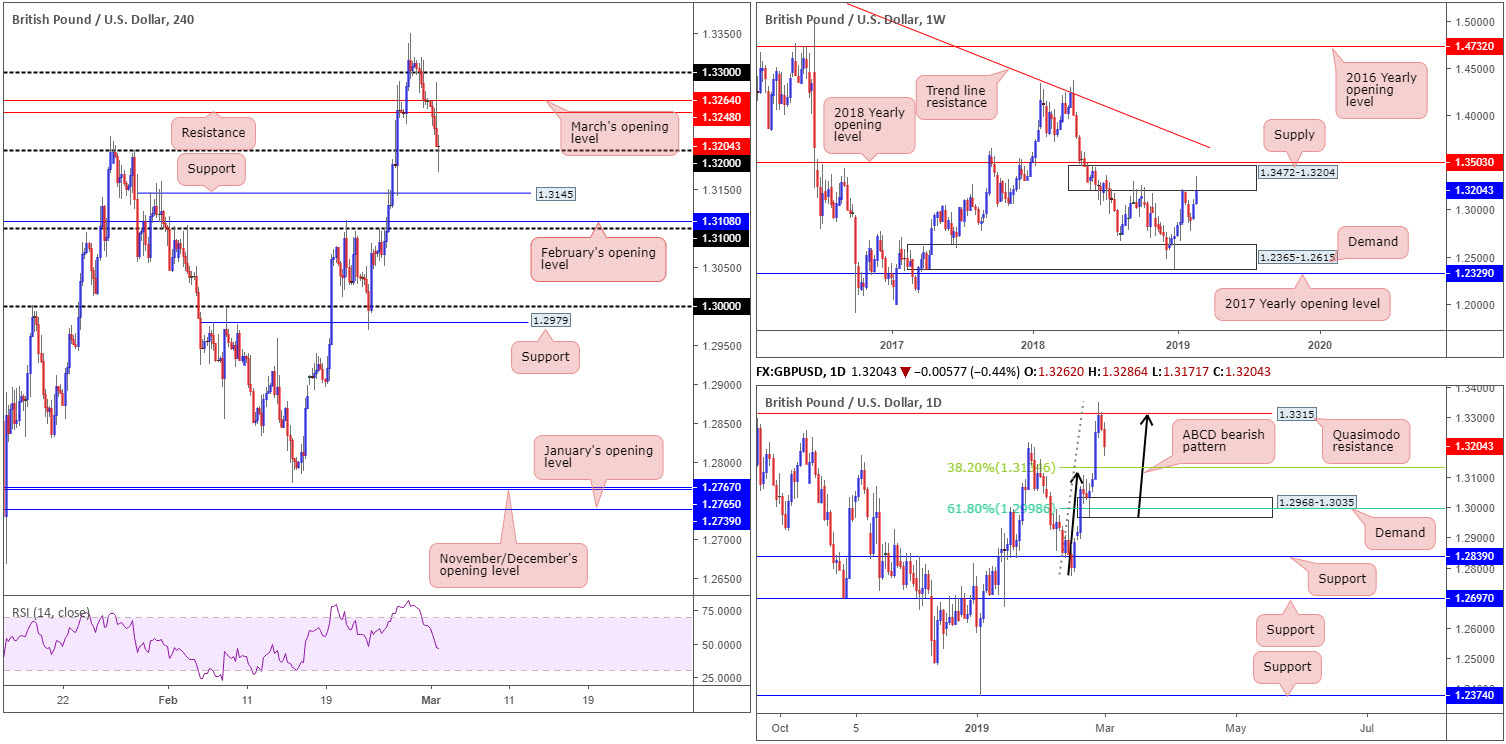
GBP/USD:
Weekly gain/loss: +1.15%
Weekly close: 1.3204
Weekly perspective:
GBP/USD bulls extended gains in recent movement, consequently entering supply territory pictured at 1.3472-1.3204 (positioned just south of the 2018 yearly opening level at 1.3503).
The end-of-week correction that pared more than 50% of the recently closed candle is, according to our technical reading, a strong sign active sellers reside within the said supply.
Daily perspective:
In parallel with weekly flow, daily price crossed swords with a Quasimodo resistance level parked at 1.3315 Wednesday and turned lower into the week’s close. Adding weight to this resistance is the approach: an ABCD bearish formation (black arrows).
The 38.2% Fibonacci support value at 1.3134 is considered the first take-profit target for those short the ABCD bearish pattern, followed by the 61.8% Fibonacci support at 1.2998, wrapped within the limits of a fresh demand base at 1.2968-1.3035.
H4 perspective:
Friday’s headline seasonally adjusted IHS Markit/CIPS purchasing managers’ index fell to a four-month low of 52.0 in February, down from a revised reading of 52.6 in January (originally reported as 52.8). The PMI is at its second-lowest level since July 2016 – the month following the EU referendum (Markit). This – coupled with a relatively dominant dollar – weighed on sterling, thus testing the nearby 1.32 handle by the close.
Ground beneath 1.32 has nearby support in view at 1.3145, shadowed closely by February’s opening level at 1.3108 and then 1.31.
Areas of consideration:
The most we expect from 1.32 today/early week is a pop to H4 resistance at 1.3248 – March’s opening level at 1.3264 at a push. The reason for this is due to both weekly and daily structure reflecting a bearish stance at the moment.
Despite higher-timeframe structure backing sellers, limited room to manoeuvre is visible on the H4. The only scenario that arouses interest is an intraday break/retest play of 1.32, targeting 1.3145, which, as we already know, combines with the 38.2% daily Fibonacci support highlighted above at 1.3134. Traders wishing to add a little more confirmation to the mix have the option of drilling down to the lower timeframes and entering on the back of a bearish candlestick play on the retest of 1.32 (entry/stop levels can be defined according to this structure).
Today’s data points: Limited.
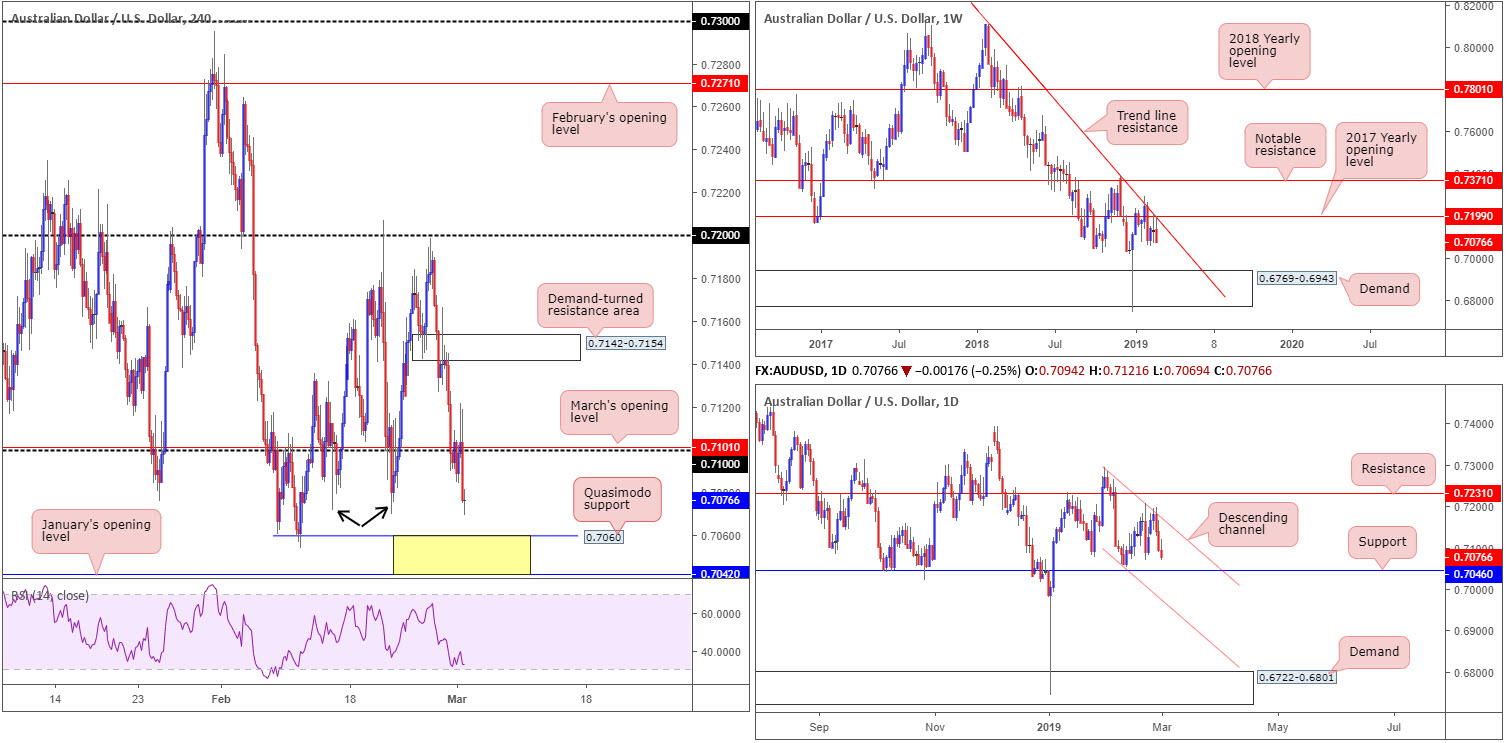
AUD/USD:
Weekly gain/loss: -0.68%
Weekly close: 0.7076
Weekly perspective:
Contained by the 2017 yearly opening level at 0.7199 and merging trend line resistance (taken from the 2018 yearly high of 0.8135), the market wrapped up the week in negative territory.
With weekly price fading significant resistance, along with downside displaying room to press as far south as demand at 0.6769-0.6943, sellers appear to have the upper hand this week.
Daily perspective:
Compressing within a descending channel (0.7295/0.7060), daily price, in the shape of a bearish engulfing pattern Wednesday, faded channel resistance last week. In order for the unit to reach the opposing channel support, and for the weekly sellers to push south, a break of nearby support coming in at 0.7046 is required. This level boasts reasonably clean history dating as far back as late August 2015.
H4 perspective:
A quick recap of Friday’s session reveals buyers lost their flavour around 0.71, despite clocking highs of 0.7121. Influenced by a robust US dollar into the early hours of the US session, the commodity-linked currency ceded further ground, by which a test of 0.7072ish was observed: a double bottom support (black arrows).
Beneath 0.7072, traders may wish to acknowledge nearby Quasimodo support plotted at 0.7060, tailed closely by January’s opening level at 0.7042 (yellow). It might also be worth pencilling in daily support highlighted above at 0.7046 inhabits the lower limit of the said H4 zone, as well as the H4 RSI indicator nearing its oversold value.
Areas of consideration:
Should we reach the aforementioned yellow zone on the H4 timeframe this week, preferably bringing in daily support at 0.7046, longs may be in the offing. Though, do bear in mind, a bounce is all that’s expected as you are effectively buying against weekly selling here.
For folks who feel threatened by the possibility of weekly selling, waiting for additional confirmation to take shape out of the yellow area is an option. Confirmation techniques are, of course, trader dependent, though a basic method of confirming an area’s validity can be as simple as drilling down to the lower timeframes and entering on a resistance-turned support setup, preferably backed up with a candlestick signal.
In terms of upside targets out of 0.7042/0.7060, the 0.71 barrier is likely to be the first port of call.
Today’s data points: Australian Building Approvals m/m; Australian Company Operating Profits q/q.
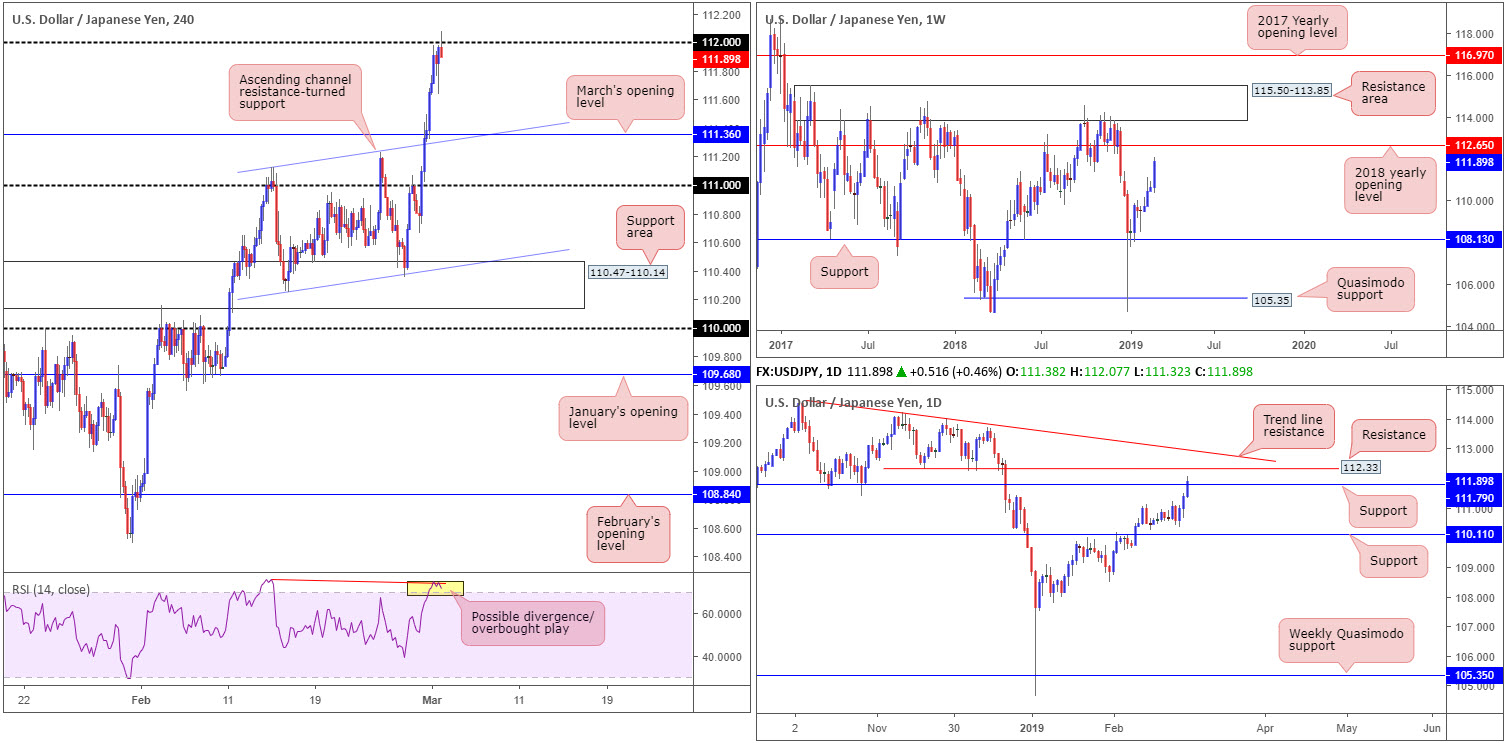
USD/JPY:
Weekly gain/loss: +1.14%
Weekly close: 111.89
Weekly perspective:
USD/JPY bulls transitioned into a higher gear last week, adding more than 120 pips in value. Pivotal resistance at 112.65 (the 2018 yearly opening level), however, may test buyers this week, closely followed by a noteworthy resistance area marked at 115.50-113.85.
Daily perspective:
Latest buying, as you can see, hauled Friday’s candle beyond resistance at 111.79 (now acting support), bringing nearby resistance at 112.33 into the spotlight. Another layer of resistance worth highlighting is the trend line resistance extended from the high 114.23.
H4 perspective:
Despite US ISM manufacturing PMI falling into contraction Friday, sparking a 20-pip move lower, the pair preserved its upside presence and shook hands with the 112 handle into the closing bell. A move lower from the psychological mark could make its way to March’s opening level at 111.36 today/early week, which happens to link closely with an ascending channel resistance-turned support (taken from the high 111.12). Above 112, the research team notes the daily resistance mentioned at 112.33 as the next resistance in line. Supporting 112 as a resistance, however, is the RSI indicator displaying a possible divergence/overbought play.
Areas of consideration:
Although the medium-term uptrend remains on a strong footing, buying this market is a challenge. Not only do we have 112 in motion on the H4, daily price throws over resistance at 112.33 and a trend line resistance, along with weekly price eyeing the 2018 yearly opening level at 112.65 as its next base.
Between 112.65 and 112.33, active sellers may make an appearance this week. Besides being constructed of higher-timeframe structure, stop-loss orders above 112 from traders looking to fade the number, and buy orders from those looking to long the breakout, provide liquidity for bigger players to sell into. Entry anywhere within 112.65/112.33 is possible, though stop-loss orders are best sited a couple of pips above the range.
Today’s data points: Limited.
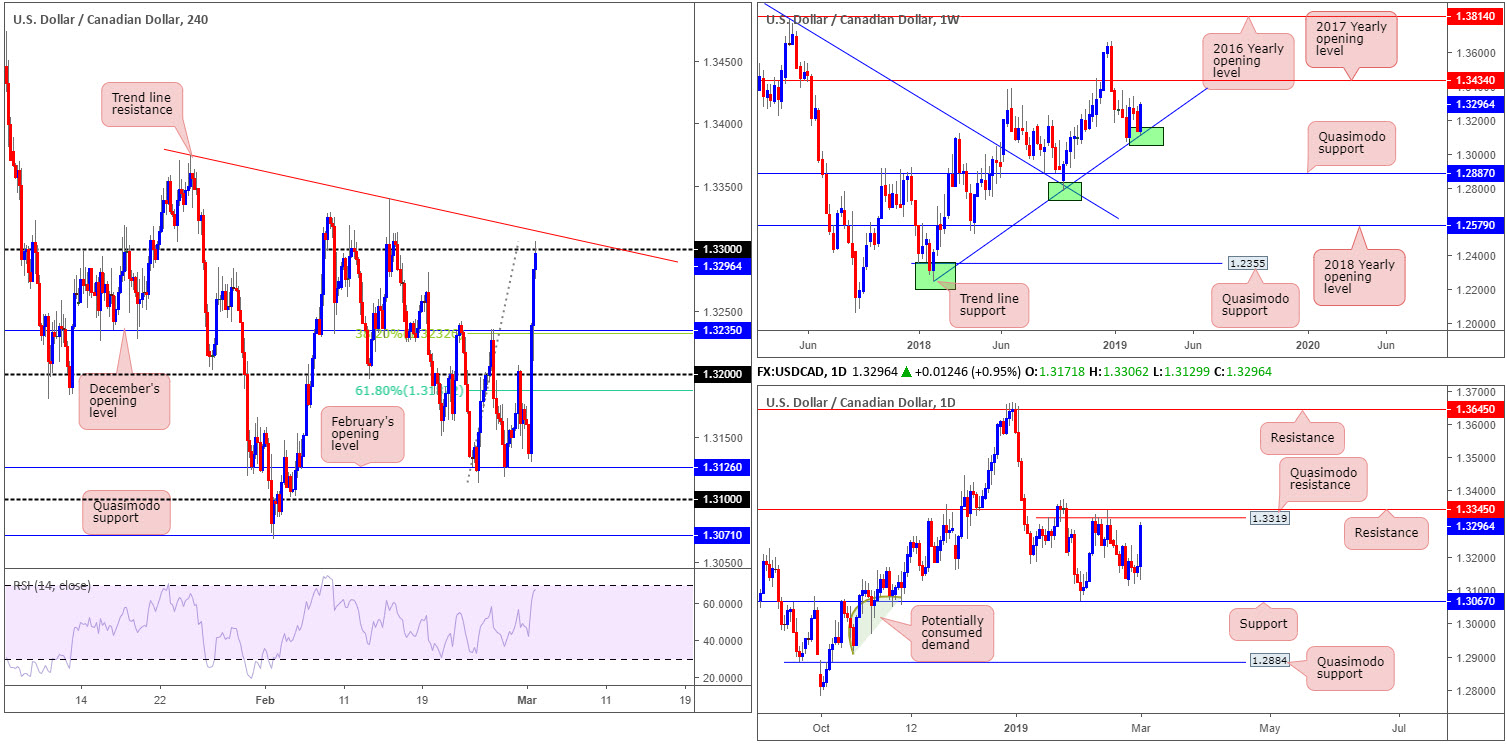
USD/CAD:
Weekly gain/loss: +1.23%
Weekly close: 1.3296
Weekly perspective:
Shaped in the form of a clear-cut bullish engulfing candle off trend line support (extended from the low 1.2247), the US dollar outperformed vs. its Canadian counterpart last week, consequently gaining more than 160 pips. Further buying on the back of this could eventually probe orders around the 2017 yearly opening level priced in at 1.3434.
Daily perspective:
The technical frame on the daily chart may hinder upside this week, in spite of the impressive rotation off weekly trend line support. Quasimodo resistance at 1.3319, closely shadowed by another layer of resistance at 1.3345, collectively form a tight zone whereby strong sellers likely reside. Evidently, should we draw through the said resistances this week, the path appears free towards resistance at 1.3645, plotted a little more than 200 pips above the next upside resistance on the weekly timeframe.
H4 perspective:
The Canadian dollar suffered a sharp decline Friday ahead of Canadian GDP data – released early on some vendors. Q/Q annualised growth came in at 0.4% vs. 1.2% expected and the BoC’s 1.3% forecast, while for the month of December alone the economy contracted 0.1% and prices slumped 0.8%. This, along with a robust USD across the board and WTI plummeting more than 2.50%, sent the USD/CAD surging higher.
Overthrowing 1.32 to the upside and December’s opening level at 1.3235, the pair concluded the day tackling 1.33.
Areas of consideration:
On the whole, buying is higher probability knowing we’re coming from weekly trend line support. The problem, however, is there’s limited confluence to base a long from on the H4 timeframe at the moment. With 1.33 entering the frame late Friday, along with the daily timeframe’s resistance between 1.3345/19, a pullback is likely on the cards before serious buyers step in to extend last week’s gains.
With the above in mind, a pullback to December’s opening level at 1.3235 (and its converging 38.2% Fibonacci support at 1.3232) is a potential scenario. Failure of this level leaves 1.32 as the next viable support that also merges close by a 61.8% Fibonacci support at 1.3186. Both levels are worthy of longs this week. Conservative traders, nonetheless, may still opt to wait for additional confirmation before pulling the trigger. As stated in our AUD/USD outlook, confirmation techniques are trader dependent, though a basic method of confirming an area’s validity can be as simple as drilling down to the lower timeframes and entering on a resistance-turned support setup, preferably backed up with a candlestick signal.
Today’s data points: Limited.
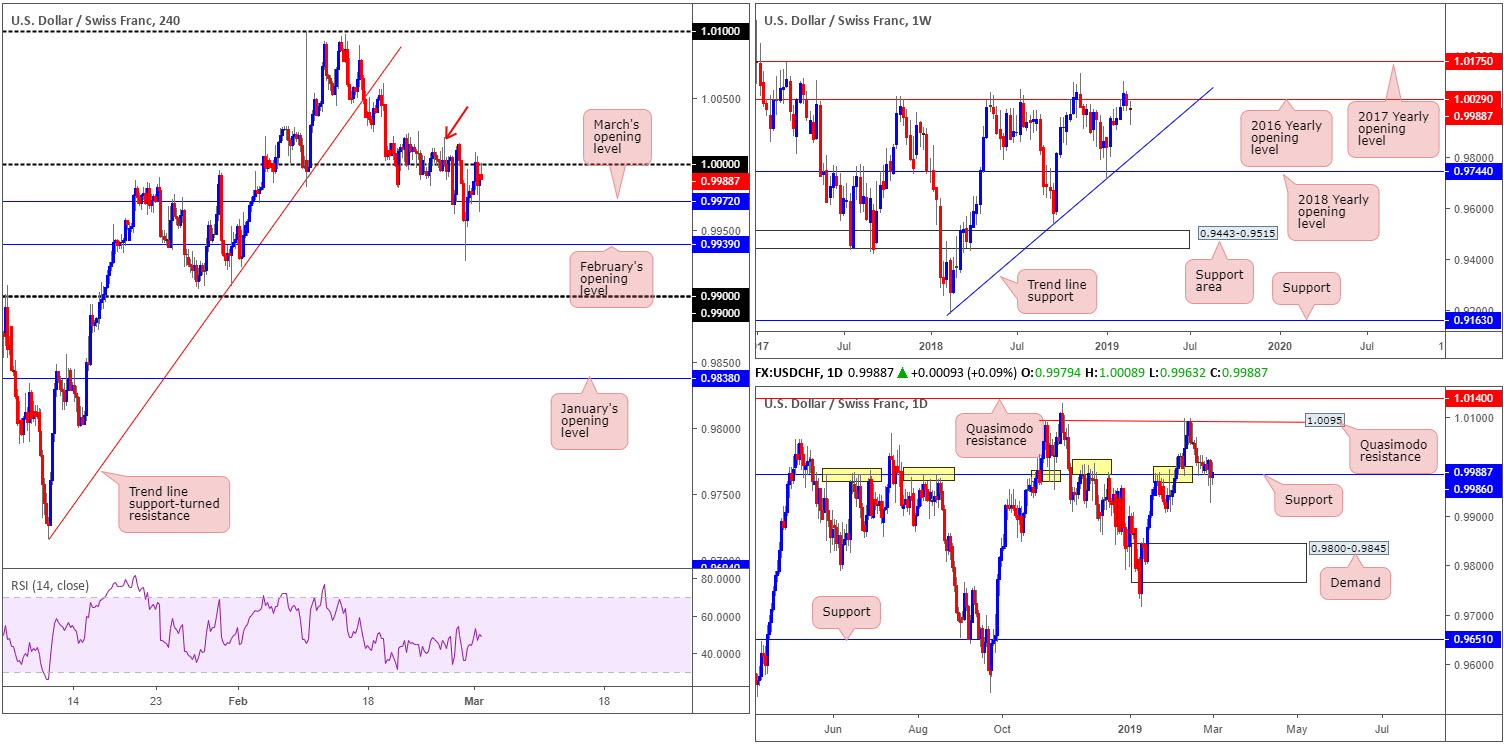
USD/CHF:
Weekly gain/loss: -0.14%
Weekly close: 0.9988
Weekly perspective:
Weekly players continued to languish beneath the 2016 yearly opening level at 1.0029 last week, presented by way of an indecision candle, albeit with a twist to the upside. As highlighted in the previous weekly briefing, 1.0029’s history as a resistance – dating as far back as February 2016 – may draw in sellers towards trend line support (etched from the low 0.9186) over the coming weeks.
Daily perspective:
A closer look at price action on the daily timeframe turns the spotlight towards notable support seen at 0.9986. The level’s history (yellow) is a prominent feature on this chart. Buyers long from this number were likely consumed mid-week and finished off Thursday with a drop to lows of 0.9926. A possible support beyond here is the 0.9905 Jan 28 low, followed by demand pressed at 0.9800-0.9845.
H4 perspective:
For those who read Friday’s briefing you may recall the piece underscoring 1.0000 as an appealing platform for sellers. Note Friday’s candle closed by way of a bearish pin-bar formation from this key figure, potentially offering a signal to short this market today.
Downside targets on the H4 timeframe fall in at March’s opening level at 0.9972, followed by February’s opening level at 0.9939, and then 0.99.
Areas of consideration:
Seeing weekly flow positioned beneath 1.0029, and daily support at 0.9986 suffering a reasonably wild blow Thursday, the pendulum appears to be swinging towards more of a decline. This, as well as, H4 action recently chalking up a bearish pin-bar formation off the underside of 1.0000 certainly positions sellers in the driving seat, according to our technical studies.
Entry can be taken from the close of the H4 bearish candle, with stop-loss orders positioned either above the H4 bearish candlestick wick or above the highs marked with a red arrow around 1.0020. The former offers more than 1:1 risk/reward to March’s opening level.
Today’s data points: Limited.
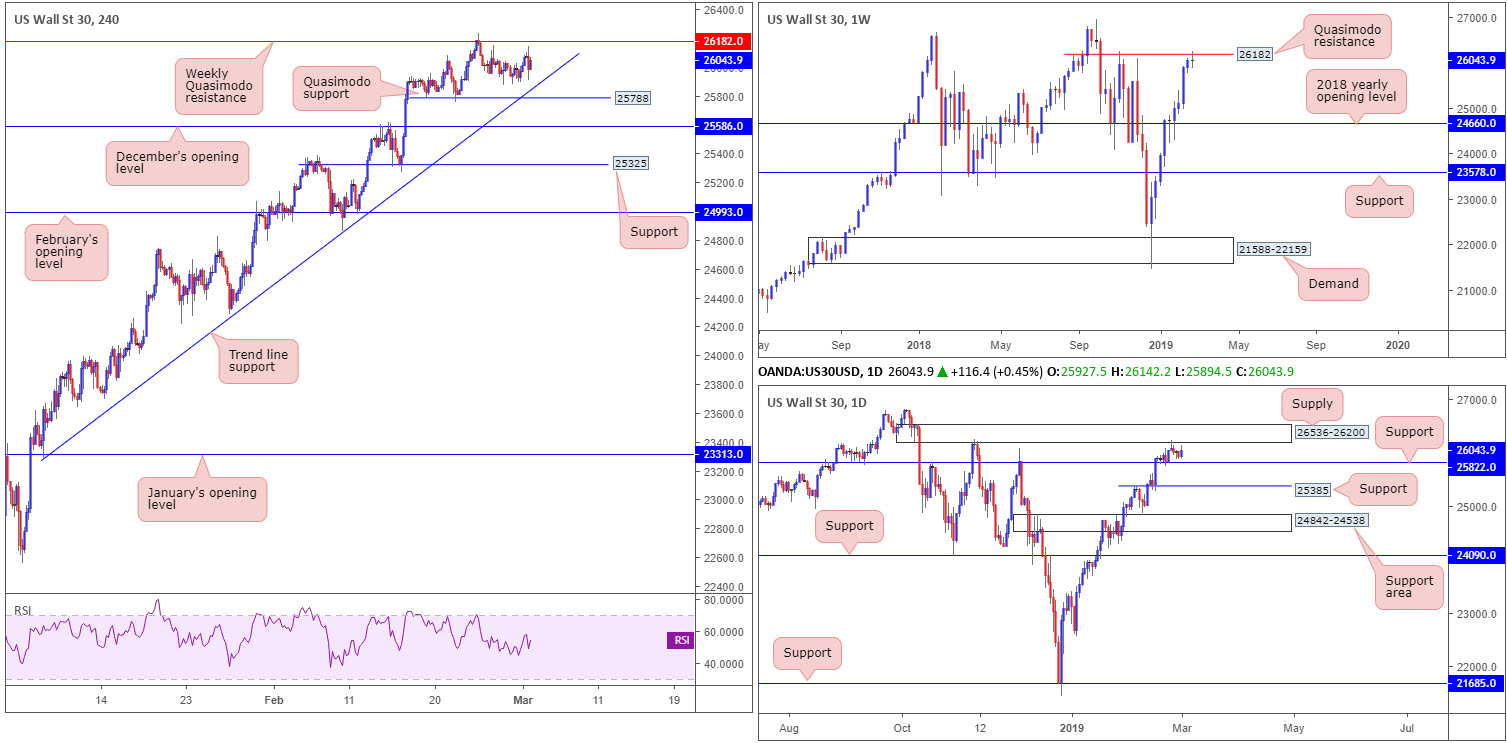
Dow Jones Industrial Average:
Weekly gain/loss: +0.02%
Weekly close: 26043
Weekly perspective:
Since bottoming at 21452 in late December 2018, US equities have shown remarkable strength. Upward momentum diminished over the course of last week, nevertheless, as the index embraced Quasimodo resistance at 26182. The week ended forming a clear-cut indecision candle that could lead to sellers entering the fold, having seen room to move as far south as 24660: the 2018 yearly opening level.
Daily perspective:
Supply formed back in October 2018 at 26536-26200, sited a few points over the current weekly Quasimodo resistance, capped upside at the beginning of last week. Follow-through selling, however, was lacklustre from thereon, unable to test neighbouring support etched in at 25822. A move lower, as suggested by weekly structure, could eventually place daily candles at support drawn from 25385.
H4 perspective:
Tuesday onwards witnessed the unit flip between gains/losses amid the weekly Quasimodo resistance at 26182, a Quasimodo support at 25788 and a trend line support (extended from the low 23277). Selling this market, based on H4 structure, is unappealing at current price. Sub December’s opening level at 25586, though, displays a relatively clear path towards support at 25325.
Areas of consideration:
Based on the weekly Quasimodo resistance at 26182 and daily supply plotted at 26536-26200, sellers may enter the fray sometime this week.
A test of the weekly Quasimodo that’s followed through with a break of nearby H4 trend line support (23277) is a worthy contender for a sell to at least the H4 Quasimodo resistance at 25788. However, do bear in mind that price could potentially stall ahead of the H4 Quasimodo given we have daily support a few points above at 25822.
Today’s data points: Limited.
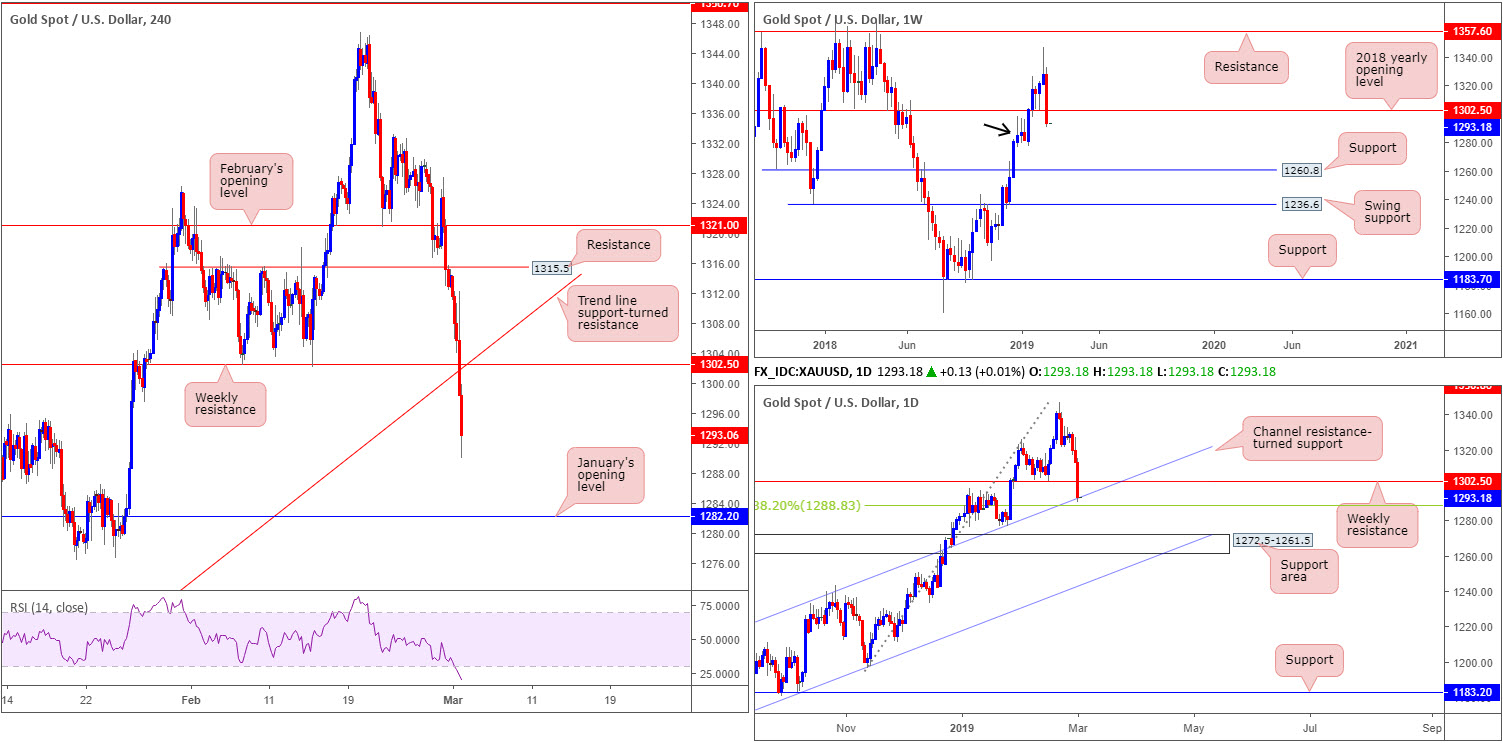
XAU/USD (GOLD):
Weekly gain/loss: -2.62%
Weekly close: 1293.0
Weekly perspective:
By way of a near-full-bodied bearish candle, bullion shed more than 2.50% in recent trading. Leaving resistance at 1357.6 unopposed, the metal conquered the 2018 yearly opening level at 1302.5 in strong fashion. We do have some demand in motion around 1276.5-1298.5 (black arrow), which could force a retest of 1302.5 as resistance this week.
Daily perspective:
Within the parapets of the current weekly demand, the daily chart has an ascending channel resistance-turned support (taken from the high 1214.3) and a 38.2% Fibonacci support value at 1288.8. Beyond here the next area of interest falls in around 1272.5-1261.5.
H4 perspective:
Broad-based USD buying, supported by rising US Treasury yields, hampered upside in the gold market in the later stages of the week. Wednesday and Thursday saw mild declines, though Friday kicked into a higher gear as the USD recovered 99% of the week’s earlier losses.
H4 trend line support (etched from the low 1196.0) that converges with weekly support highlighted above at 1302.5 (now resistance) were obliterated Friday as the unit dropped to test lows at 1289.9. According to this scale, the market has set up for a nice-looking retest play at weekly resistance, targeting January’s opening level at 1282.2. However, by selling this setup, you’re possibly shorting into weekly demand (1276.5-1298.5) and the daily structure housed within.
Areas of consideration:
Irrespective of the direction you select this week, opposing structure is clearly evident, therefore making it a difficult market to read and trade. As a result of this, traders can either take a chance and hope they’ve jumped on the right side of structure, or opt to remain on the sidelines until all the ducks are lining up: all three timeframes merge.
The accuracy, completeness and timeliness of the information contained on this site cannot be guaranteed. IC Markets does not warranty, guarantee or make any representations, or assume any liability with regard to financial results based on the use of the information in the site.
News, views, opinions, recommendations and other information obtained from sources outside of www.icmarkets.com.au, used in this site are believed to be reliable, but we cannot guarantee their accuracy or completeness. All such information is subject to change at any time without notice. IC Markets assumes no responsibility for the content of any linked site. The fact that such links may exist does not indicate approval or endorsement of any material contained on any linked site.
IC Markets is not liable for any harm caused by the transmission, through accessing the services or information on this site, of a computer virus, or other computer code or programming device that might be used to access, delete, damage, disable, disrupt or otherwise impede in any manner, the operation of the site or of any user’s software, hardware, data or property.


