
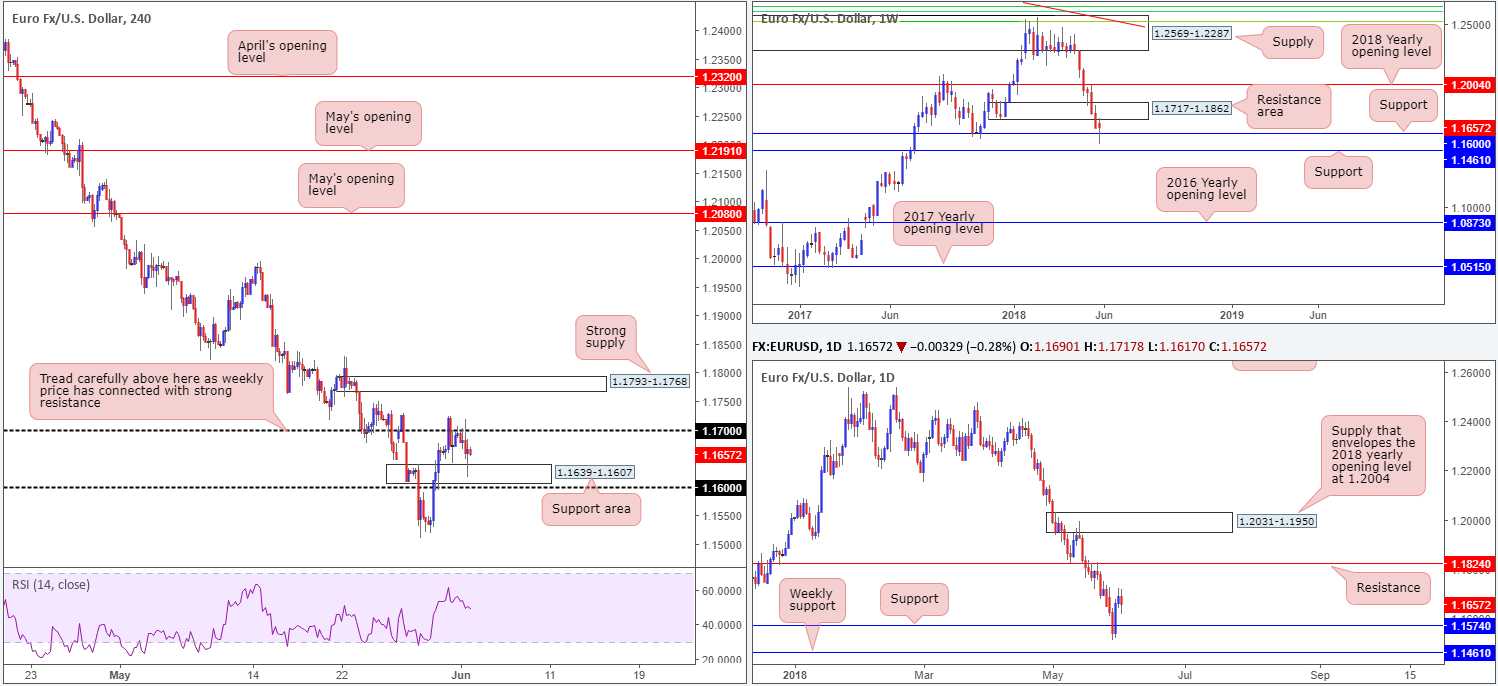
EUR/USD:
Weekly Gain/Loss: +0.07%
Weekly Closing price: 1.1657
After shaking hands with a major weekly supply at 1.2569-1.2287 earlier this year, the single currency has remained under pressure. In recent trade, market participants witnessed price action swallow weekly demand at 1.1717-1.1862 and connect with weekly support visible at 1.1600. As you can see, this support has so far held ground, strong-arming weekly price to retest the underside of the recently broken demand as resistance. Why this support held firm should be of no surprise, with it having been a strong barrier of resistance in the past and also serving as stiff support back in November 2017.
Meanwhile, a little lower on the curve daily movement is seen trading just north of daily support drawn from 1.1574. This level carries weight due to it effectively representing an ignored daily Quasimodo support. Further upside in this market has daily resistance at 1.1824 to target, whereas a break of 1.1574 will likely work toward testing weekly support plotted at 1.1461 (the next base of support beyond the current weekly support at 1.1600).
Friday’s US employment situation report showed total non-farm payroll employment increased by 223,000 in May, beating forecasts. The unemployment rate edged down to 3.8 percent vs. 3.9% expected, and average hourly earnings also came in better than expected at 0.3% vs.0.2%. Apart from a minor bout of EUR/USD selling, the report was largely overshadowed amid the political situation in Italy and Spain, and renewed concerns of a trade war.
From a technical perspective, the single currency defended the underside of 1.17 on Friday, but did manage to find active buyers out of a nearby H4 support area pencilled in at 1.1639-1.1607.
Areas of consideration:
The underside of the noted weekly resistance area could weigh on the buyers this week. As such, initiating long trades above the 1.17 handle on the H4 remains a venturesome move, in our humble view. In the event that the euro does gain momentum against its US counterpart, however, eyes will likely be on the H4 supply area drawn from 1.1793-1.1768 for potential shorts. Not only does the zone boast strong momentum to the downside, it is also positioned within the walls of the noted weekly resistance area.
Today’s data points: Limited.
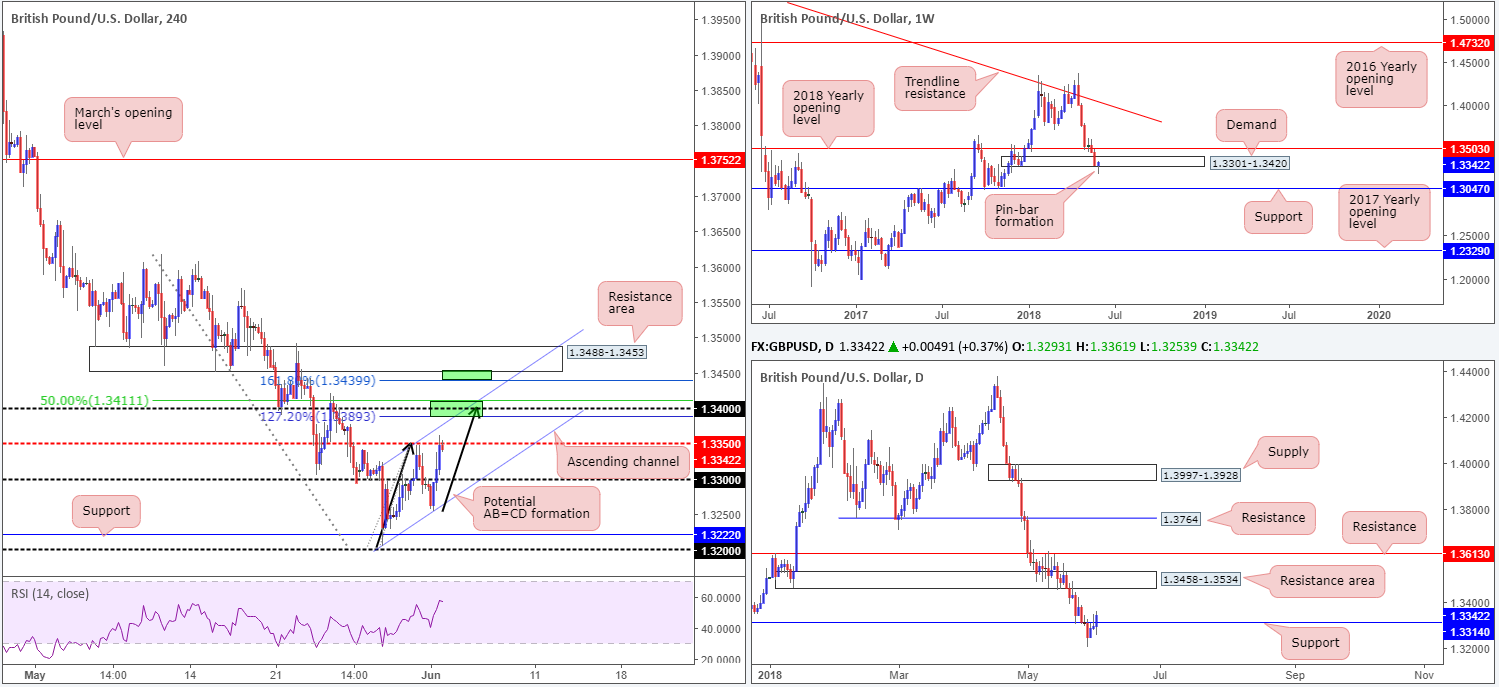
GBP/USD:
Weekly Gain/Loss: +0.29%
Weekly Closing price: 1.3342
After firmly nudging to fresh 2018 lows of 1.3204 last week, which, as you can see, also pierced the lower edge of weekly demand at 1.3301-1.3420, weekly price chalked up a bullish pin-bar formation. Whether this will be sufficient enough to inspire further buying this week is difficult to judge, given a large portion of buyers from the current weekly demand were likely taken out of the market as a result of the recent move. Nevertheless, the 2018 yearly opening (resistance) level at 1.3503 will be on our radar this week, as will weekly support coming in at 1.3047. Turning the focus down to the daily timeframe reveals that resistance at 1.3314 (now acting support) was taken out amid the later stages of trade last week, possibly exposing the daily resistance area seen overhead at 1.3458-1.3534.
A quick recap of Friday’s movement on the H4 timeframe shows us the GBP traded on a strong footing, with the aid of stronger-than-expected manufacturing PMI and reports that a solution to the contentious Irish border issue may be forthcoming via a dual UK-EU arrangement. As you can see from the H4 chart, the pair firmly broke through 1.33 and concluded the day testing H4 mid-level resistance at 1.3350.
Areas of consideration:
We really like the H4 AB=CD formation taking shape at the moment (see black arrows). To our way of seeing things, there are two completion points related to this pattern that may be worthy of shorts this week:
- The first area can be seen around the 127.2% H4 Fib ext. point at 1.3389. Besides completing just ahead of the 1.34 handle, traders may have also noticed that this completion point terminates nearby a H4 channel resistance (taken from the high 1.3347) and a 50.0% resistance value at 1.3411.
- The second area of interest falls in at the 161.8% H4 Fib ext. point drawn from 1.3439. Note that this completion zone converges nicely with the underside of a H4 resistance at 1.3488-1.3453, which itself is seen glued to the underside of the daily resistance area mentioned above at 1.3458-1.3534.
Both areas carry equal weight, in our opinion.
Today’s data points: UK construction PMI; MPC member Tenreyro speaks.
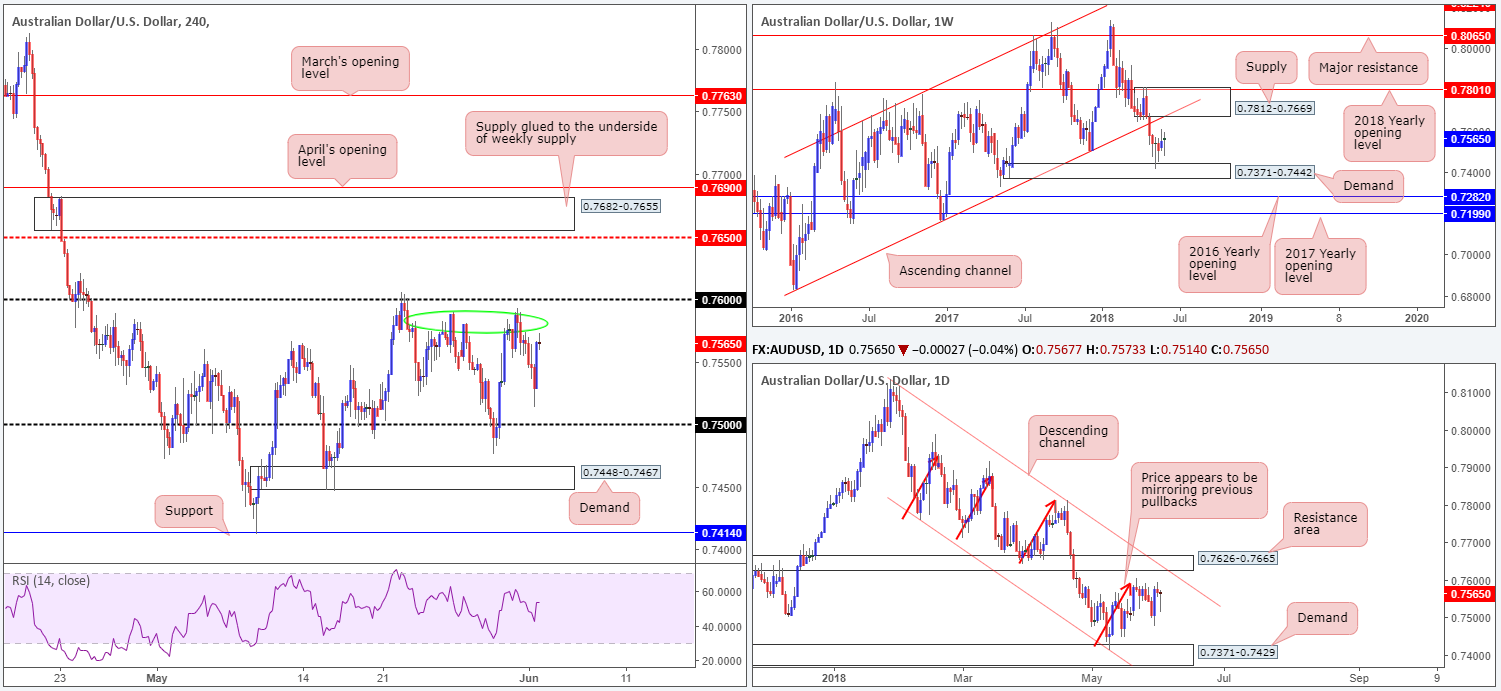
AUD/USD:
Weekly Gain/Loss: +0.25%
Weekly Closing price: 0.7565
Despite ranging in excess of 100 pips over the course of last week, AUD/USD prices are little changed.
As illustrated on the weekly timeframe, price action remains hovering between demand priced in at 0.7371-0.7442 and supply at 0.7812-0.7669, which happens to also converge with a weekly channel support-turned resistance extended from the low 0.6827.
Zooming in for a closer look at price action, we can see that daily flow is compressing within a descending channel formation (0.8135/0.7758) right now. Areas also worthy of note are the daily demand base at 0.7371-0.7429 (seen positioned within the lower limit of the current weekly demand) and daily resistance area plotted at 0.7626-0.7665 (located just ahead of the current weekly supply and converges with aforementioned daily channel resistance). It may also be worth pencilling in that price continues to find resistance around the 0.7590 mark, mirroring previous pullbacks (see red arrows).
The impact of Friday’s better-than-expected non-farm payrolls report was negligible. A brief spell of selling was seen to lows of 0.7514, but it was a short-lived move. From that point, the commodity currency advanced aggressively against its US counterpart, lifting the H4 candles to highs of 0.7572 into the close.
Areas of consideration:
Further buying is likely in this market, with a breach of 0.76 potentially in store. Traders should, however, expect sellers to react at H4 tops seen around the 0.7580 neighborhood (green circle) beforehand. Also, on a break of 0.76, sellers are expected to begin making an appearance around the 0.7626 region since this marks the underside of the current daily resistance area.
At current price, we do not see much to hang our hat on in terms of trade setups. Once, or indeed if, price crosses above 0.76 and enters into the jaws of the noted daily resistance area, however, shorts will be favored.
In fact, a key area worth noting in your watchlist this week is the H4 supply zone seen fixed to the underside of weekly supply at 0.7682-0.7655. Note how the lower edge of this H4 zone is seen hanging around the upper limit of the daily resistance area between 0.7665/0.7655.
Today’s data points: AUD retail sales m/m; AUD company operating profits q/q.
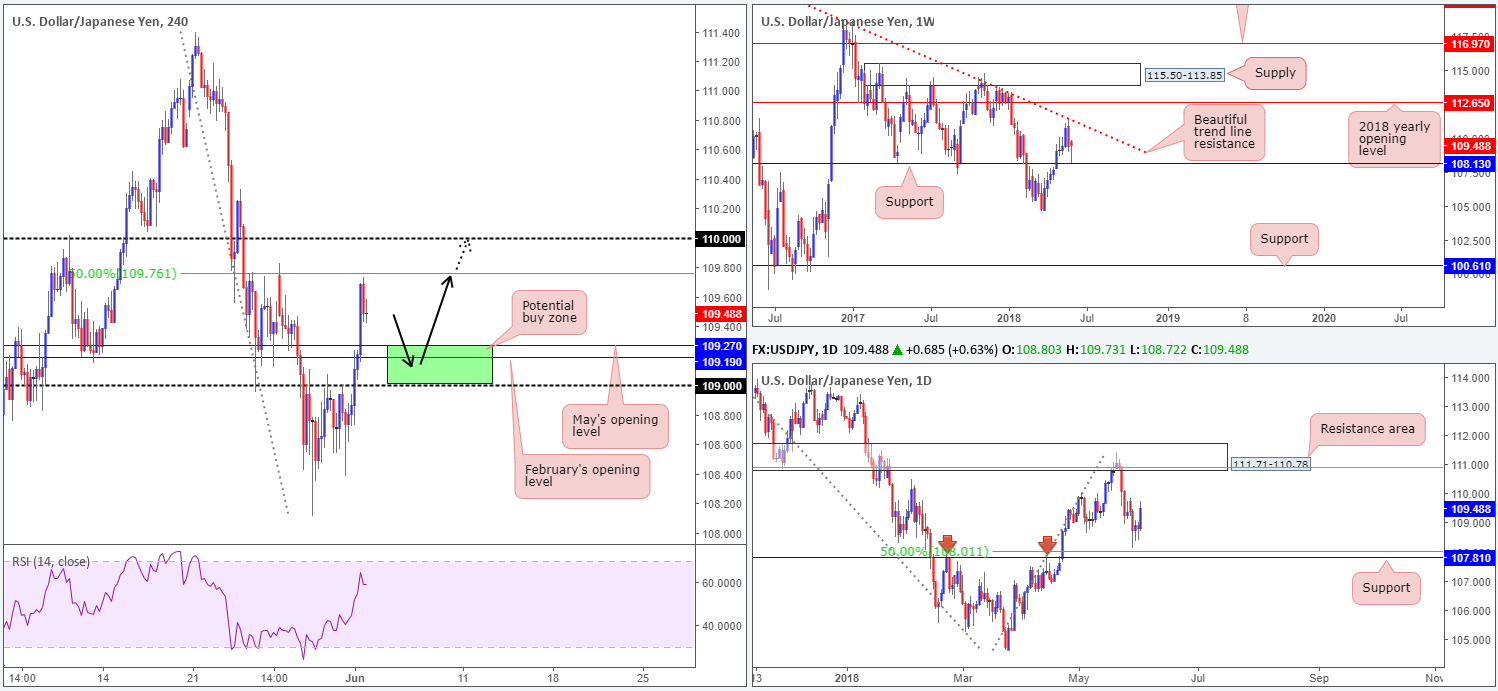
USD/JPY:
Weekly Gain/Loss: +0.13%
Weekly Closing price: 109.48
Over the course of last week’s trading, weekly price crossed swords with neighboring weekly support at 108.13 and ended the week forming a weekly bullish pin-bar formation. This could, assuming the buyers remain on the defensive, lead to a retest of the weekly trend line resistance extended from the high 123.67 this week.
The story on the daily timeframe, nevertheless, shows that the unit bottomed just north of a 50.0% daily support value at 108.01, shadowed closely by daily support plotted at 107.81. Continued buying from this point has the daily resistance area printed at 111.71-110.78 to target. It may also interest traders that this area not only houses a 61.8% daily Fib resistance value at 110.91 (green line), it also unites with the above said weekly trend line resistance.
Across on the H4 timeframe, we can see that Friday’s activity caught fresh bids following the release of better-than-expected US monthly jobs report and a strong ISM manufacturing PMI print for the month of May. Consuming both February and May’s monthly opening levels at 109.19 and 109.27, price followed through to highs of 109.73 before mildly paring gains into the close.
Areas of consideration:
The green area marked on the H4 timeframe between the 109 handle and February and May’s monthly opening levels at 109.19 and 109.27 likely offers a strong concentration of bids. We say this not only because the area has reasonably significant history, but also due to both weekly and daily action showing room to press north (see above).
Entering long from 109/109.27 has the 50.0% H4 resistance value at 109.76 to target, followed closely by the 110 handle. To avoid being stopped on a fakeout below 109 (common occurrence at psychological numbers), you may want to consider waiting and seeing if H4 price can chalk in a full or near-full-bodied bull candle before pulling the trigger, as this tends to provide a good indication of buyer intent.
Today’s data points: Limited.
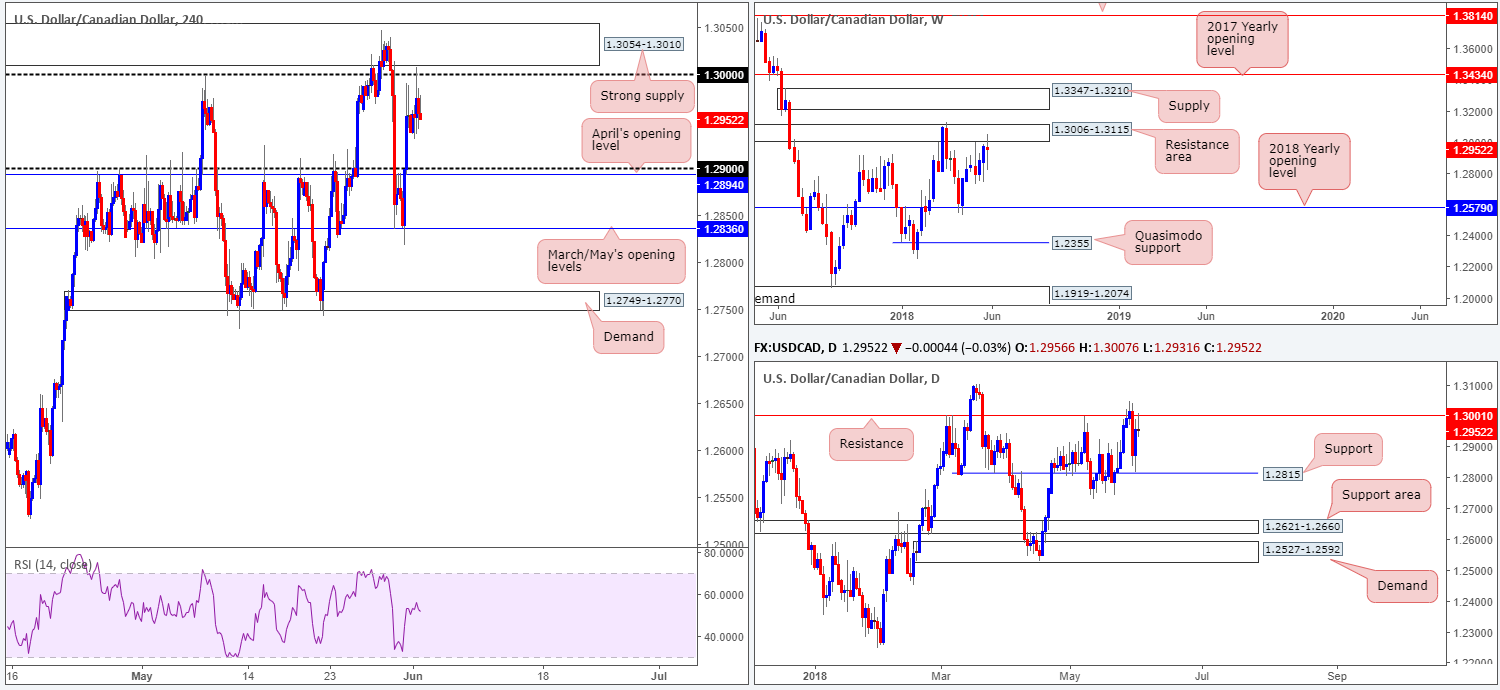
USD/CAD:
Weekly Gain/Loss: -0.15%
Weekly Closing price: 1.2952
Formed in the shape of a weekly indecision candle, weekly price remained capped around the underside of a resistance area seen at 1.3006-1.3115 last week. Should imbalance favor the bulls here this week, and a break of the current weekly resistance zone is seen, this will almost immediately bring weekly supply at 1.3347-1.3210 into the fray. On the other side of the spectrum, a selloff could see price action stretch as far south as the 2018 yearly opening level at 1.2579.
In conjunction with weekly structure, the daily candles are seen interacting with resistance coming in at 1.3001. Providing a strong ceiling of resistance since March this year, on top of Friday’s action penciling in a reasonably nice-looking selling wick off the level, a selloff from this number could be in store. The next downside support target on the radar falls in at 1.2815, followed then by a daily support area at 1.2621-1.2660.
For those who read Friday’s analysis you may recall the team highlighting that eyes were once again on the H4 supply zone drawn just above 1.30 at 1.3054-1.3010 for potential short plays (positioned within the walls of the current weekly resistance area). We went on to write that an ideal sell signal would be a H4 bearish pin-bar formation that pierces through 1.30 and tags the noted H4 supply. Well, we got the fakeout above 1.30, and price managed to remain sub 1.30 into the close, but it wasn’t in the shape of a bearish pin-bar formation and price failed to connect with the noted H4 supply.
Areas of consideration:
Despite H4 price not testing H4 supply on the move above 1.30, the sellers still have the upper hand here, in terms of market structure (see above in bold).
On account of the above, we feel H4 price is working towards a test of 1.29/April’s opening level at 1.2894. Shorts at current price are therefore appealing. The problem with this, nonetheless, is stop-loss placement – placing it above 1.30 leaves the position vulnerable to additional attacks. The safest area, as far as we can see, is beyond the current H4 supply. This, however, places one in a terrible position regarding risk/reward. So, with that in mind, the only alternative is to wait and see if H4 price can retest 1.30 and then look to feed in a short from here, with stops planted above the aforementioned H4 supply.
Today’s data points: Limited.
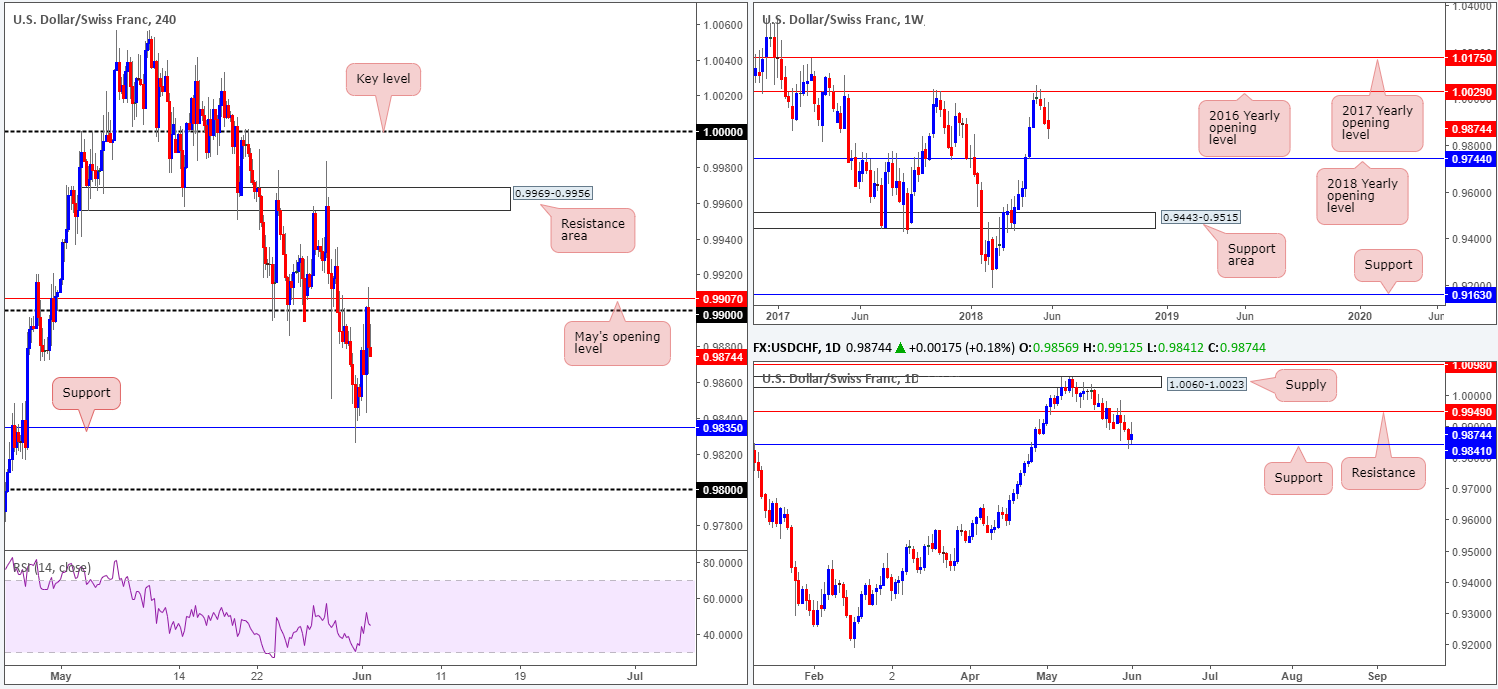
USD/CHF:
Weekly Gain/Loss: -0.17%
Weekly Closing price: 0.9874
The USD/CHF sustained further losses during last week’s action, marking the pair’s third consecutive weekly loss off the 2016 yearly opening level seen on the weekly timeframe at 1.0029. In terms of weekly structure, there’s really not very much support seen in view until the unit reaches the 2018 yearly opening level marked at 0.9744.
While weekly price continues to emphasize a bearish environment, traders may want to note that daily action recently checked in with support at 0.9841. As such, it would not be until a decisive daily close is seen beyond this level can we be confident that weekly price is likely to reach the noted 2018 yearly open level.
The impact of Friday’s upbeat US employment situation report fueled USD buying against the Swiss Franc, consequently lifting H4 price beyond the 0.99 handle. Be that as it may, the buyers were unable to build on these gains as the candles met active selling off May’s opening level drawn from 0.9907, consequently trimming NFP-induced gains into the closing bell.
Areas of consideration:
Neither a long nor short seems attractive at current price.
Irrespective of the direction one selects, you’ll face higher-timeframe opposition from either weekly directional flow or the current daily support.
On account of this, the team has labelled this market as ‘flat’ for the time being.
Today’s data points: Limited.
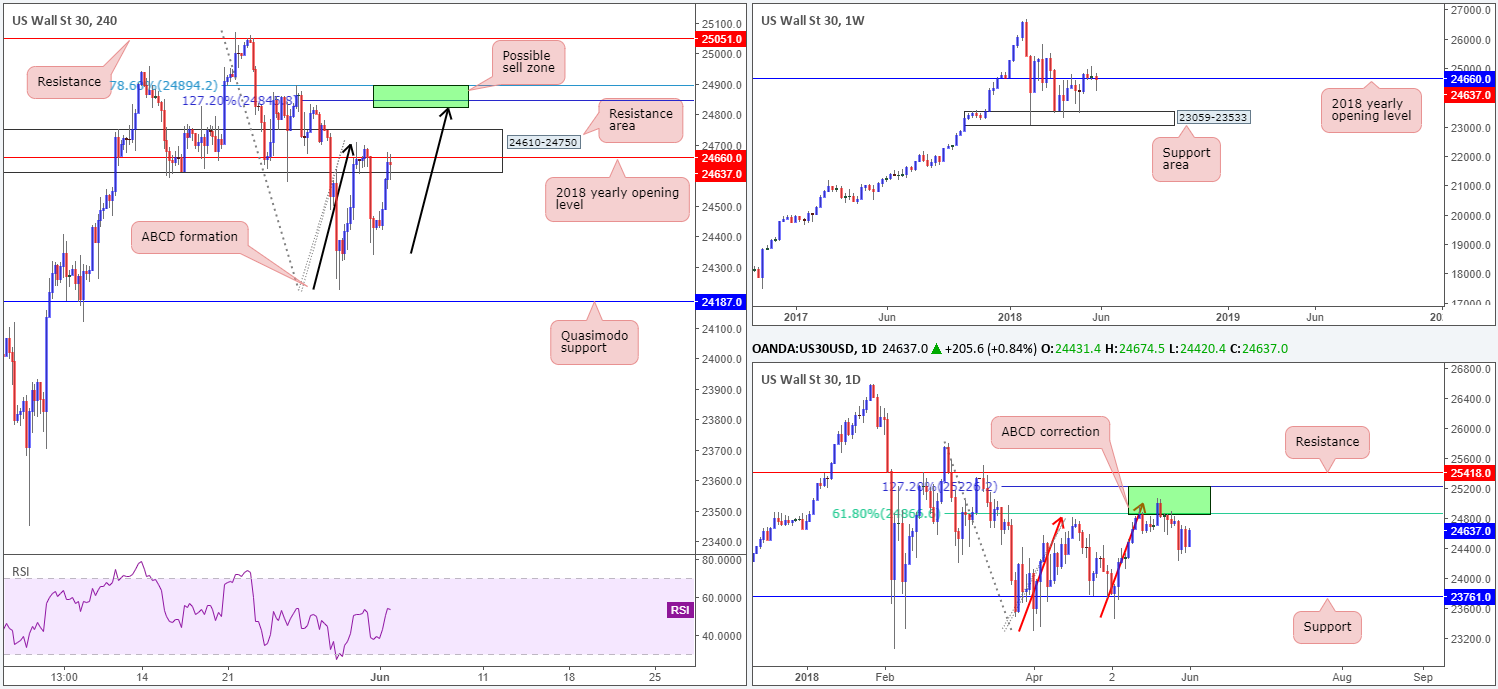
Dow Jones Industrial Average:
Weekly Gain/Loss: -0.48%
Weekly Closing price: 24637
Although US equities ended the week in the minus, the Dow did manage to print a rather hefty weekly buying tail just beneath the 2018 yearly opening level on the weekly timeframe at 24660. What does this mean? Well, it could mean the buyers are ready to press higher and test 25000s this week, or it could have simply been a move to take out as many buyers as possible to drive lower. At this point on the weekly chart, it is a difficult read.
Things are lot clearer on the daily timeframe, as daily movement shows room to press as far south as support drawn from 23761 after establishing strong resistance at 25229/24866. The area marked in green is comprised of a 61.8% daily Fib resistance value and a daily 127.2% ABCD (see red arrows) daily Fib ext. point.
Surrounding the 2018 yearly opening level mentioned above on the weekly timeframe is a H4 support area coming in at 24610-24750. Although this area remains intact, there’s a chance that we may witness a pop up to 24894/24823 (green zone) this week: a H4 127.2% ABCD (see black arrows) Fib ext. point and a 78.6% H4 Fib resistance, which is seen positioned within 25229/24866 on daily structure.
Areas of consideration:
We’re still fond of the current H4 resistance zone since it does hold the 2018 yearly opening level within its walls. Therefore, should H4 price print a full or near-full-bodied bearish candle out of here, shorts are worthy of attention, with the initial take-profit target set at Thursday’s low 24337, and stops positioned above the rejection candle’s wick.
A break higher, nevertheless, will likely bring in the H4 ABCD formation mentioned above at 24894/24823. This is another area worth noting not only for its confluence on the H4 timeframe, but also due to it forming within daily structure mentioned at 25229/24866. To help with stop-loss placement here, we would recommend waiting for H4 price print a full or near-full-bodied bearish candle and place stops above the rejection candle’s wick. As for take-profit targets, using the 38.2% and 61.8% Fib retracements of legs A-D could be an option (Leg A is 24224 and leg D is yet to complete as it is the final leg): the 38.2% as a breakeven trigger and the 61.8% for taking full or partial profits.
Today’s data points: Limited.
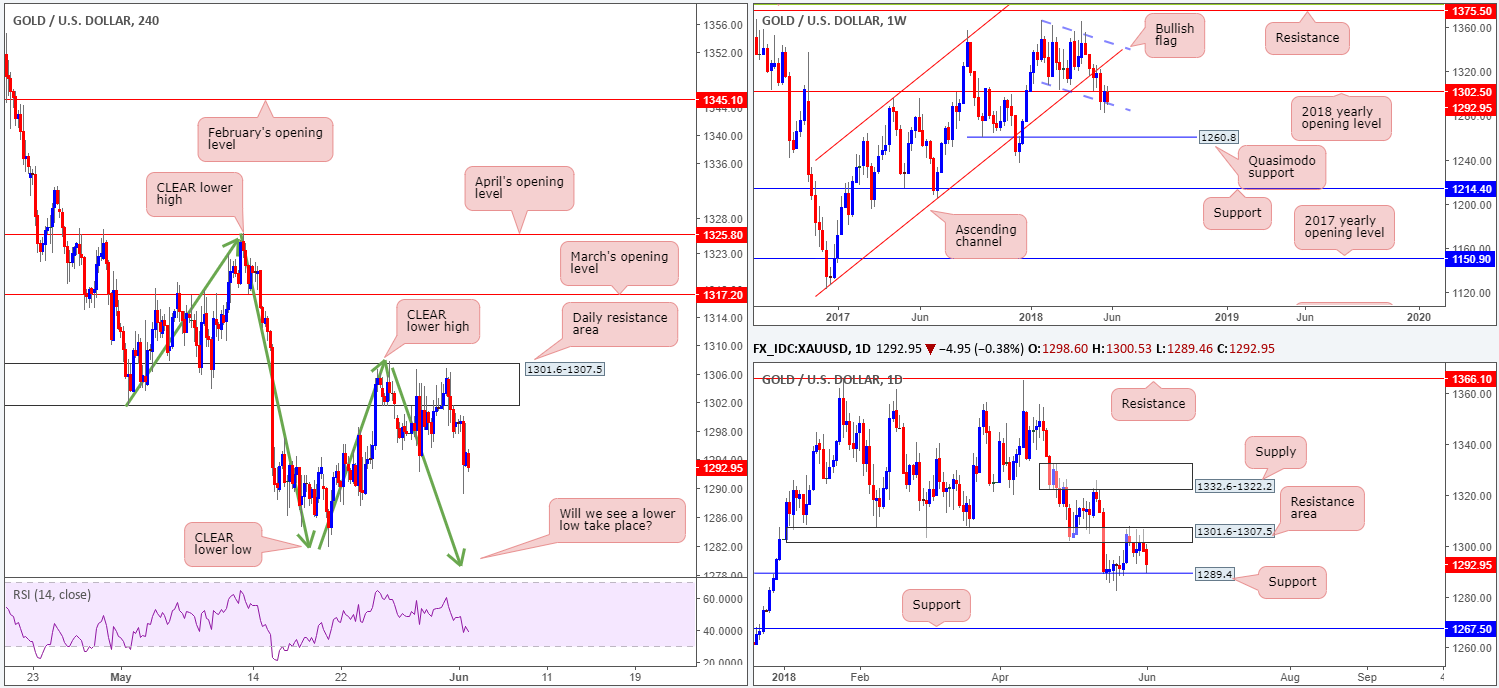
XAU/USD (Gold)
Weekly Gain/Loss: -0.64%
Weekly Closing price: 1292.9
Of late, the price of gold has been tightly confined between the 2018 yearly opening level on the weekly timeframe at 1302.5 and the lower edge of a weekly bullish flag formation taken from the low 1346.1. A break lower may set the stage for a test of 1260.8: a weekly Quasimodo support, whereas a move above 1302.5 may see weekly price head for the opposite end of the current weekly flag (extended from the high 1366.0).
Moving down to the daily timeframe, support at 1289.4 was brought into play on Friday after the market spent the week addressing the daily resistance zone plotted at 1301.6-1307.5. Despite the fact that daily price has so far respected the noted support, traders may want to pencil in daily support at 1267.5 as this is the next downside target on this scale should the current support level give way.
As mentioned in several reports, the team are expecting a lower low to form on the H4 scale (a break of the swing low 1285.8). The daily resistance area mentioned above at 1301.6-1307.5 is a prominent zone on this timeframe and offered traders the opportunity to sell throughout the week. Well done to those who have managed to hold their shorts from the daily zone.
Areas of consideration:
While the expectation is for a lower low to form on the H4 timeframe, the bigger picture, as already highlighted above, is currently testing notable higher-timeframe supports: daily support at 1289.4 and the lower edge of a weekly bullish flag formation. Therefore, those who remain short this market, it may now be a good opportunity to reduce risk to breakeven. As for taking profit, a test of swing lows on the H4 timeframe around 1284.0 could be a nice area to consider initial profit taking.
The use of the site is agreement that the site is for informational and educational purposes only and does not constitute advice in any form in the furtherance of any trade or trading decisions.
The accuracy, completeness and timeliness of the information contained on this site cannot be guaranteed. IC Markets does not warranty, guarantee or make any representations, or assume any liability with regard to financial results based on the use of the information in the site.
News, views, opinions, recommendations and other information obtained from sources outside of www.icmarkets.com.au, used in this site are believed to be reliable, but we cannot guarantee their accuracy or completeness. All such information is subject to change at any time without notice. IC Markets assumes no responsibility for the content of any linked site. The fact that such links may exist does not indicate approval or endorsement of any material contained on any linked site.
IC Markets is not liable for any harm caused by the transmission, through accessing the services or information on this site, of a computer virus, or other computer code or programming device that might be used to access, delete, damage, disable, disrupt or otherwise impede in any manner, the operation of the site or of any user’s software, hardware, data or property.


