
DXY:
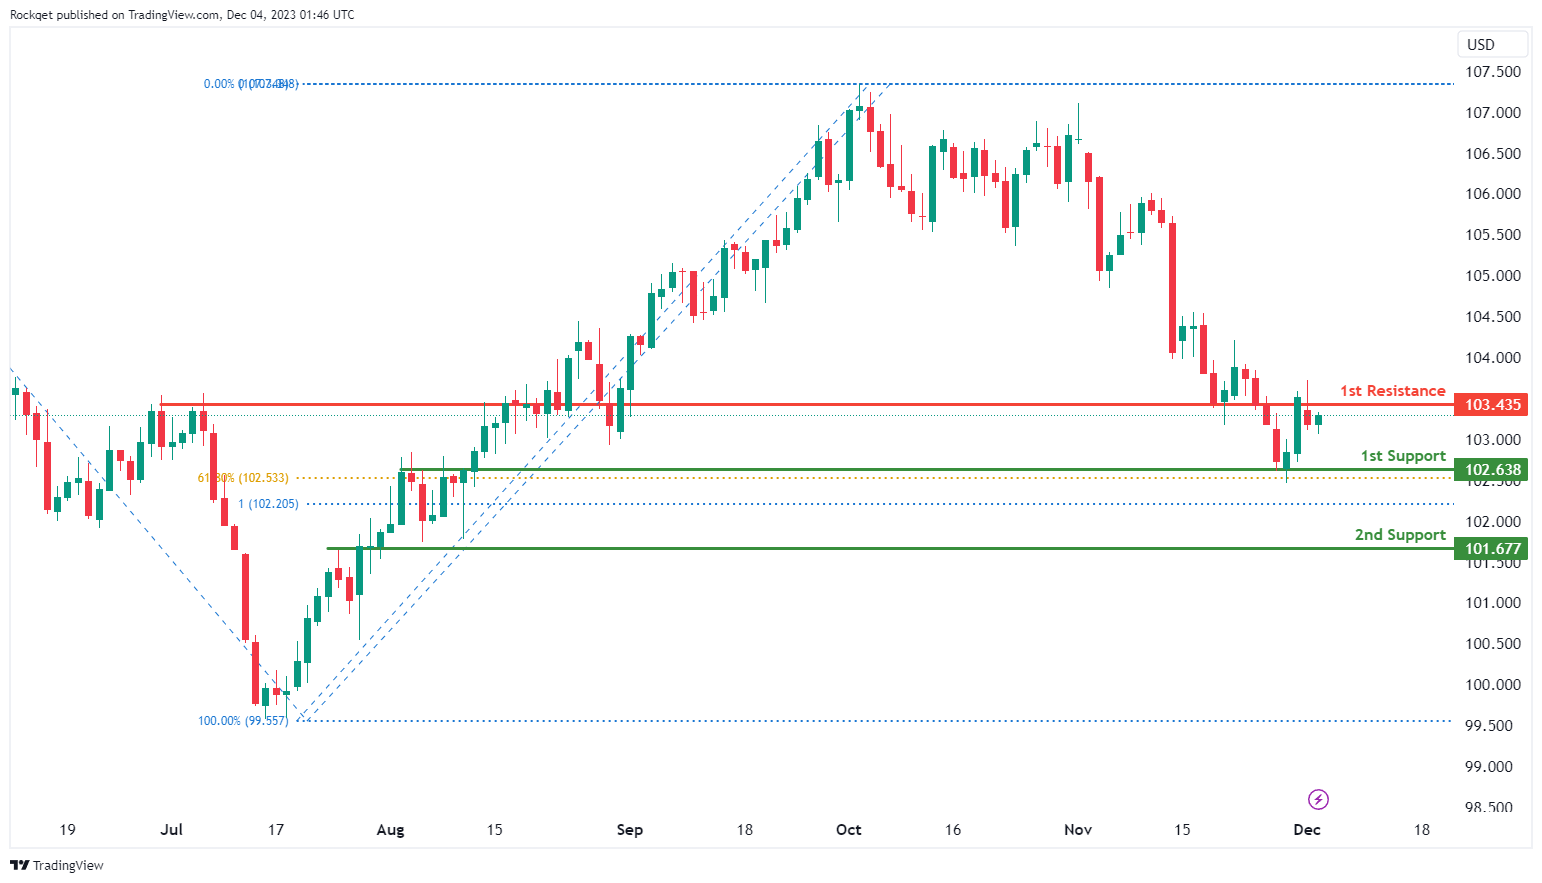
The DXY (US Dollar Index) chart currently maintains a bearish overall momentum, indicating the potential for a bearish continuation towards the 1st support.
The 1st support at 102.63 is identified as an overlap support with a 61.80% Fibonacci retracement, signifying its importance as a significant level where buying interest may emerge. This level adds to its significance as a potential area for buyer activity, providing potential support for the US Dollar Index.
The 2nd support at 101.67 is categorized as pullback support, reinforcing its importance as a level where buying interest may intensify.
On the resistance side, the 1st resistance at 103.43 is noted as an overlap resistance, representing a notable barrier where selling interest could intensify, potentially hindering DXY’s upward movement.
EUR/USD:
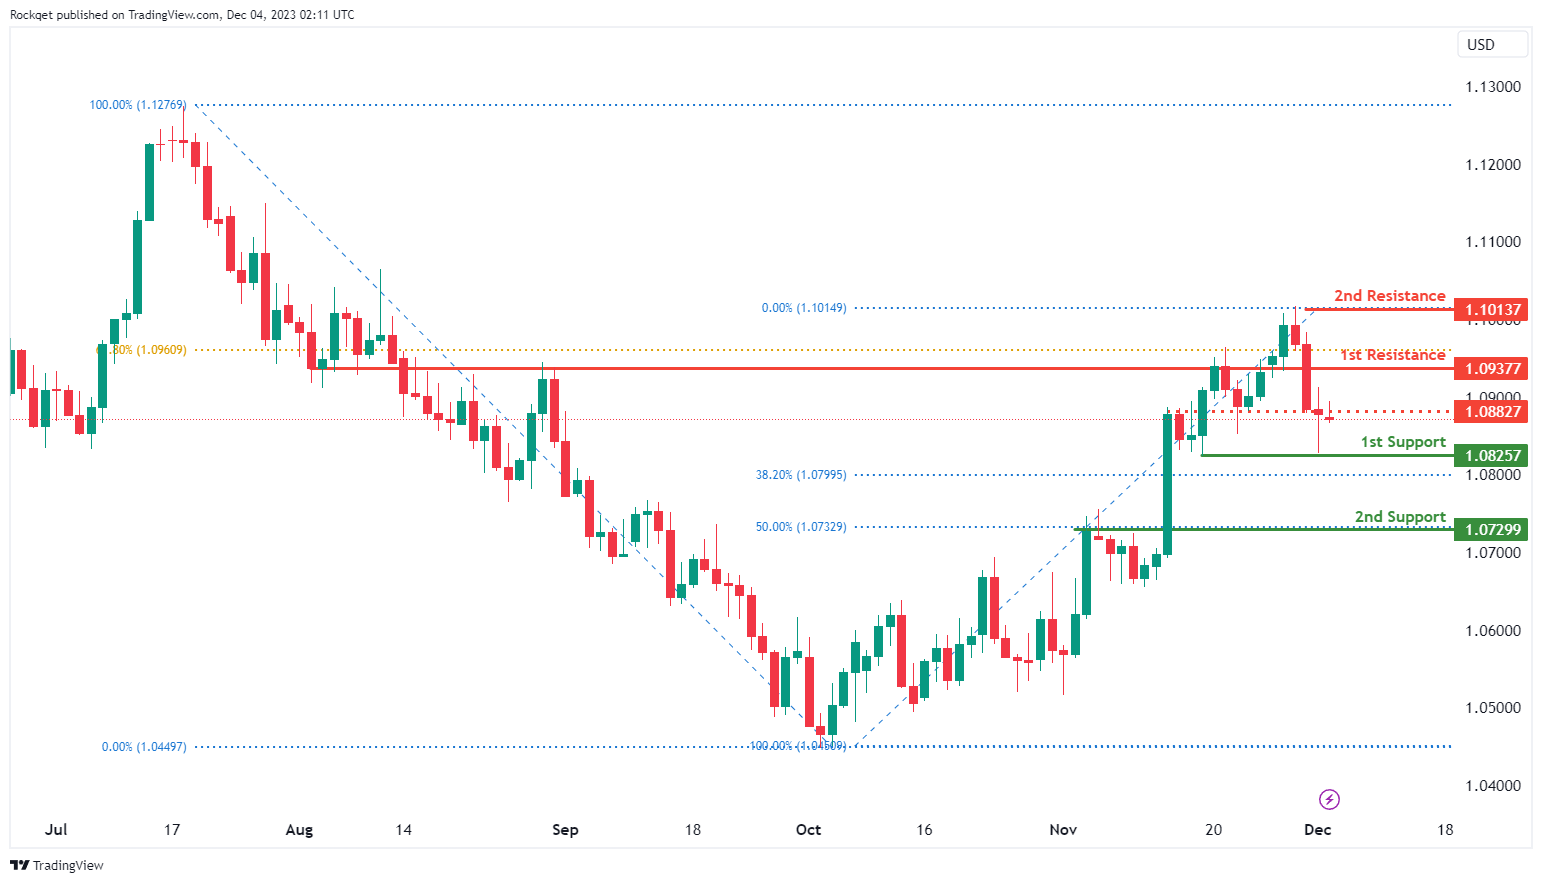
The EUR/USD chart currently exhibits a bullish overall momentum, suggesting potential price action where it may experience a bullish bounce off the 1st support and move towards the 1st resistance.
The 1st support at 1.0825 is identified as an overlap support, signifying its importance as a significant level where buying interest may emerge, potentially providing essential support for EUR/USD.
The 2nd support at 1.0729 features a 50% Fibonacci retracement, adding to its significance as a potential area for buyer activity, strengthening the support.
On the resistance side, the 1st resistance at 1.0937 is categorized as a pullback resistance, representing a notable barrier where selling interest could intensify, potentially hindering EUR/USD’s upward movement.
Additionally, there is a 2nd resistance at 1.1013, noted as a swing high resistance, further reinforcing potential resistance factors for the currency pair.
Furthermore, an intermediate resistance level at 1.0882 is identified as a pullback resistance, adding to its significance as a potential resistance level.
EUR/JPY:
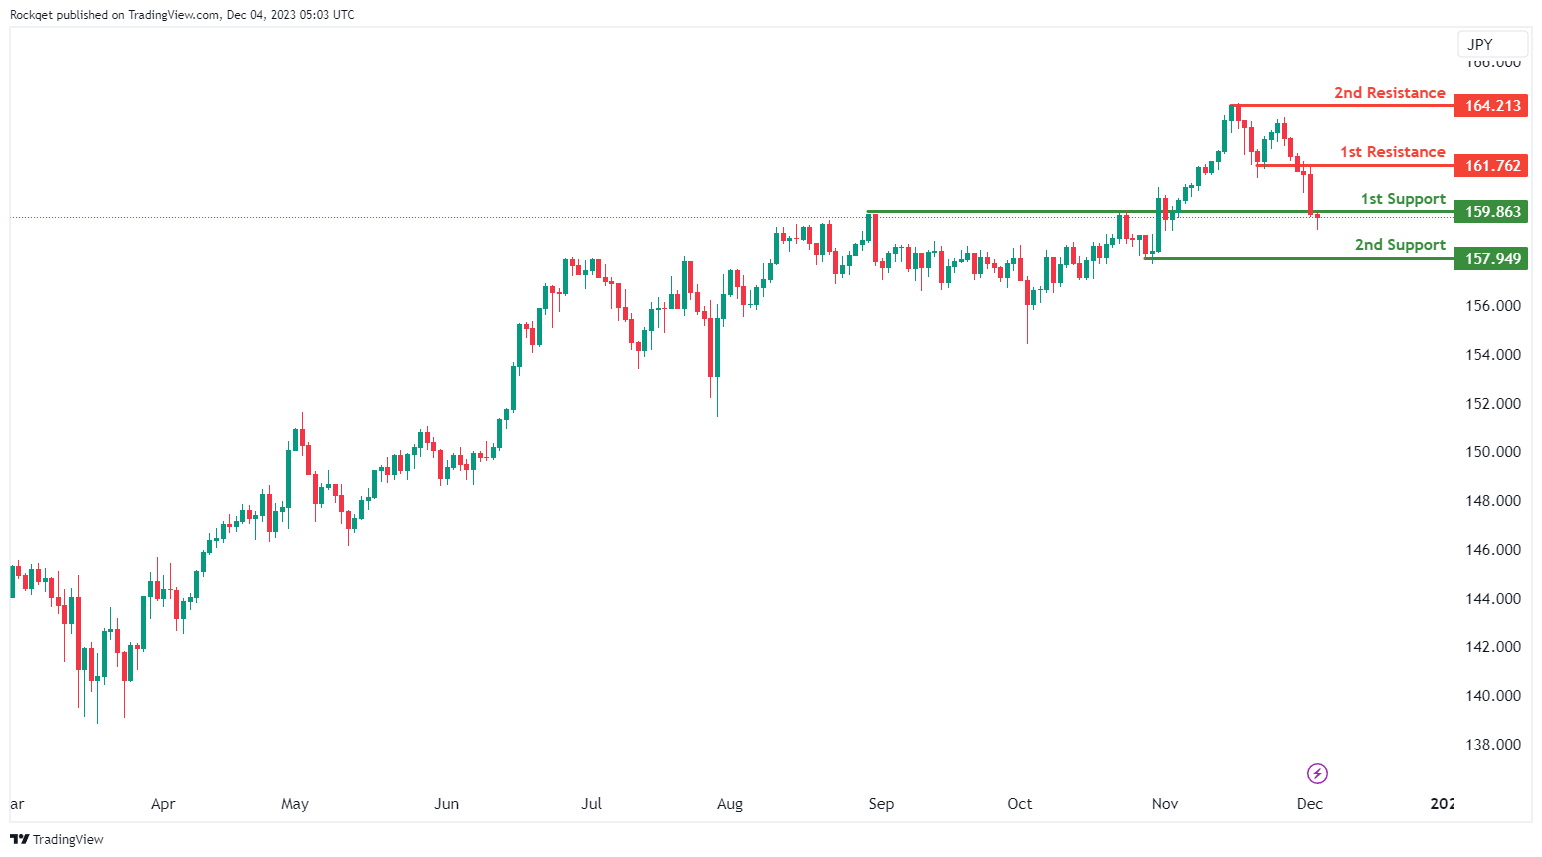
The analyzed instrument is EUR/JPY, and the overall momentum of the chart is currently bearish.
There is a potential for the price to make a bearish break off the 1st support and drop towards the 2nd support.
The 1st support level is identified at 159.86, and its favorable characteristic is attributed to being an overlap support.
The 2nd support level is situated at 157.94, and its favorable aspect is derived from being a swing low support.
On the resistance side, the 1st resistance is positioned at 161.76, and it is considered significant due to being a pullback resistance.
The 2nd resistance is located at 164.21, and its significance is derived from being a swing high resistance.
.
EUR/GBP:
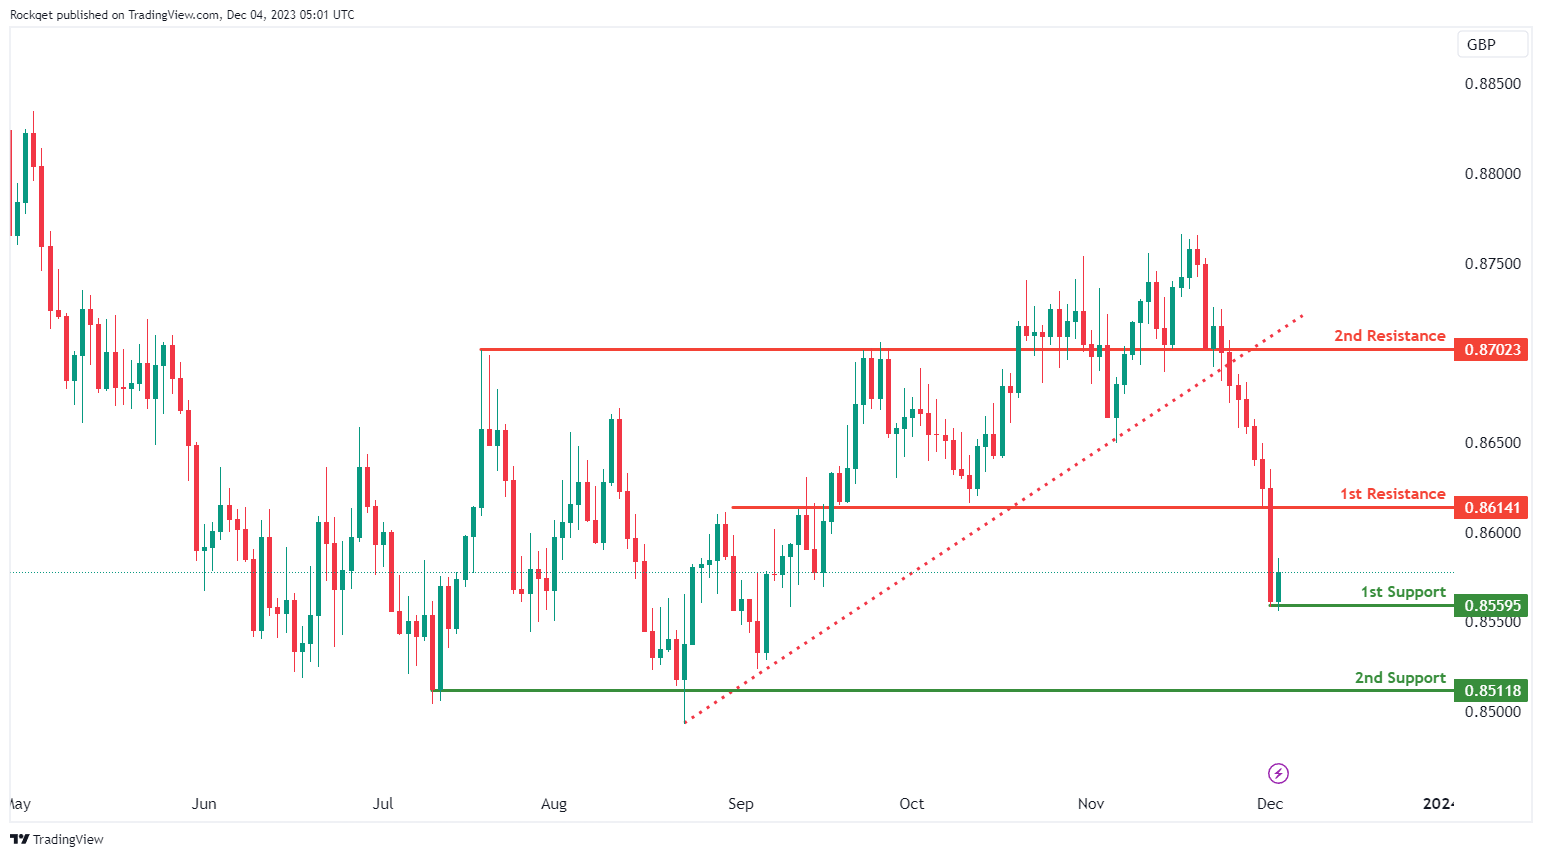
The analyzed instrument is EUR/GBP, and the overall momentum of the chart is currently bearish. This bearish momentum is attributed to the fact that the price broke below an ascending support line, triggering a potential bearish move.
There is a potential for the price to make a rise towards the 1st resistance in the short term before reversing off it and dropping towards the 1st support.
The 1st support level is identified at 0.8559, and its favorable characteristic is attributed to being a swing low support.
The 2nd support level is situated at 0.8511, and its favorable aspect is derived from being a multi-swing low support.
On the resistance side, the 1st resistance is positioned at 0.8614, and it is considered significant due to being a pullback resistance.
The 2nd resistance is located at 0.8702, and its significance is derived from also being a pullback resistance.
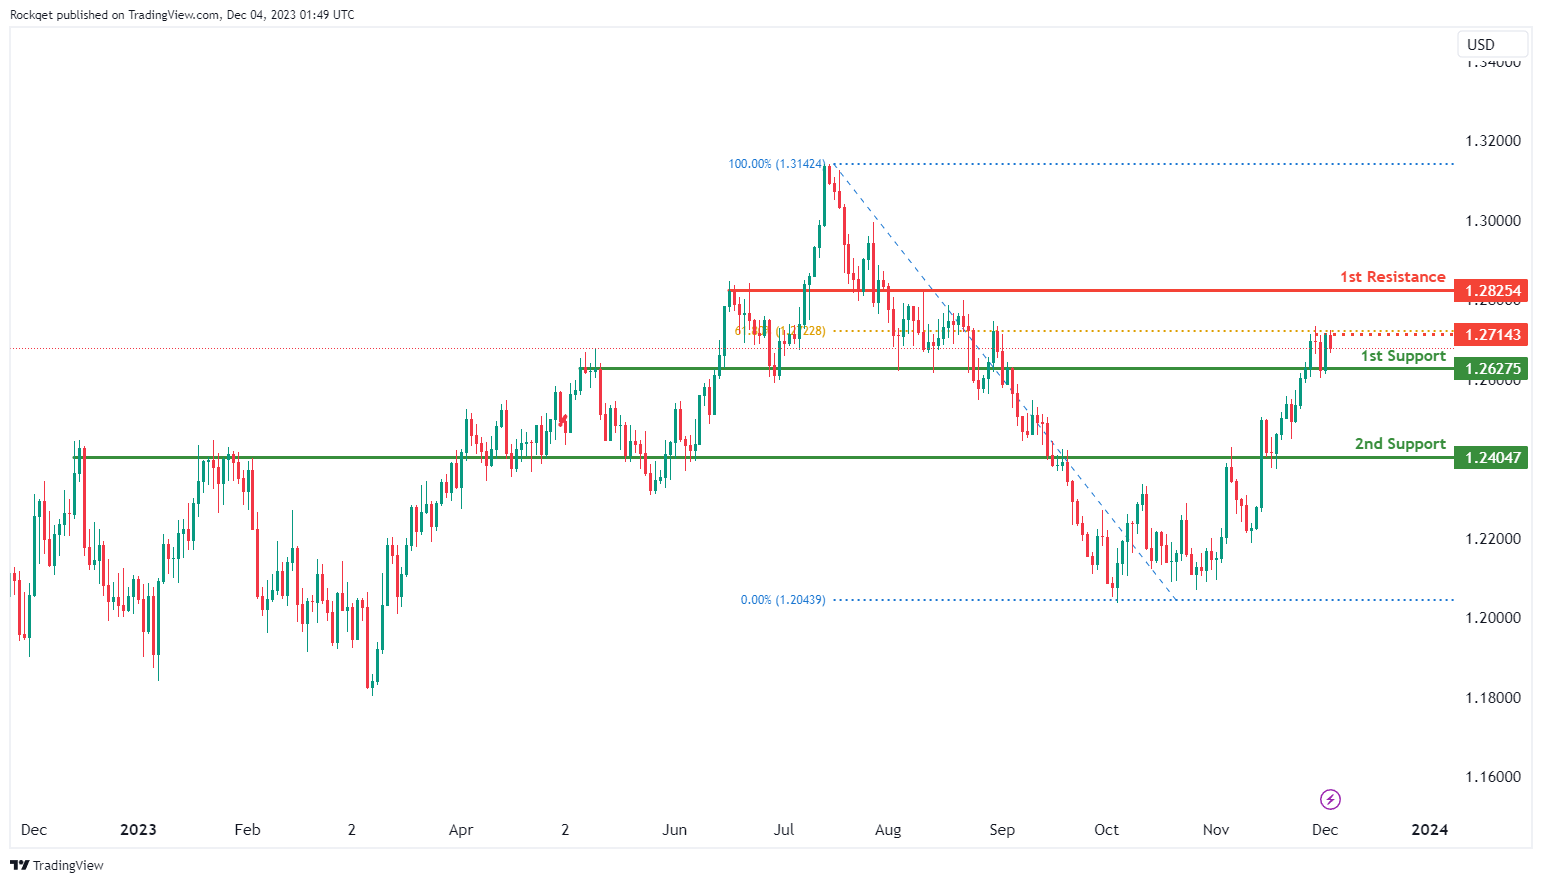
GBP/USD:
The GBP/USD chart currently maintains a bullish overall momentum, suggesting potential price action where it may continue its bullish movement towards the 1st resistance.
The 1st support at 1.2627 is identified as an overlap support, signifying its importance as a significant level where buying interest may emerge, potentially providing essential support for GBP/USD.
The 2nd support at 1.2404 is also noted as an overlap support, reinforcing its significance as another potential area for buyer activity.
On the resistance side, the 1st resistance at 1.2825 is categorized as an overlap resistance, representing a notable barrier where selling interest could intensify, potentially hindering GBP/USD’s upward movement.
Furthermore, an intermediate resistance level at 1.2714 is identified as an overlap resistance with a 61.80% Fibonacci retracement, adding to its significance as a potential resistance level.
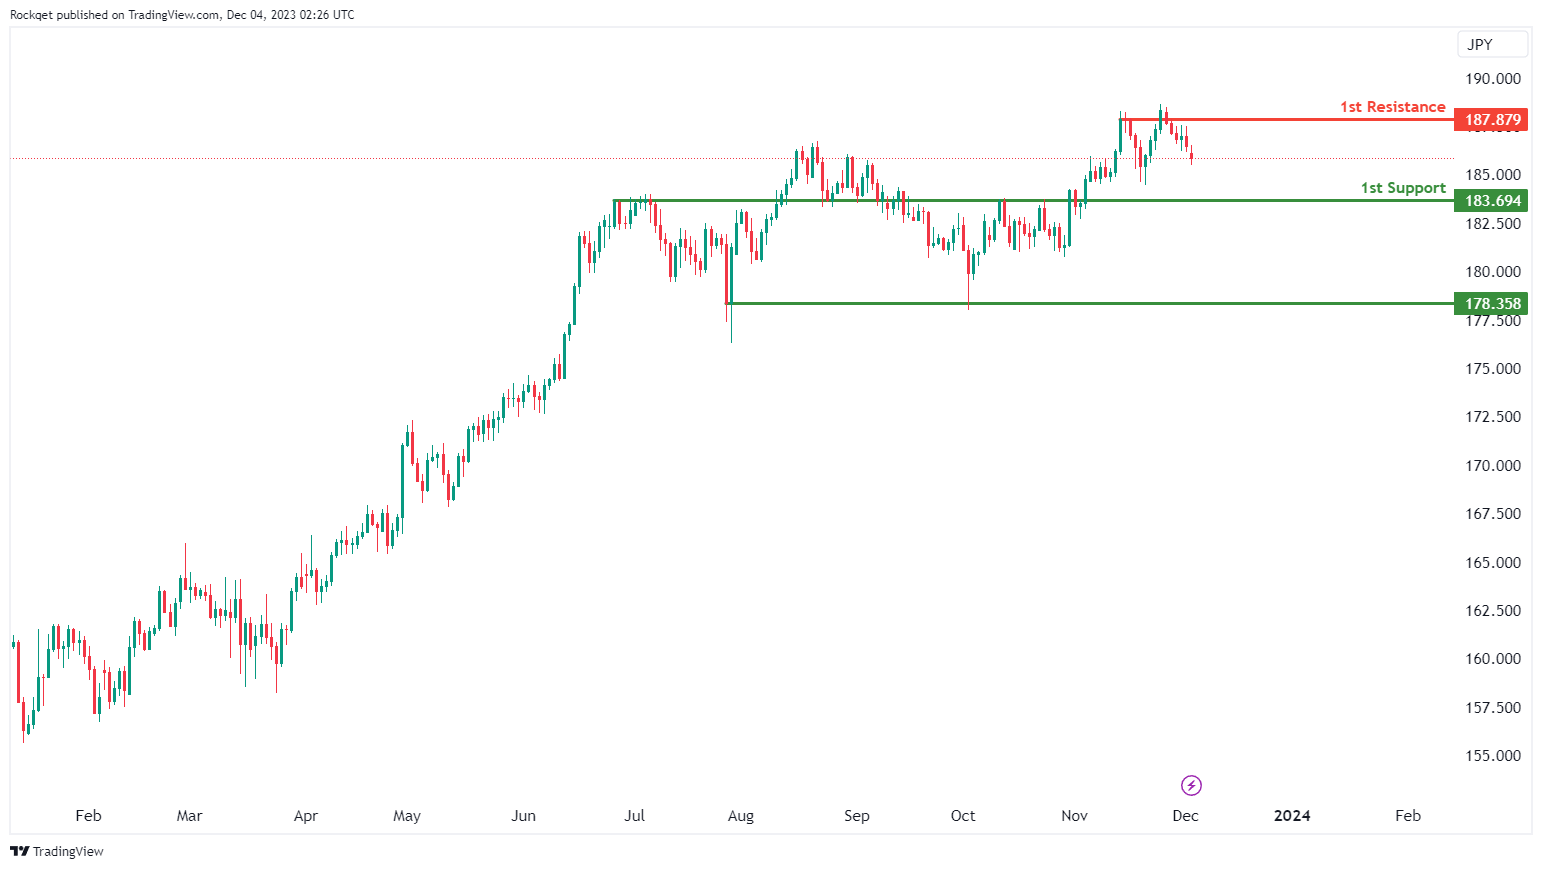
GBP/JPY:
The overall momentum of GBP/JPY is bearish. There is potential bearish continuation towards the 1st support at 183.69. If this support level is breached, the 2nd support at 178.36 could be the next significant level to watch for potential price reactions. Conversely, if there’s a reversal in the price, the 1st resistance at 187.88 may act as a barrier to any bullish movement.
1st support at 183.69: This level is considered a pullback support, and it may provide a potential area where buyers could step in, leading to a temporary halt or bounce in the bearish trend.
2nd support at 178.36: This level is identified as a multi-swing low support, indicating that it has held as a significant support level multiple times in the past. If the price continues to move lower, this level could act as a stronger support area.
1st resistance at 187.88: This level is seen as a pullback resistance, and it may serve as a point where sellers could become active, potentially causing the price to reverse or consolidate.
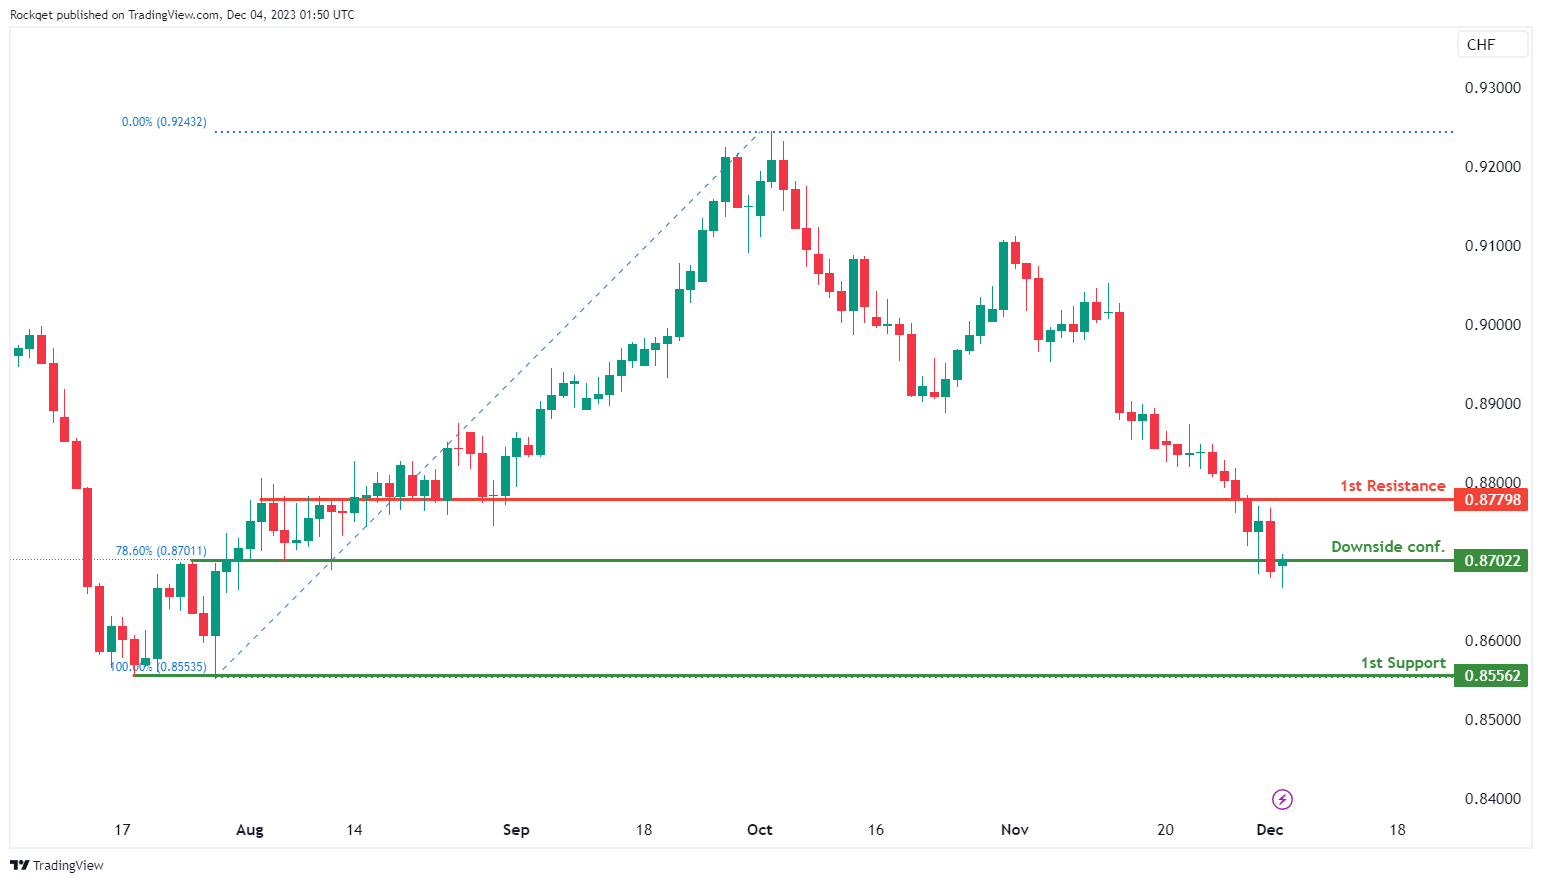
USD/CHF:
The USD/CHF chart currently exhibits a bearish overall momentum, suggesting potential price action where it may continue its bearish movement towards the 1st support.
The 1st support at 0.8556 is identified as a multi-swing low support, signifying its importance as a significant level where buying interest may emerge, potentially providing essential support for USD/CHF.
Additionally, traders may await downside confirmation around 0.8702, which is noted as an overlap support with a 78.60% Fibonacci retracement, further strengthening the support zone.
On the resistance side, the 1st resistance at 0.8778 is categorized as an overlap resistance, representing a notable barrier where selling interest could intensify, potentially hindering USD/CHF’s upward movement.
USD/JPY:
The USD/JPY chart currently exhibits a bearish overall momentum, suggesting potential price action where it may continue its bearish movement towards the 1st support.
The 1st support at 144.80 is identified as an overlap support, signifying its importance as a significant level where buying interest may emerge, potentially providing essential support for USD/JPY.
Additionally, traders may await downside confirmation around 147.29, which is noted as an overlap support, further strengthening the support zone.
On the resistance side, the 1st resistance at 148.38 is categorized as an overlap resistance, representing a notable barrier where selling interest could intensify, potentially hindering USD/JPY’s upward movement.

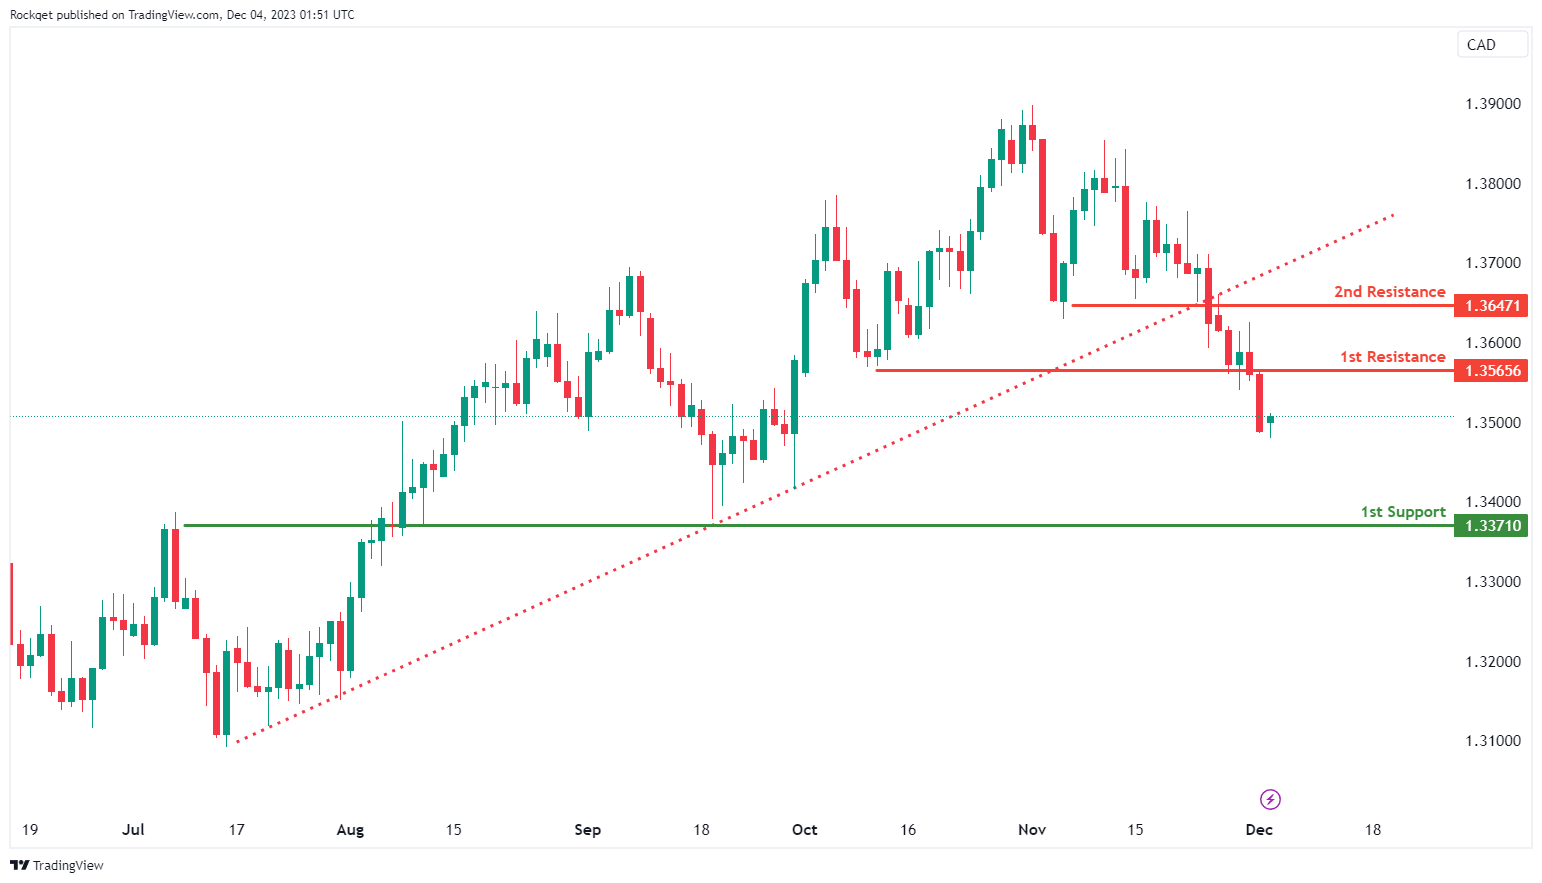
USD/CAD:
The USD/CAD chart currently has a bearish overall momentum, which has been fueled by a break below an ascending support line, suggesting a potential bearish move.
The price could potentially continue its bearish movement towards the 1st support at 1.3371. This support level is identified as a pullback support, indicating its significance as a potential level where buying interest may emerge, providing some support for USD/CAD.
On the resistance side, the 1st resistance at 1.3565 is categorized as an overlap resistance, which suggests it’s a significant level where selling interest may intensify, acting as a potential barrier to further upward price movement. The 2nd resistance at 1.3647 is noted as a pullback resistance, adding to the potential resistance factors for the pair.
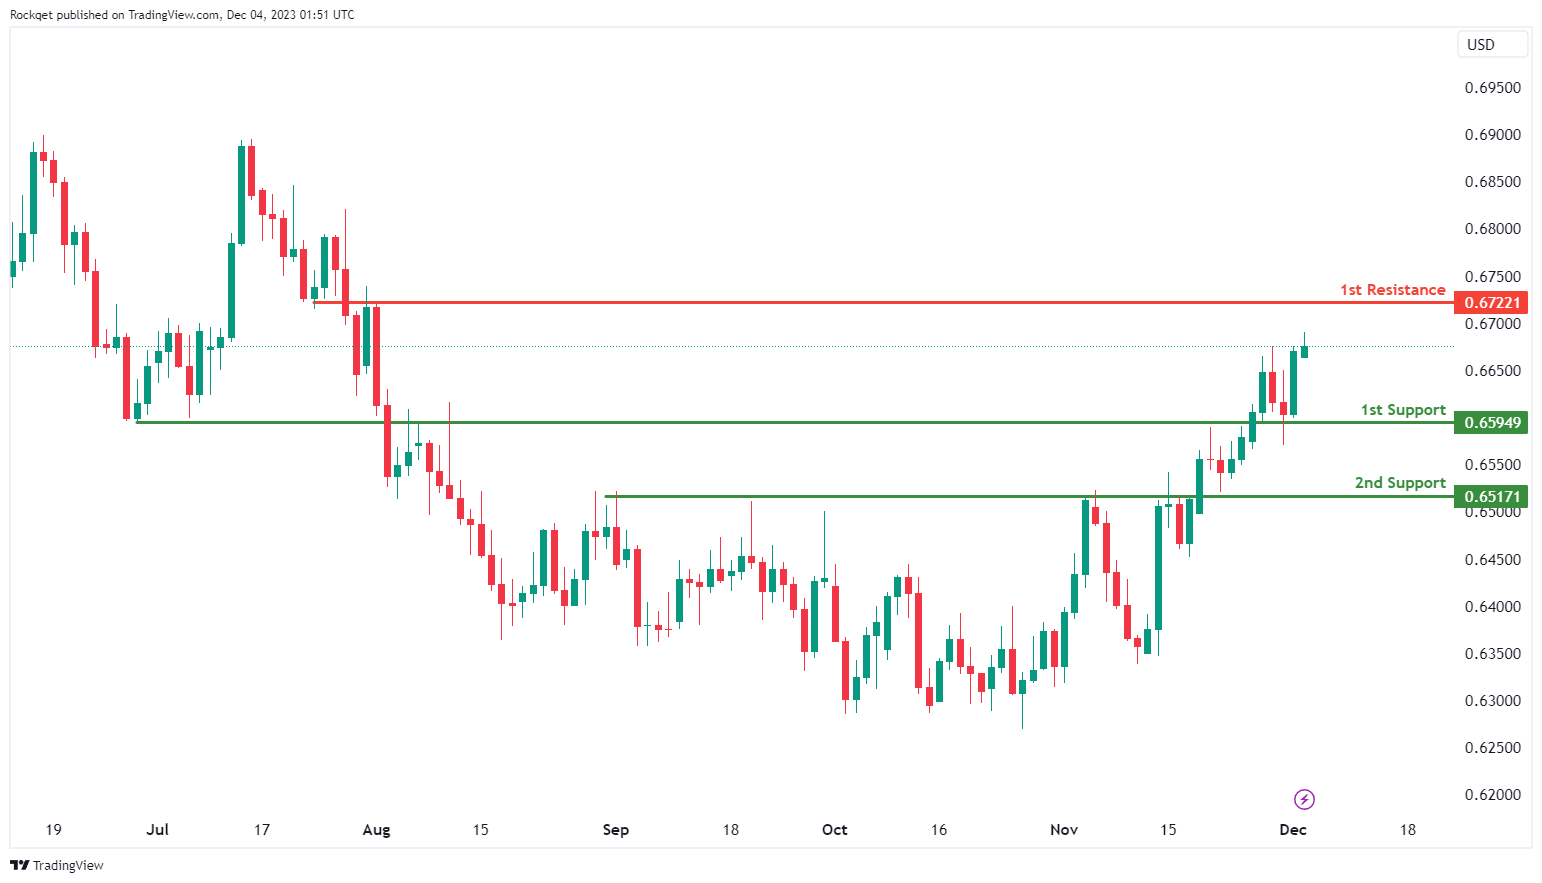
AUD/USD:
The AUD/USD chart currently exhibits a bullish overall momentum, suggesting the potential for a bullish continuation towards the 1st resistance.
The 1st support at 0.6594 is identified as an overlap support level, indicating its significance as a potential level where buying interest may emerge and provide support for the AUD/USD pair.
Similarly, the 2nd support at 0.6517 is another overlap support level, adding to its importance as a potential area where buyers might become active.
On the resistance side, the 1st resistance at 0.6722 is categorized as an overlap resistance, suggesting that it’s a significant level where selling interest may intensify, potentially acting as a barrier to further upward price movement.
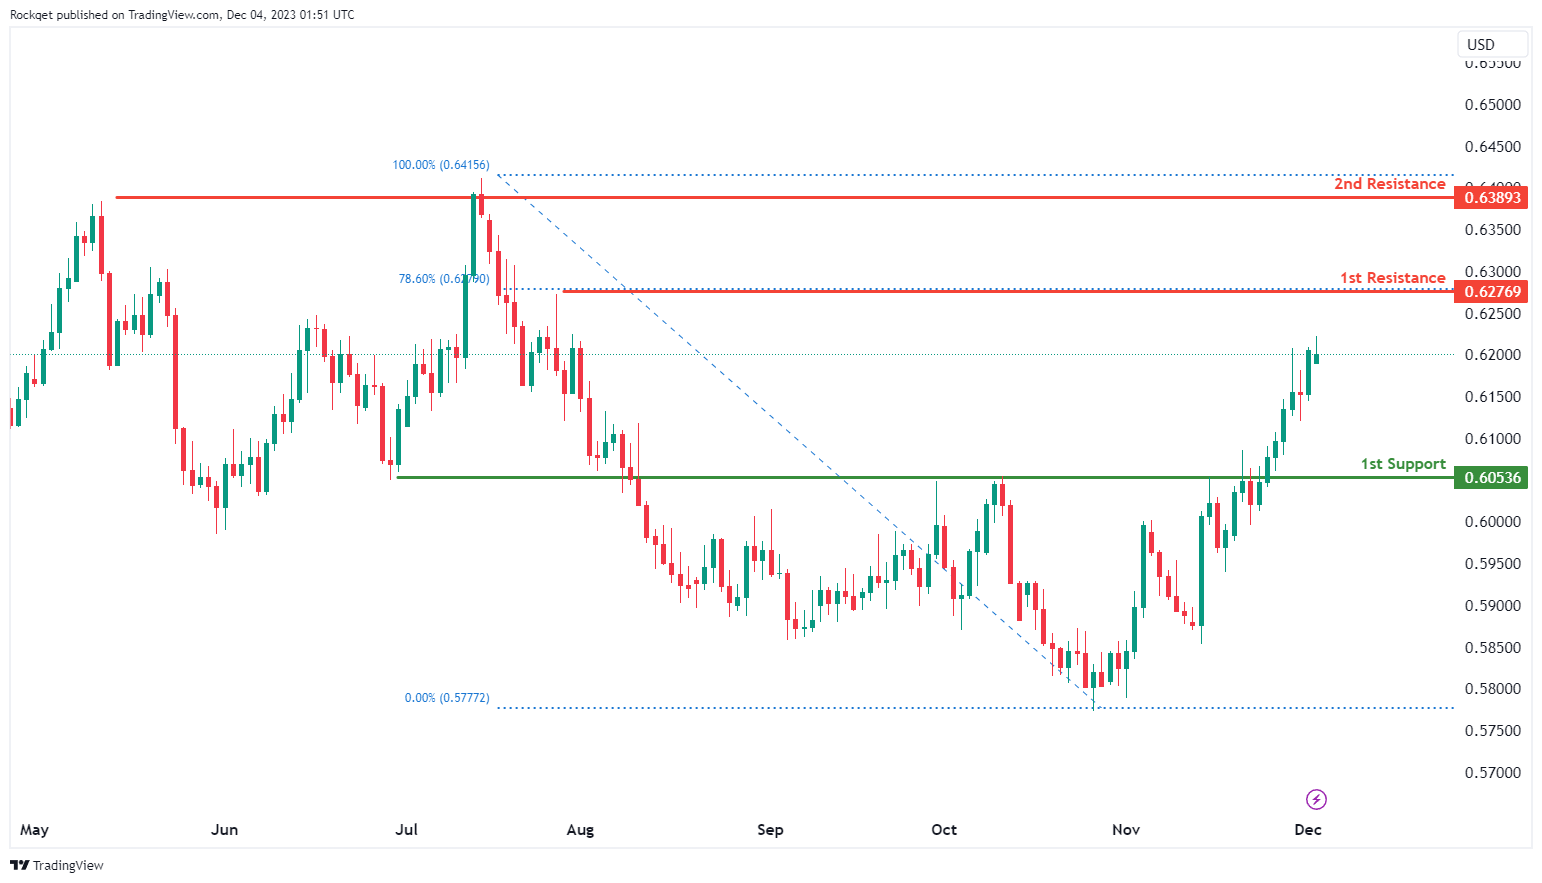
NZD/USD
The NZD/USD chart currently exhibits a bullish overall momentum, suggesting the potential for a bullish continuation towards the 1st resistance.
The 1st support at 0.6053 is identified as a pullback support level, indicating its significance as a potential level where buying interest may emerge and provide support for the NZD/USD pair.
On the resistance side, the 1st resistance at 0.6276 is categorized as a swing high resistance, and it aligns with the 78.60% Fibonacci Retracement level, adding to its importance as a potential barrier where selling interest may intensify.
Additionally, the 2nd resistance at 0.6389 is noted as a multi-swing high resistance, further reinforcing its role as a significant level where selling pressure could potentially increase.
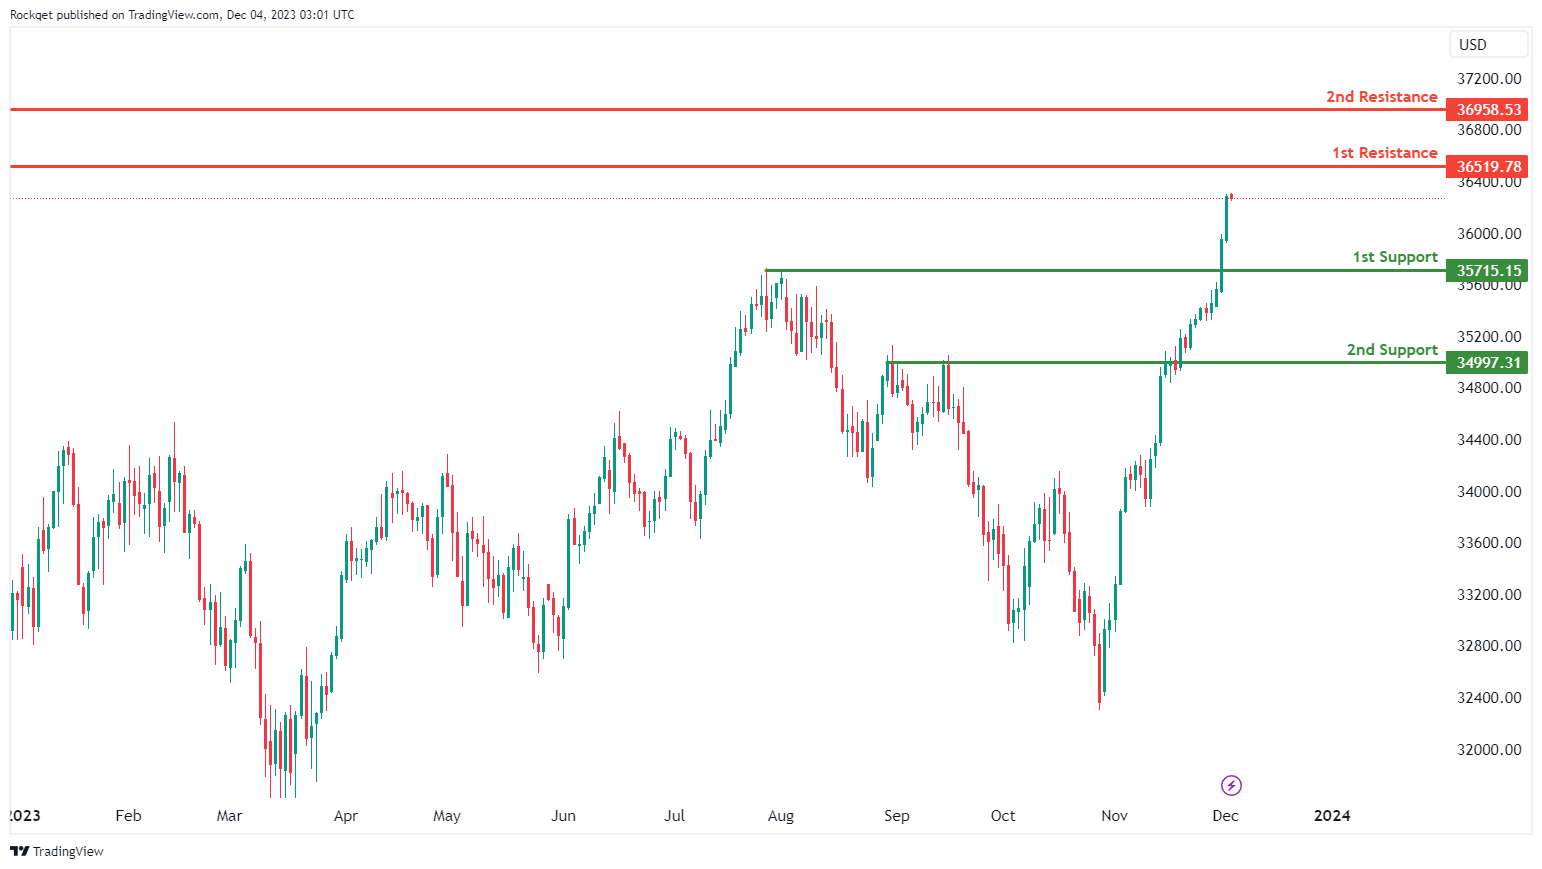
DJ30:
The DJ30,the momentum of the chart is the overall momentum of the chart is bullish. In this scenario, there is a potential short-term bearish move followed by a bounce.
1st support at 35,713.98: This level is identified as a multi-swing low support, suggesting that it aligns with historical swing lows and is likely to be a strong support level. Traders may expect the price to find buying interest near this level.
2nd support at 34,997.31: The 2nd support level is marked as a pullback support, indicating that it may provide additional support if the price experiences a short-term pullback. It reinforces the potential for a bounce from lower levels.
Intermediate resistance at 36,519.78: This intermediate resistance level may act as a barrier to further upward movement. Traders should watch for signs of a breakout above this level for a potential bullish continuation.
2nd resistance at 36,958.53: The 2nd resistance level is marked as a swing high resistance, suggesting that it could be a point where selling pressure may increase temporarily.
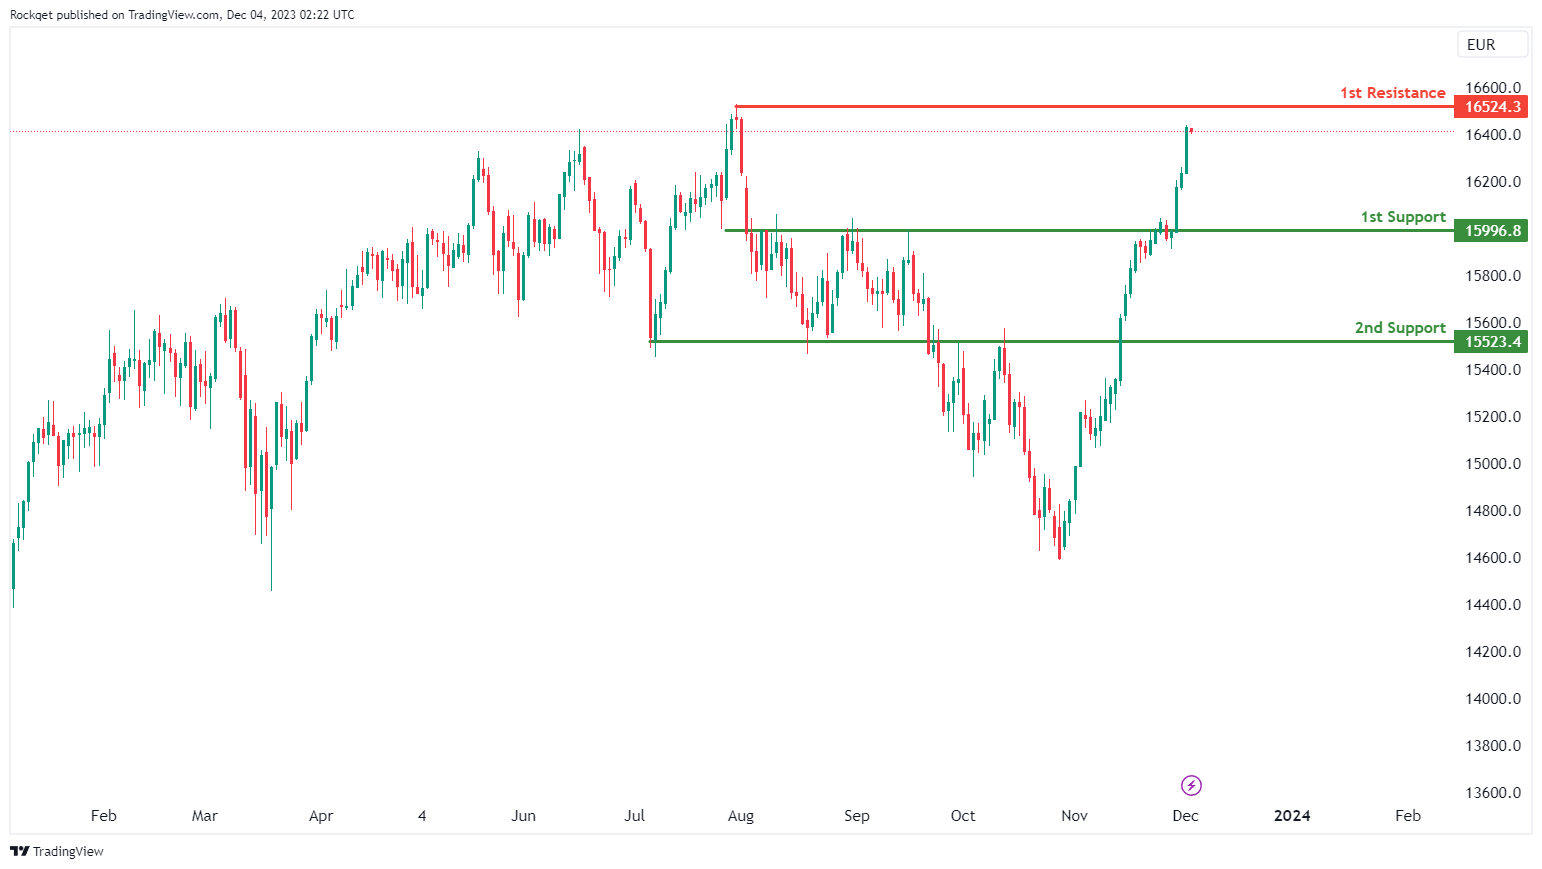
GER40:
The GER40 overall momentum is the overall momentum of the chart is bearish. There is a potential rish price movement with a focus on key support and resistance levels:
1st sbeaupport at 15,996.8: This level is identified as a pullback support, indicating that it may serve as a significant support level where buyers could potentially step in to prevent further downside movement.
2nd support at 15,523.4: The 2nd support level is considered a multi-swing low support, suggesting that it has historical significance as a support level. Traders should monitor this level for potential buying interest.
1st resistance at 16,524.3: The 1st resistance level is marked as a pullback resistance, signifying that it could act as a barrier to further upward movement. Traders may expect selling pressure to potentially increase near this level.
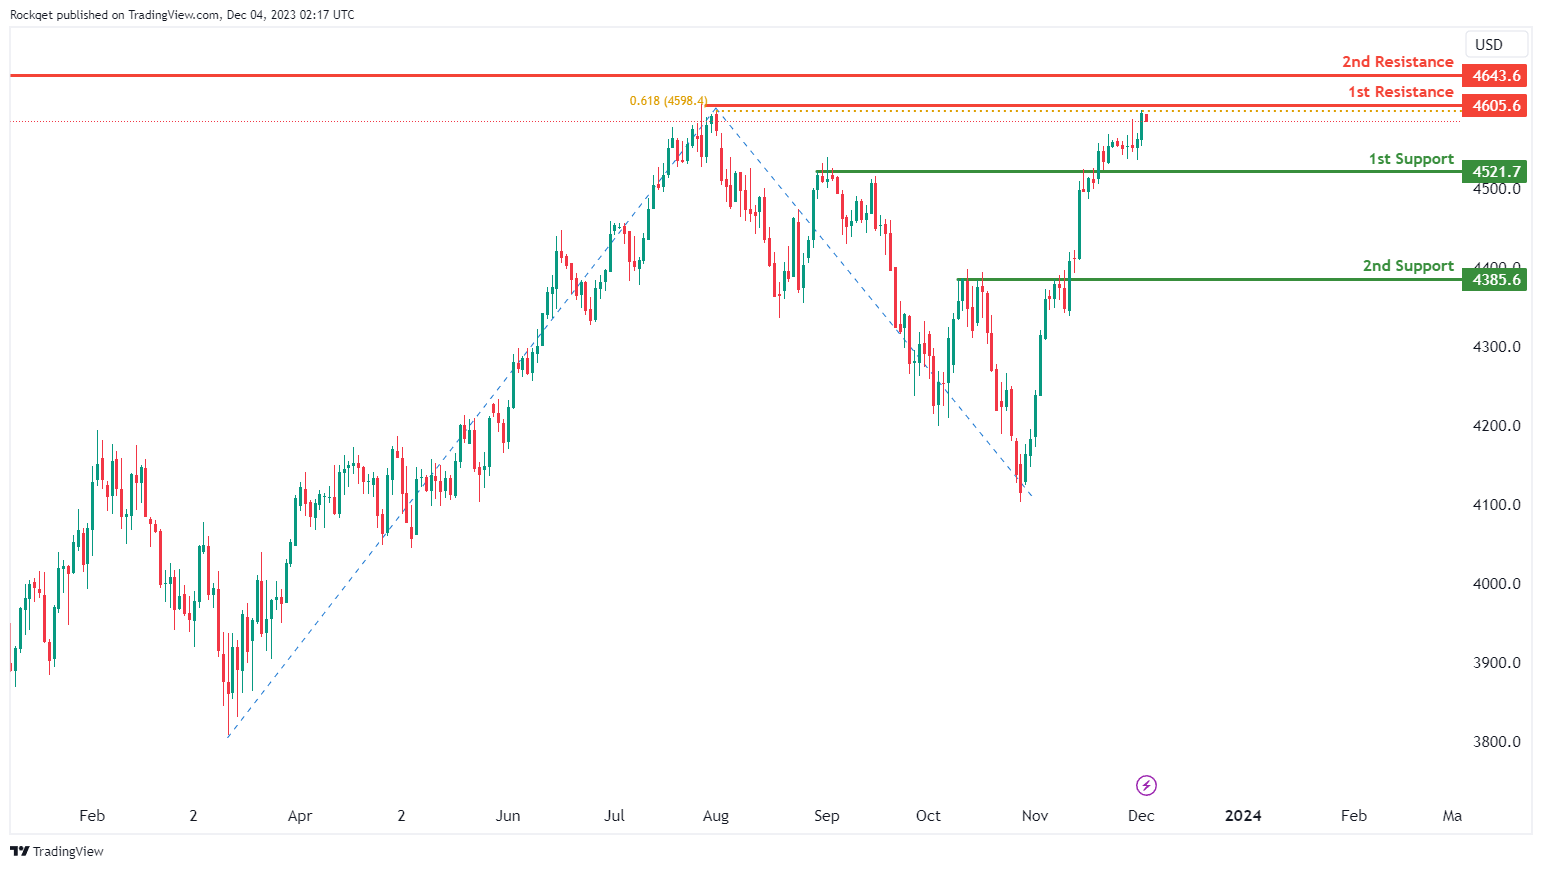
`US500:
The overall momentum of US500 is the overall momentum of the chart is bearish. There is a possibility of a bearish reaction off the 1st resistance level, with a potential drop towards the 1st support.
1st support at 4,521.7: This level is identified as a pullback support and may act as a significant support level where buyers could potentially step in to prevent further downside movement.
2nd support at 4,385.6: The 2nd support level is also considered a pullback support, suggesting that it has historical significance as a support level. Traders should monitor this level for potential buying interest.
1st resistance at 4,605.6: The 1st resistance level is marked as a pullback resistance and is associated with the 61.80% Fibonacci Projection, indicating that it could act as a barrier to further upward movement. Traders may expect selling pressure to potentially increase near this level.
2nd resistance at 4,643.6: The 2nd resistance level is identified as a swing high resistance, which suggests that it has previously acted as a significant barrier to price advancement.
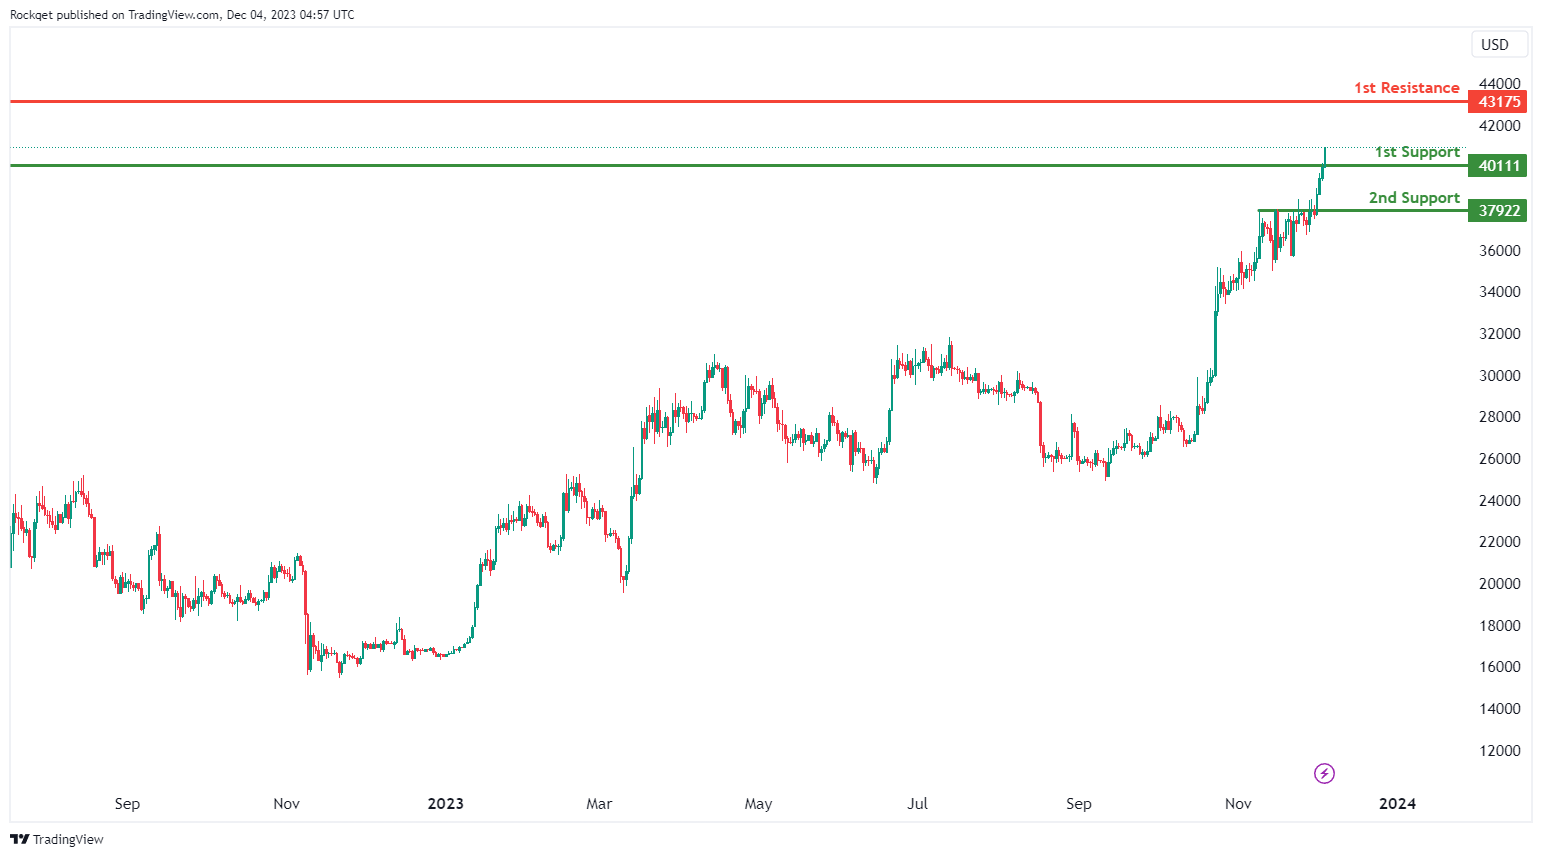
BTC/USD:
The analyzed instrument is BTC/USD, and the overall momentum of the chart is currently bullish.
There is a potential for the price to make a bullish continuation towards the 1st resistance.
The 1st support level is identified at 40111, and its favorable characteristic is attributed to being a pullback support.
The 2nd support level is situated at 37922, and its favorable aspect is derived from also being a pullback support.
On the resistance side, the 1st resistance is positioned at 43175, and it is considered significant due to being a swing high resistance.
ETH/USD:
The analyzed instrument is ETH/USD, and the overall momentum of the chart is currently bullish.
There is a potential for the price to make a bullish breakthrough of the 1st resistance and rise to the 2nd resistance.
The 1st support level is identified at 2149.81, and its favorable characteristic is attributed to being a pullback support.
The 2nd support level is situated at 2094.56, and its favorable aspect is derived from also being a pullback support.
On the resistance side, the 1st resistance is positioned at 2229.47, and it is considered significant due to being associated with the 50% Fibonacci Retracement.
The 2nd resistance is located at 2364.15, and its significance is derived from being a pullback resistance.

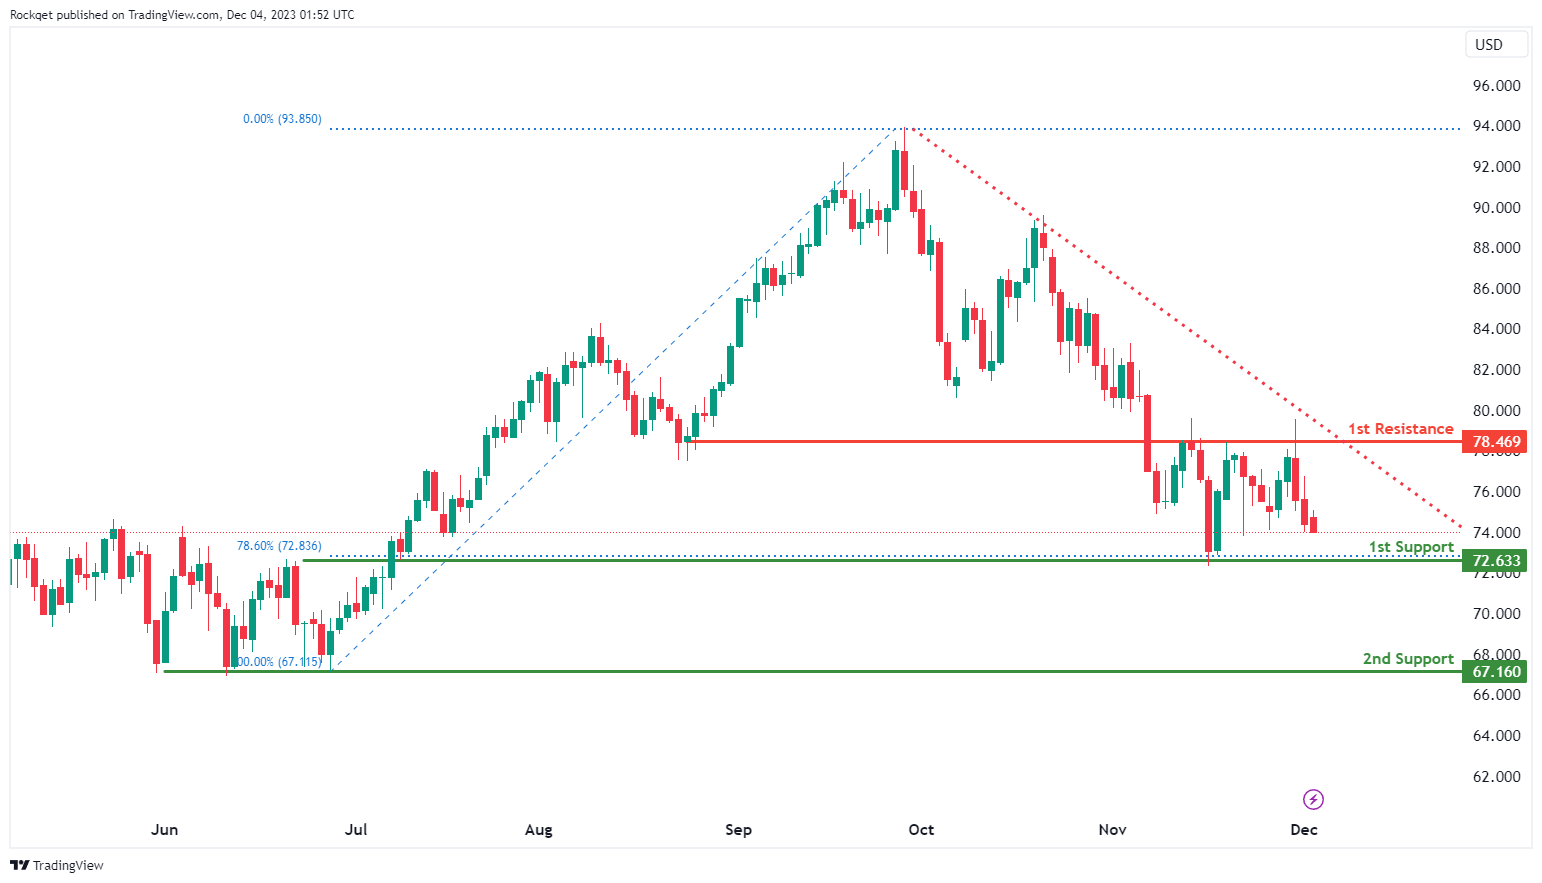
WTI/USD:
The WTI (West Texas Intermediate) chart currently exhibits a bearish overall momentum, driven by its position below a major descending trend line, indicating a continuation of the bearish sentiment.
The 1st support at 72.63 is identified as a multi-swing low support and coincides with a 78.60% Fibonacci Retracement level, adding significant weight to its role as a crucial support level for WTI.
Furthermore, the 2nd support at 67.16 is another multi-swing low support level, reinforcing its importance in potentially providing support for WTI.
On the resistance side, the 1st resistance at 78.46 is categorized as an overlap resistance, representing a significant barrier where selling interest could intensify, potentially hindering WTI’s upward movement.
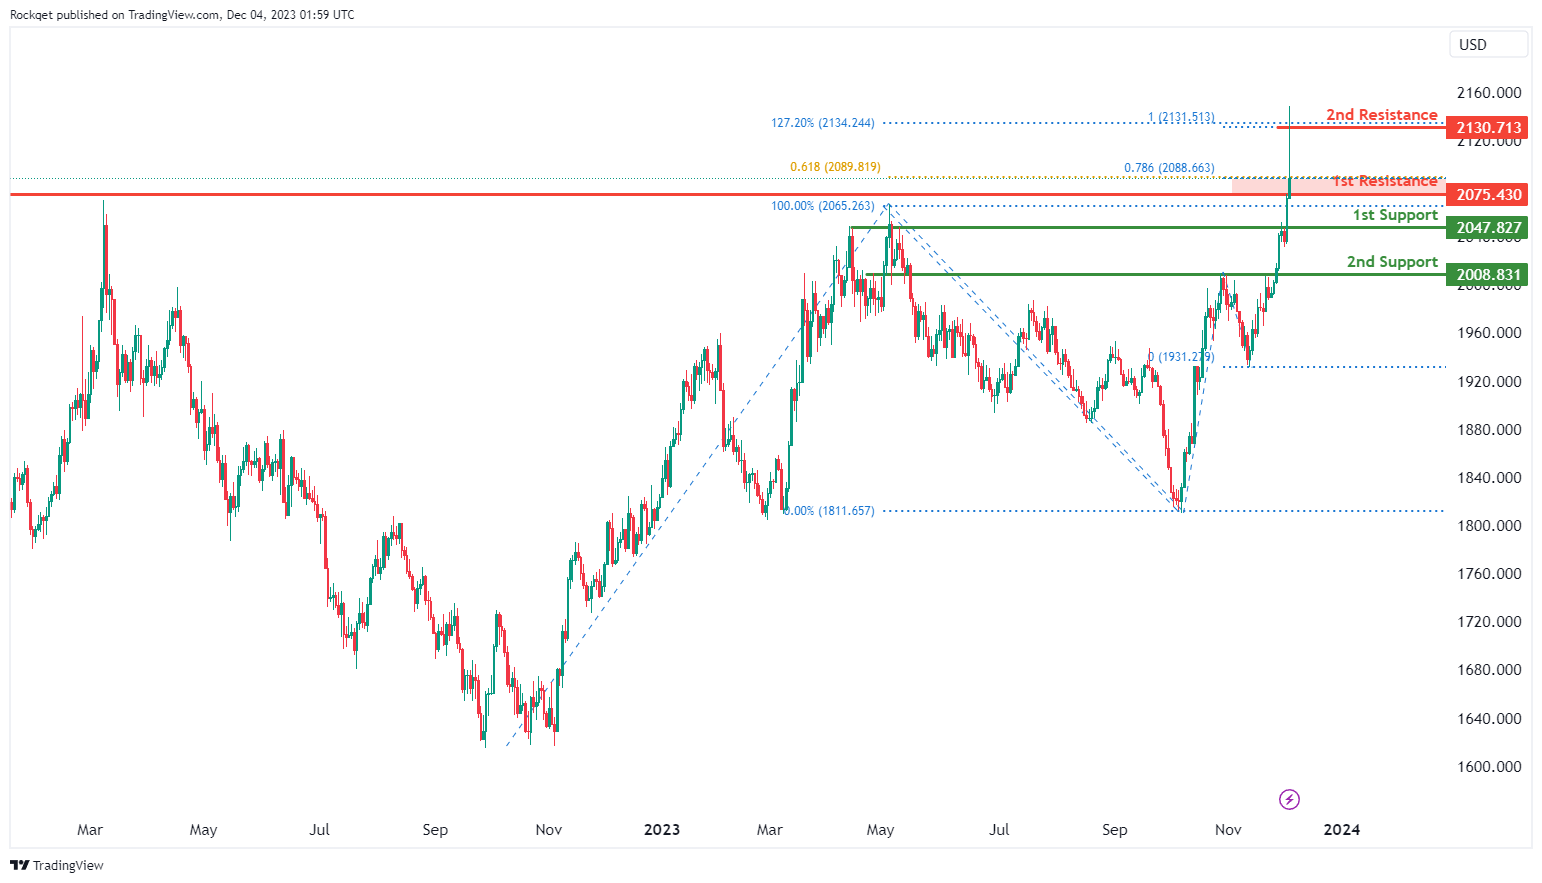
XAU/USD (GOLD):
The XAU/USD (Gold) chart currently maintains a bullish overall momentum, indicating potential price action where it may experience a bullish bounce off the 1st support.
The 1st support at 2047.82 is categorized as a pullback support, signifying its importance as a significant level where buying interest may emerge, potentially providing crucial support for XAU/USD.
Moreover, the 2nd support at 2008.83 is also identified as a pullback support, adding further significance to this support level.
On the resistance side, the 1st resistance at 2075.43 is characterized as a swing high resistance with a 61.80% Fibonacci Projection and a 78.60% Fibonacci Projection, indicating Fibonacci confluence, making it a formidable barrier where selling interest could intensify.
Additionally, the 2nd resistance at 2139.71 is noted for its 127.20% Fibonacci Extension and 100% Fibonacci Projection, further reinforcing its potential as a strong resistance level.
.
The accuracy, completeness and timeliness of the information contained on this site cannot be guaranteed. IC Markets does not warranty, guarantee or make any representations, or assume any liability regarding financial results based on the use of the information in the site.
News, views, opinions, recommendations and other information obtained from sources outside of www.icmarkets.com, used in this site are believed to be reliable, but we cannot guarantee their accuracy or completeness. All such information is subject to change at any time without notice. IC Markets assumes no responsibility for the content of any linked site.
The fact that such links may exist does not indicate approval or endorsement of any material contained on any linked site. IC Markets is not liable for any harm caused by the transmission, through accessing the services or information on this site, of a computer virus, or other computer code or programming device that might be used to access, delete, damage, disable, disrupt or otherwise impede in any manner, the operation of the site or of any user’s software, hardware, data or property.


