
A note on lower timeframe confirming price action…
Waiting for lower timeframe confirmation is our main tool to confirm strength within higher timeframe zones, and has really been the key to our trading success. It takes a little time to understand the subtle nuances, however, as each trade is never the same, but once you master the rhythm so to speak, you will be saved from countless unnecessary losing trades. The following is a list of what we look for:
- A break/retest of supply or demand dependent on which way you’re trading.
- A trendline break/retest.
- Buying/selling tails – essentially we look for a cluster of very obvious spikes off of lower timeframe support and resistance levels within the higher timeframe zone.
- Candlestick patterns. We tend to only stick with pin bars and engulfing bars as these have proven to be the most effective.
For us, lower timeframe confirmation starts on the M15 and finishes up on the H1, since most of our higher timeframe areas begin with the H4. Stops usually placed 5-10 pips beyond your confirming structures.
EUR/USD:
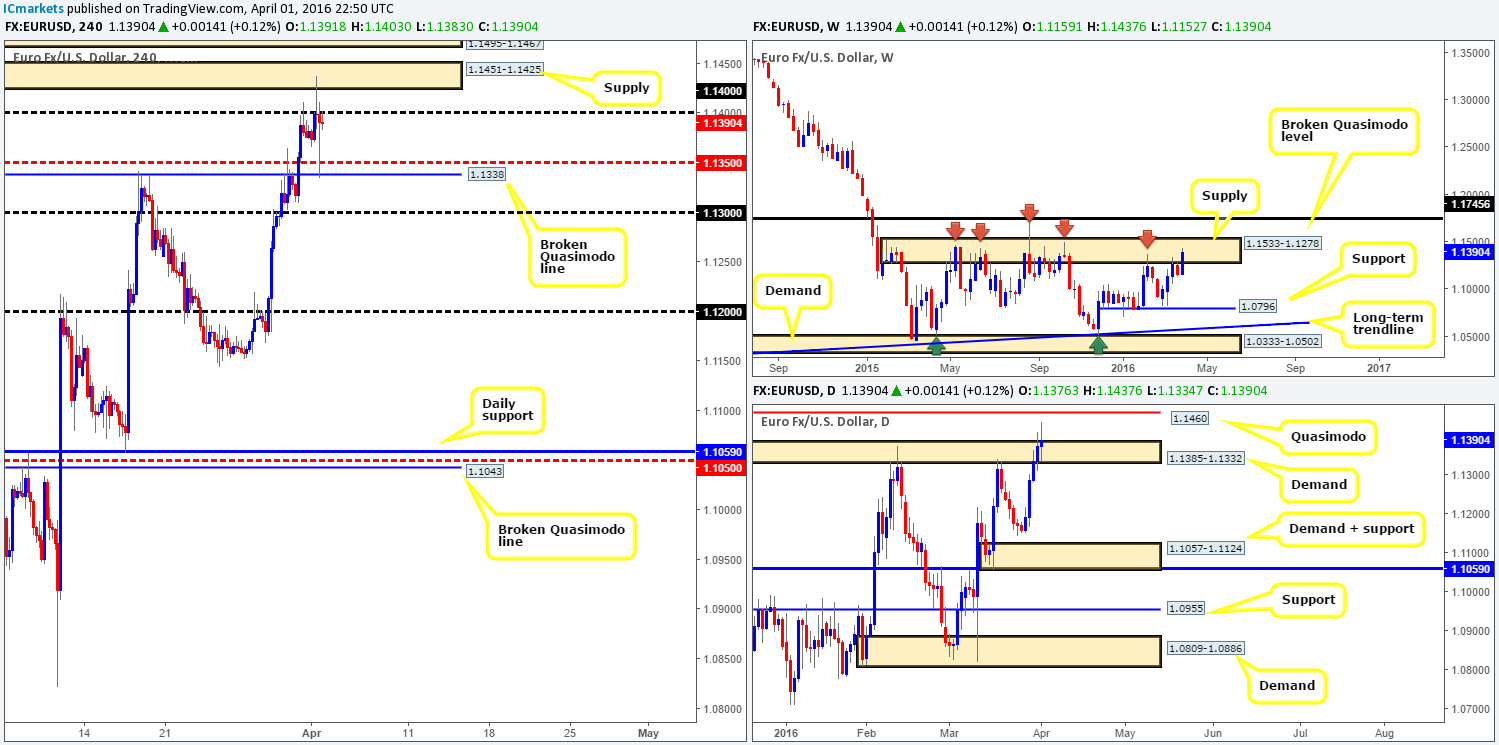
The EUR/USD had a spectacular week despite trading within the jaws of a major area of weekly supply at 1.1533-1.1278, gaining around 230 pips into the close 1.1390. This area has managed to hold price action lower since May 2015 on five occasions now, so the bulls likely have their work cut out for them this week if they want to push higher. The next key level to keep an eye on above this barrier can be seen at 1.1745 – a broken weekly Quasimodo line, whilst the next downside target comes in around weekly support drawn from 1.0796.
Zooming in and looking at the daily picture, price ended the week closing five pips above supply at 1.1385-1.1332, (now acting demand) consequently forming an indecision candle with a very slight edge going to the bulls. In light of this, we see very little reason, at least from this timeframe, why the EUR will not rally to shake hands with Quasimodo resistance coming in 1.1460 (located within the aforementioned weekly supply) sometime this week.
Moving across to the H4 chart, we can see that shortly after Friday’s better than expected U.S. employment data, price found support around the broken Quasimodo line at 1.1338, and reversed losses back to psychological resistance 1.1400. For those who read our previous report (see link below) you may recall that we mentioned to keep a tab on the H4 supply at 1.1451-1.1425 for a confirmed short opportunity. As can be seen, price pinned this zone beautifully and plunged south. What is more, there was a collection of M30 selling wicks seen at the base of this area before the sell-off thus confirming this zone as legit. However, we passed on the trade since it was only an hour away from the mighty NFP release! Well done to any of our readers who caught this move!
Given the points made above, here is our two cents’ worth on where this market may head this week… Seeing as how H4 supply at 1.1451-1.1425 was pinned on Friday, our eyes are now drawn to the H4 supply sitting directly above it at 1.1495-1.1467. This area is significant since is sits only seven pips above the daily Quasimodo resistance line at 1.1460, and let’s not forget that it is also housed within a major area of weekly supply at 1.1533-1.1278. Therefore, this is certainly a zone we’d be interested in shorting this week, but we’ll still require lower timeframe confirmation due to the psychological resistance 1.1500 lurking just above (fakeout possible). In trading this H4 supply, we’re looking for a relatively big move due to where it is positioned on the weekly timeframe. With that being said though, at this point it’s very difficult to pinpoint a first take-profit target without seeing the H4 approach, so this will be decided further down the line.
Levels to watch/live orders:
- Buys: Flat (Stop loss: N/A).
- Sells: 1.1495-1.1467 [Tentative – confirmation required] (Stop loss: dependent on where one confirms this area).
GBP/USD:
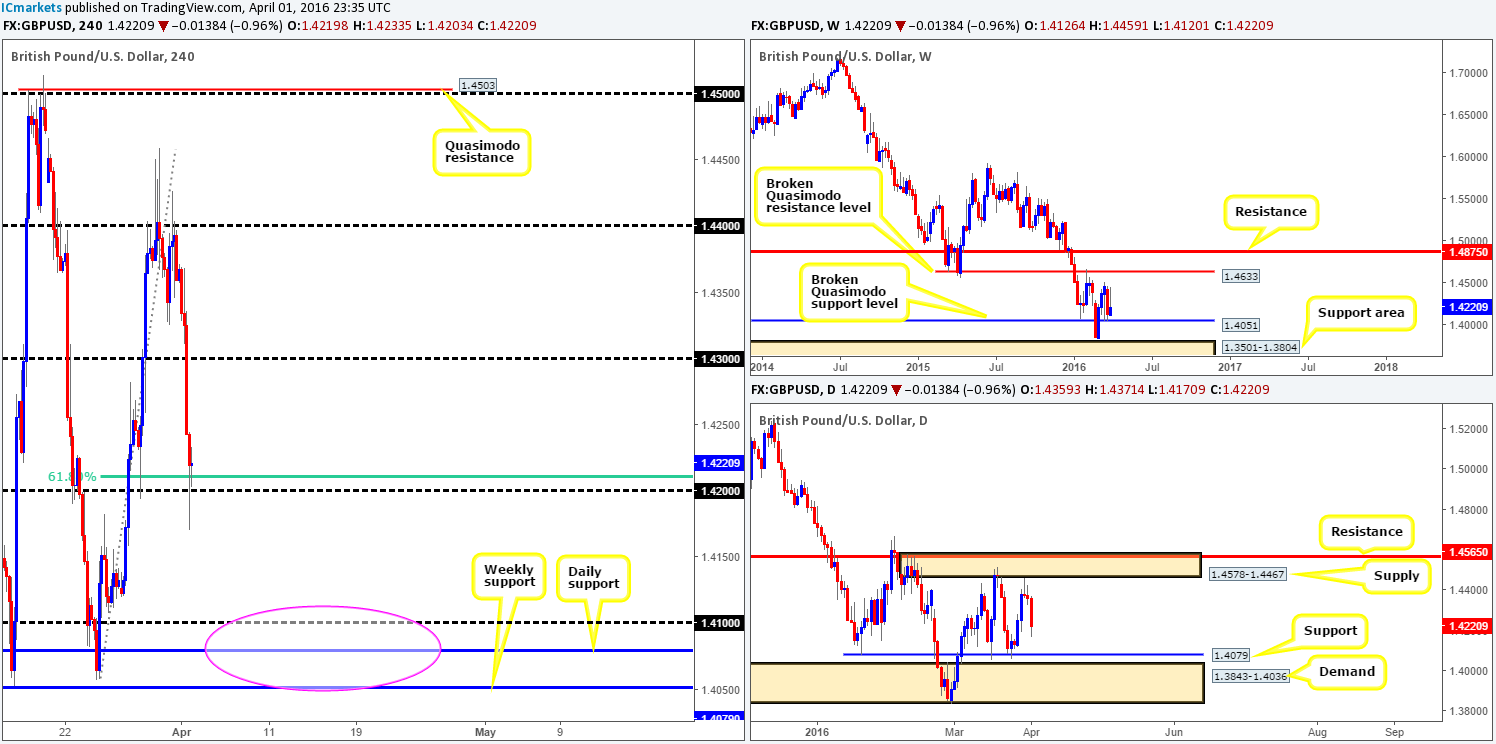
Although Cable remains trading above a weekly broken Quasimodo support at 1.4051, price has, for the past three weeks now, struggled to print any noteworthy gains. Last week’s action ended with the pair closing 88 pips higher at 1.4220. Technically, the reason for this inability to push higher from the weekly support likely comes down to the supply zone seen on the daily chart at 1.4578-1.4467. Price came within shouting distance of the underside of this area on Wednesday, placing this pair in somewhat of a negative climate for the remainder of the week. In regards to the higher-timeframe picture, the zones we have our eye on this week are as follows:
- The weekly broken Quasimodo support at 1.4051.
- Daily supply at 1.4578-1.4467.
- Daily support at 1.4079.
- The large daily demand at 1.3843-1.4036.
A quick recap of Friday’s action on the H4 chart shows that the GBP smashed through bids at the 1.4300 figure and ended the day closing around the 1.4200 level, which, as you can see, is bolstered by a 61.8% Fibonacci support at 1.4209. Unfortunately, we see little higher-timeframe confluence around this number so we’re not expecting much more than an intraday bounce from this level today, and all in all expect this barrier to break by tomorrow at the latest. An area we do like, however, is the circled zone in pink as it comprises of both a weekly and daily support (1.4051/1.4079) with a round-number just above at 1.4100. Collectively, this is a beautiful area in which to be looking for a long trade this week should price reach this low. Personally, we still require the lower timeframes to confirm this buy zone (see the top of the report for confirmation techniques) since price may want to tag in bids sitting around the large daily demand at 1.3843-1.4036 before rallying higher. Apart from this collection of higher-timeframe supports, there is not really much else taking our fancy at the moment, so we’ll reassess as the week progresses.
Levels to watch/live orders:
- Buys: 1.4200 [Tentative – confirmation required] (Stop loss: dependent on where one confirms this level). 1.4100/1.4051 [Tentative – confirmation required] (Stop loss: dependent on where one confirms this area).
- Sells: Flat (Stop loss: N/A).
AUD/USD:
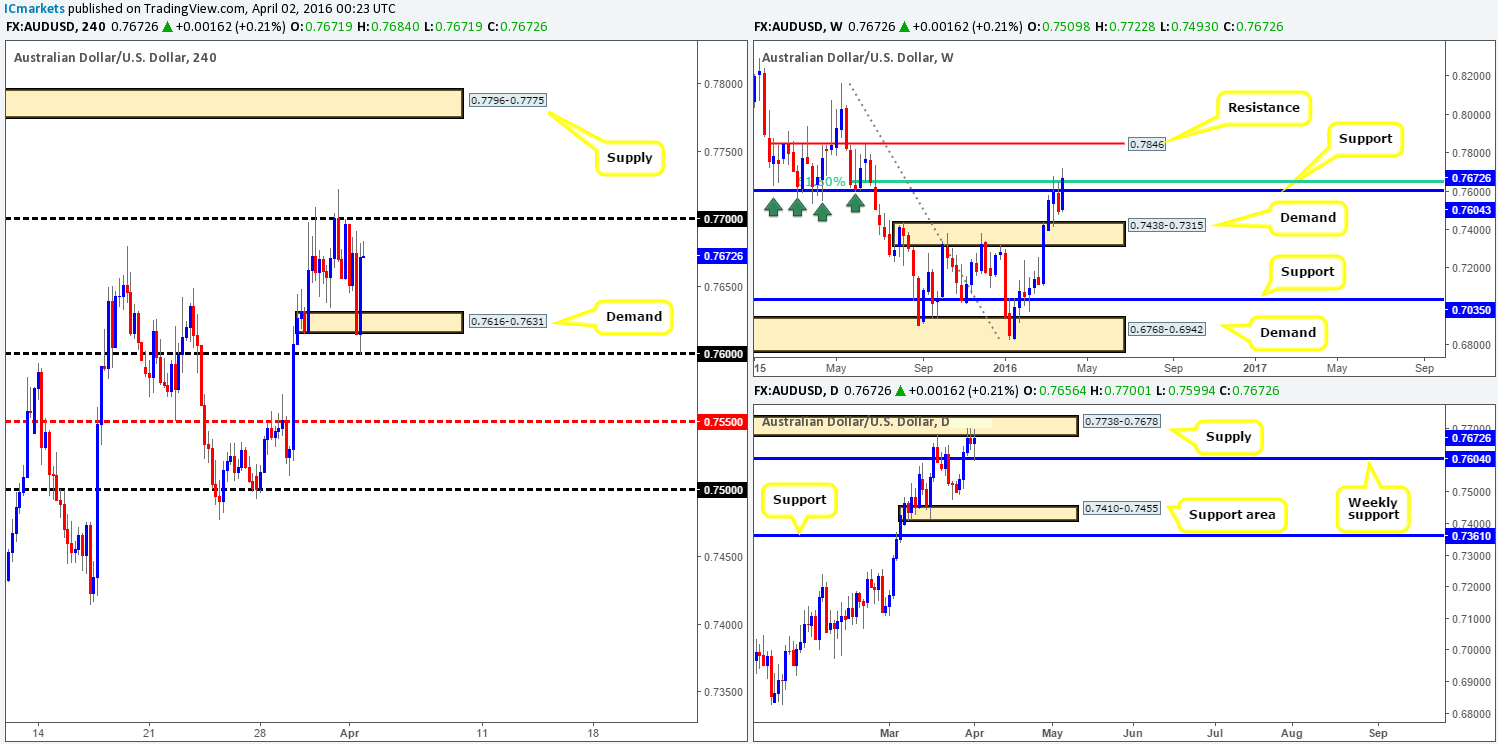
Despite the rebound seen from weekly resistance at 0.7604 two weeks back, the commodity currency continued to charge north last week, increasing its value by a further 170 pips at the close 0.7672. Consequent to this, price closed above both the aforementioned weekly resistance (now acting support) and its nearby 61.8% Fibonacci resistance level at 0.7646. Assuming that the bulls remain dominant, we may see price cross paths with weekly resistance at 0.7846 sometime this week.
Climbing down into the daily chart we can see that from Wednesday onwards, the Aussie has been sandwiched between supply chalked up at 0.7738-0.7678, and weekly support mentioned above at 0.7604. Judging by what we’re seeing on the weekly chart at the moment, it’s quite possible that a break above the current daily supply is on the horizon, which may attract further buying towards a daily Quasimodo resistance found at 0.7818 (sits just below the weekly resistance at 0.7846).
Looking at Friday’s action on the H4 chart, the U.S. employment data, which was better than expected, had very little impact. Shortly after the report was released, price aggressively whipsawed through H4 demand at 0.7616-0.7631, tagging in bids around the 0.7600 figure and just as aggressively bounced higher. In our previous report (see link below) we spoke about this scenario potentially happening but was not willing to buy at 0.7600 without lower timeframe confirmation, which would have been very nearly impossible due to how fast price moved! Well done to any of our readers who did manage to lock in something from here before the week’s end.
With the higher-timeframe picture (see above) in mind, we have no intention of looking for shorts around the 0.7700 number this week. Instead, we’re watching for price to close above this level, as this would, as far as we see, open the gates for price to challenge H4 supply sitting at 0.7796-0.7775 which sits around twenty or so pips below the daily Quasimodo resistance line mentioned above at 0.7818. For us to be given a green light to trade this pair long following a close higher, however, we’d need to see price retest 0.7700 as support together with a lower timeframe buy signal (see the top of the article for confirmation techniques).
Levels to watch/live orders:
- Buys: Watch for price to consume 0.7700 and look to trade any retest seen thereafter (lower timeframe confirmation required).
- Sells: Flat (Stop loss: N/A).
USD/JPY:
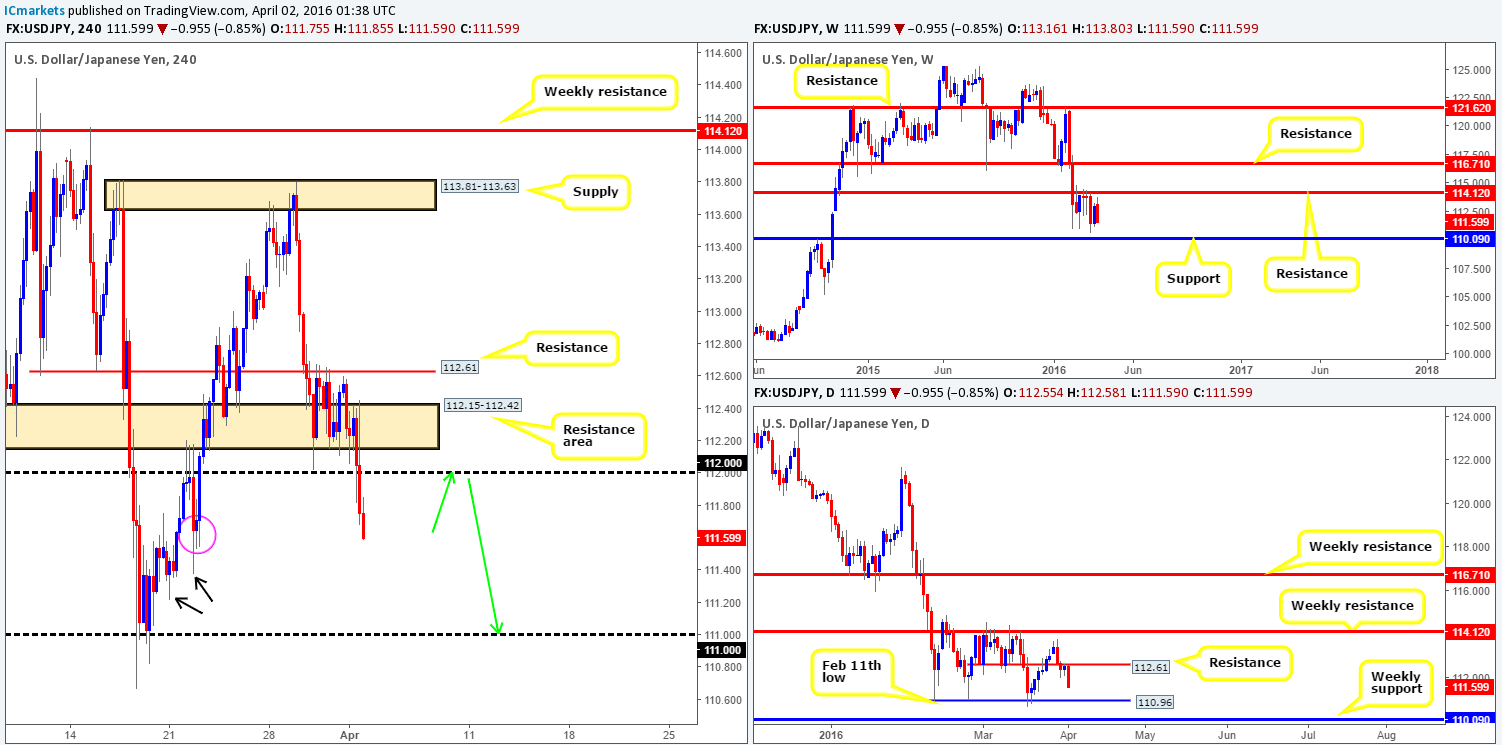
The USD/JPY shredded around 150 pips off its value during last week’s session into the close 111.59. On the assumption that the bears remain in control here, there’s a strong possibility that we may see weekly support at 110.09 come into play this week. Down on the daily chart, resistance at 112.61 held price lower from Wednesday onwards last week, and thanks to Friday’s aggressive push lower, likely confirmed bearish intent this week down to at least support painted in at 110.96. This, as you can probably see, is the last remaining barrier to a move towards the aforementioned weekly support.
Stepping down to the H4 chart, better than expected U.S. employment data saw the pair bottom out around the 112.00 figure and make a run to highs of 112.45, before heavily selling off. 112.00 was completely obliterated during this bearish assault, ending with price closing day on its lows at 111.59.
Ultimately, what we’re looking for today/this week is a retest of 112.00 as resistance (see green arrows), since apart from the H4 demand marked with a pink circle at 111.53-111.71 (which looks weak now), there’s little stopping price from reaching 111.00 (see the H4 demand consumption tails marked with black arrows at 111.37/111.21) – essentially, the daily support we discussed above at 110.96.
Levels to watch/live orders:
- Buys: Flat (Stop loss: N/A).
- Sells: 112.00 [Tentative – confirmation required] (Stop loss: dependent on where one confirms this level).


