
EUR/USD:
Weekly Gain/Loss: -0.16%
Weekly Close: 1.1600
Weekly perspective:
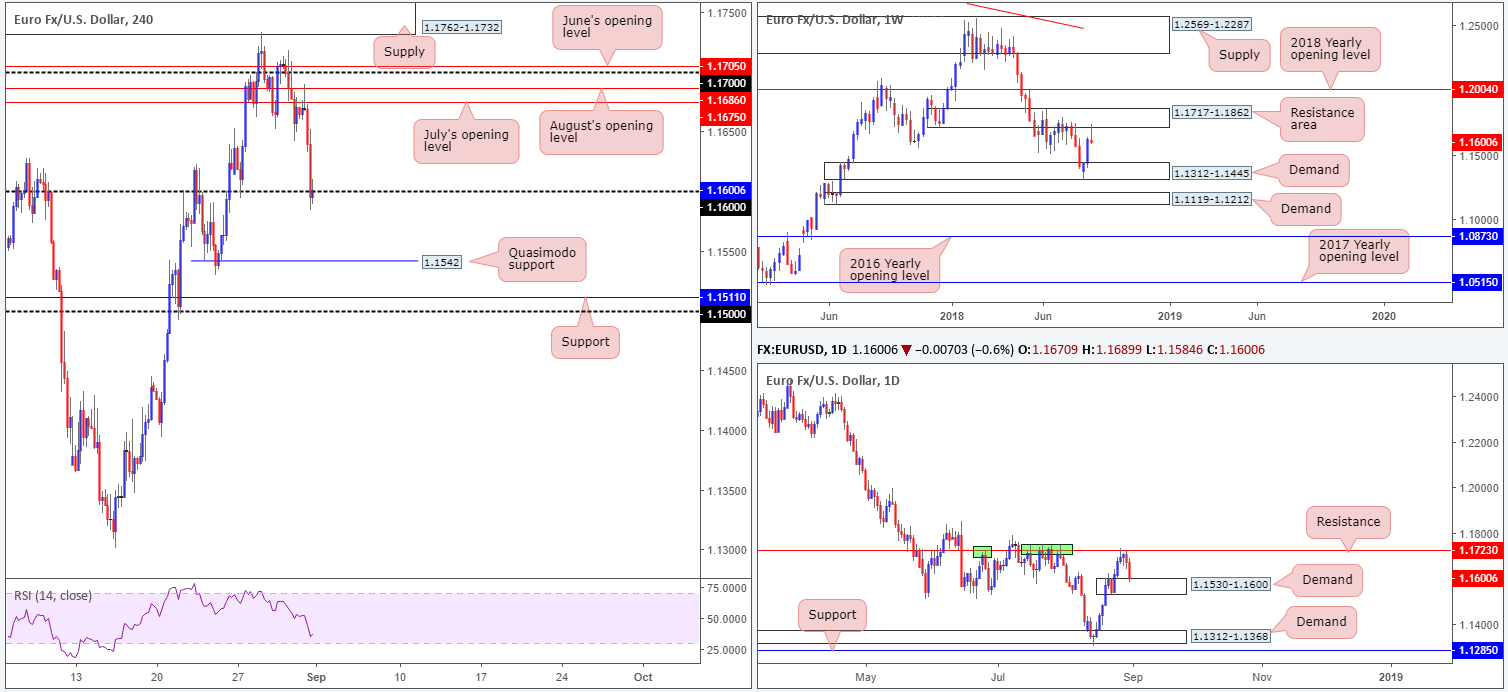
By way of a tasty-looking bearish pin-bar formation, the shared currency shook hands with the underside of a resistance area at 1.1717-1.1862 last week. This – coupled with room seen for the pair to stretch as far south as demand coming in at 1.1312-1.1445 – will likely draw in candlestick traders this week.
Daily perspective:
Daily demand at 1.1530-1.1600, as you can see, elbowed its way into the spotlight on Friday, following a selloff from nearby resistance plotted at 1.1732 (positioned within the lower limits of the aforementioned weekly resistance area). Outside of this demand, the next area of interest can be seen around demand penciled in at 1.1312-1.1368.
H4 perspective:
As is evident from the H4 timeframe, the value of the euro weakened in aggressive fashion on Friday. Weighed down by softer-than-expected Eurozone CPI figures and a pickup in USD demand on renewed US-China trade tensions, the EUR/USD concluded the week testing the 1.16 handle.
For those who read Friday’s morning briefing you may recall the team highlighted July’s opening level at 1.1675 as a possible sell zone, with stop-loss orders tucked above June’s opening level at 1.1705. Well done to any of our readers who managed to take advantage of this move!
Areas of consideration:
Having seen the H4 candles momentarily surpass the 1.16 handle to lows of 1.1584 on Friday, stop-loss orders were likely triggered, potentially setting the stage for a move towards the nearby H4 Quasimodo support at 1.1542. The only problem here is the higher timeframes! Weekly price suggests further selling could be on the cards, whereas daily price recently connected with the top edge of a demand area.
Should 1.16 emphasize resistance qualities today – by that we mean the H4 candles remain defensive beneath this number in the shape of a full or near-full-bodied formation – the odds of price reaching the H4 Quasimodo support level at 1.1542 are high, despite the current daily demand. Once, or indeed if, we connect with 1.1542, however, the tables may swiftly turn as this level is a fresh support that is positioned within the lower limits of a daily demand. Sellers from 1.16 will need to take this into account concerning trade management.
Today’s data points: German Buba President Weidmann speaks; US banks are closed in observance of Labor Day.
GBP/USD:
Weekly Gain/Loss: +0.82%
Weekly Close: 1.2950
Weekly perspective:
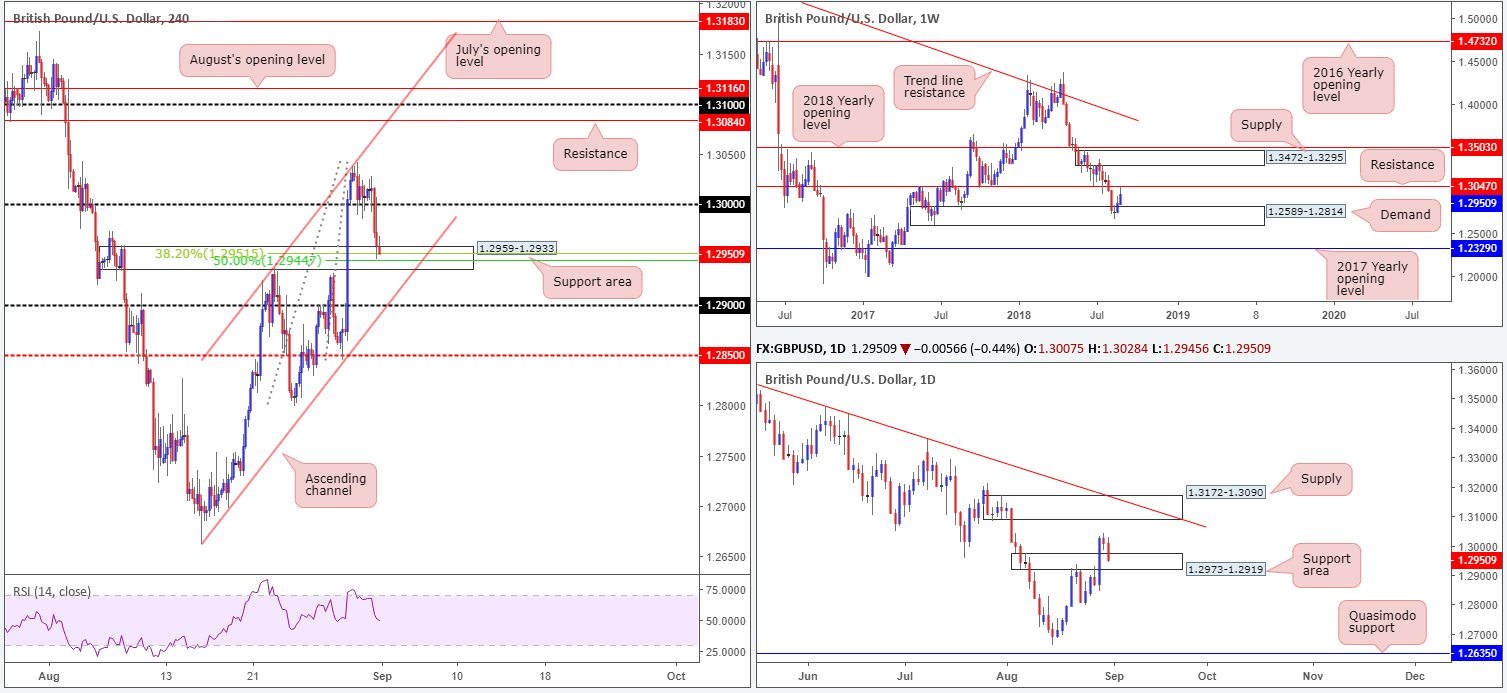
Over the course of last week’s trade the British pound penciled in its second consecutive weekly gain out of demand coming in at 1.2589-1.2814, reaching highs of 1.3042. Although reasonably impressive, traders may want to take into account the pair came within striking distance of a key resistance at 1.3047.
Daily perspective:
Wednesday’s session witnessed a strong round of GBP buying, consequently consuming supply marked at 1.2973-1.2919. As you can see, though, price action failed to generate much follow-through buying from here and resulted in price retesting the recently broken supply as support on Friday in the shape of a near-full-bodied bearish candle.
H4 perspective:
Unable to sustain gains above the key figure 1.30, sterling headed lower on Friday and tested a nearby support area at 1.2959-1.2933 into the close. Positioned within the walls of the aforementioned daily support area, and housing a 38.2% Fib support at 1.2951 and a 50.0% support at 1.2944, this area is likely of interest to many traders today. Despite this, there are two cautionary points to consider:
- Where we’re coming from on the weekly timeframe: weekly resistance at 1.3047 (while the level was not tested to the pip it should still be of concern for buyers).
- Further adding to this, the H4 candles are seen entrenched within an ascending channel formation at the moment (1.2661/1.2924), which means a move lower to test channel support could be observed.
Areas of consideration:
On the one hand, we have weekly price informing us of a possible move lower, whereas on the other hand, both daily and H4 structures show strong support. In situations such as this, it’s always tricky. Irrespective of which direction one selects, opposing structure is seen.
This does not mean traders should ignore the current H4 support area, or the 1.29 handle (converges with H4 channel support) seen below it for possible longs today/early this week. It just means to tread carefully and consider waiting for additional candle confirmation before pulling the trigger. That way, at least one is able to see if buyer intent exists.
Today’s data points: UK manufacturing PMI; US banks are closed in observance of Labor Day.
AUD/USD:
Weekly Gain/Loss: -1.83%
Weekly Close: 0.7189
Weekly perspective:
The Australian dollar suffered a nasty decline during the course of last week, down 134 pips against its US counterpart. Leaving resistance at 0.7371 unchallenged, the commodity currency engulfed the 2016 yearly opening level at 0.7282 and tested the 2017 yearly opening level at 0.7199, which, as you can see, is shadowed closely by a double-bottom support formation at 0.7163.
Daily perspective:
Looking at this market from the daily timeframe, upside was clearly capped by a resistance level coming in at 0.7365 on Tuesday. It was from here, the bearish onslaught began! The week ended with price entering demand at 0.7179-0.7216, and marginally engulfing the lower edge of this zone by a couple of pips. Beyond this area, traders likely have their crosshairs fixed on the aforementioned weekly double-bottom support.
H4 perspective:
Renewed US-China trade tensions along with strong USD demand dented market sentiment amid Friday’s trade.
The AUD/USD remained heavily offered, with the H4 candles seen crossing below 0.72 territory to fresh 2018 lows of 0.7175. Traders who ignore the higher timeframes will likely be eyeing the underside of 0.72 as a possible platform for shorts today. While this could work out, you would effectively be selling into possible higher-timeframe buyers here.
Areas of consideration:
In light of where we are currently positioned on the bigger picture right now, shorting 0.72 is not something we would label a high-probability move. Instead, focus is drawn to the weekly double-bottom support at 0.7163 for a possible long this week, targeting 0.72 as the initial take-profit level. Note this weekly level is positioned a few pips beneath daily demand at 0.7179-0.7216 – an excellent location for pro money to buy into liquidity from the stop-loss orders taken from those who are long the demand and traders looking to sell the breakout (remember a stop-loss order to a buyer is a sell order once triggered).
For those interested in buying 0.7163 this week, traders are urged to consider waiting for additional candlestick confirmation to form before pulling the trigger. That way one can be reasonably sure buyer intent exists here.
Today’s data points: Australian retail sales m/m; Australian company operating profits q/q; US banks are closed in observance of Labor Day.

USD/JPY:
Weekly Gain/Loss: -0.16%
Weekly Close: 111.04
Weekly perspective:
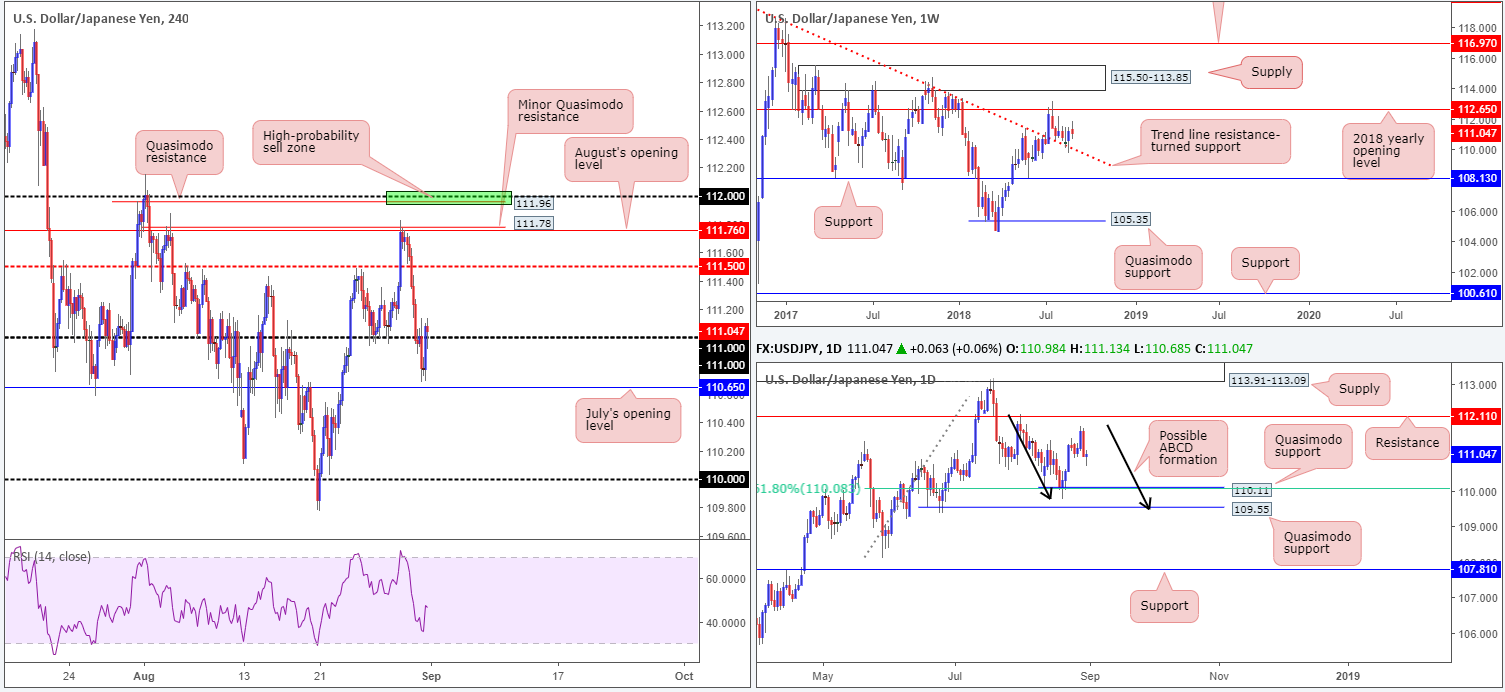
Weekly movement, as you can see, strongly retested a trend line resistance-turned support (taken from the high 123.57) two weeks back, though failed to generate much upside presence last week. Having seen this line hold firm as resistance on a number of occasions in the past, however, it’s likely to remain a defensive barrier going forward. Further buying from current price has the 2018 yearly opening level at 112.65 to target.
Daily perspective:
Structure on the daily timeframe to be cognizant of this week falls in at a resistance level drawn from 112.11, and two layers of Quasimodo support: 109.55 and 110.11. Note 110.11 converges with a 61.8% Fib support value at 110.08, and 109.55 fuses with a possible ABCD completion point around 109.49 (black arrows).
H4 perspective:
A quick recap of Friday’s trade on the H4 timeframe shows the 111 handle gave way during the early hours of London, though was swiftly reclaimed amid US hours after a modest recovery was observed just north of July’s opening level at 110.65. Assuming traders remain bullish above 111 today, the mid-level resistance at 111.50 is likely the next base on the hit list.
Areas of consideration:
For those who favor break/retest plays around psychological levels, buying off 111 could be an option today, targeting 111.50 as the initial upside target.
August’s opening level at 111.76 seen on the H4 timeframe is likely of interest to traders this week for potential shorts, given it fuses with a minor H4 Quasimodo resistance at 111.78.
What’s also attractive for shorts, and possibly the higher-probability setup, is the H4 Quasimodo resistance seen at 111.96. Aside from this level merging closely with the 112 handle, the apex (112.15) of the Quasimodo formation is bolstered by the daily resistance level mentioned above at 112.11 (stop-loss orders, therefore, can be positioned above the Quasimodo apex at around 112.17ish).
Today’s data points: US banks are closed in observance of Labor Day; BoJ Gov. Kuroda speaks.
USD/CAD:
Weekly Gain/Loss: +0.12%
Weekly Close: 1.3041
Weekly perspective:
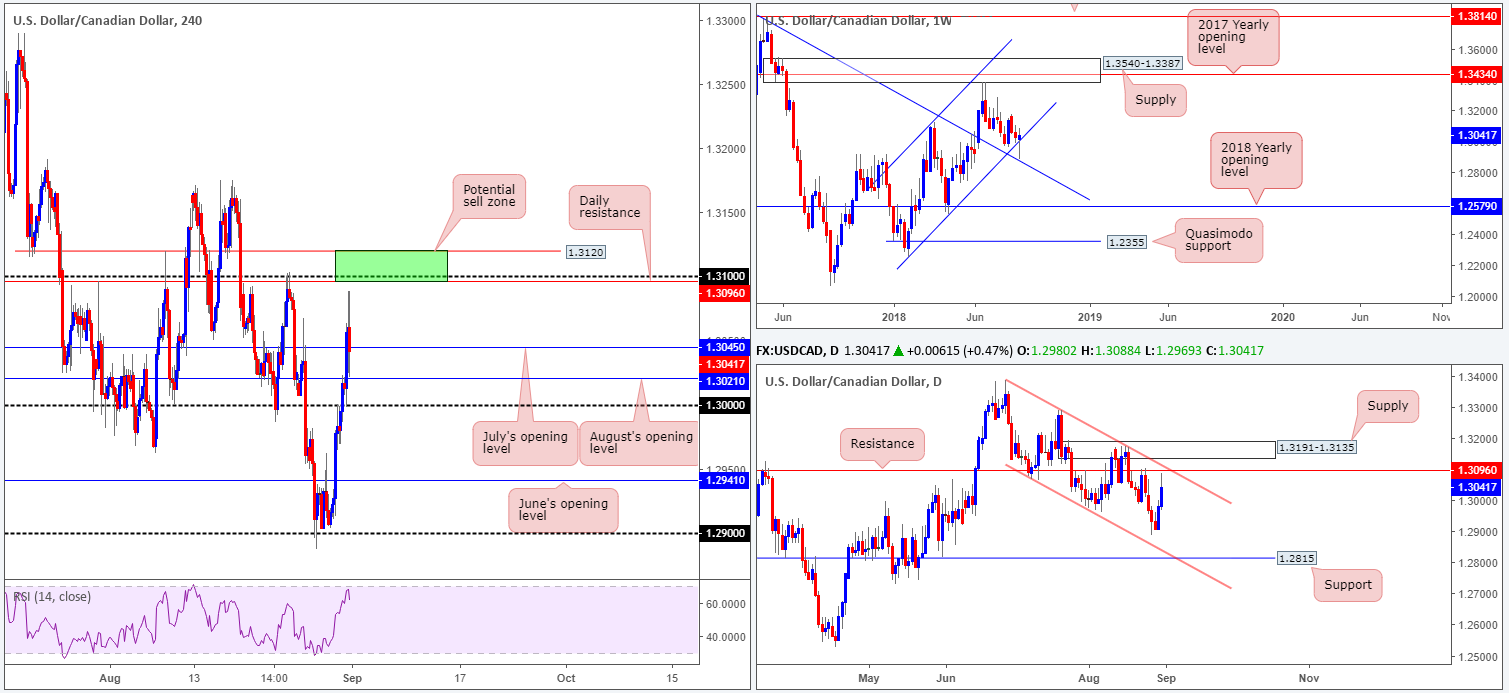
Since the beginning of the year, the USD/CAD has been compressing within an ascending channel formation (1.2247/1.3098). It was only last week traders witnessed a notable breach to the lower edge of this channel, breaking to lows of 1.2887. Thanks to a strong recovery just ahead of a nearby trend line resistance-turned support (etched from the high 1.4689), however, the channel remains intact.
Daily perspective:
Since late June, the daily candles have been grinding lower within a descending channel formation (1.3386/1.3066). Resistance at 1.3096, as is shown on the chart, came within a few pips of being brought into the mix on Friday. This level is particularly interesting given it fuses closely with the channel resistance. An additional level worth keeping an eye on this week is also the support level seen at 1.2815, owing to it uniting with channel support.
H4 perspective:
Friday’s action witnessed the USD/CAD extend gains on NAFTA talks and broad-based USD strength. While a number of technical resistances were penetrated, the unit mildly pared gains ahead of the 1.31 handle, which, as you can probably see, is positioned nearby the daily resistance level mentioned above at 1.3096.
Downside supports on the H4 scale rest at July’s opening level at 1.3045, followed closely by August’s opening level at 1.3021 and the key figure 1.30.
Areas of consideration:
Longer term, this market is clearly at a crossroads. Weekly price portends possible buying this week, while daily price is seen nearing the underside of a resistance level/channel resistance.
Despite this, the 1.3120/1.3096 area marked in green on the H4 timeframe is an interesting zone for potential shorts (comprised of a H4 resistance level at 1.3120, the 1.31 handle and daily resistance at 1.3096). Although this area holds attractive confluence, nevertheless, traders still need to prepare for the possibility of a break above this zone, given where we’re coming from on the weekly timeframe.
Today’s data points: Both US and Canadian banks are closed in observance of Labor Day.
USD/CHF:
Weekly Gain/Loss: -1.47%
Weekly Close: 0.9685
Weekly perspective:
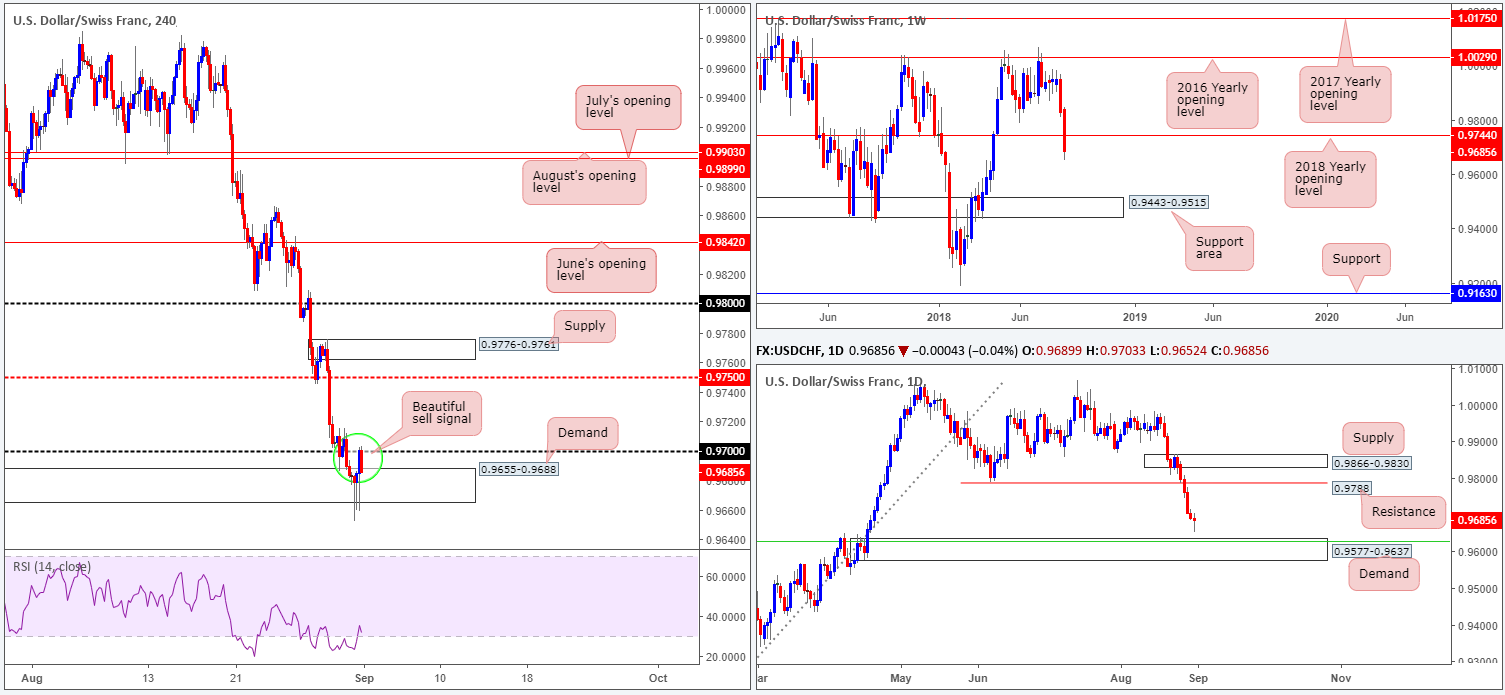
The US dollar sustained further losses against its Swiss counterpart last week, consequently pulling the pair beneath the 2018 yearly opening level at 0.9744. In view of last week’s decisive close, this market could be in for additional selling in the near future, targeting as far south as the support area coming in at 0.9443-0.9515. Before further selling is seen, though, traders need to be prepared for the possibility of a retest play off the recently broken 2018 yearly level as resistance.
Daily perspective:
Before weekly price can drag the unit lower, traders will need to contend with a tasty-looking daily demand at 0.9577-0.9637, which happens to converge with a 50.0% support value at 0.9627 (green line –taken from the low 0.9187). Given the strong momentum produced from this demand area’s base, the odds of a reaction being observed from here is high!
H4 perspective:
For the first time since April, the USD/CHF edged below the 0.97 handle on Thursday. Demand seen nearby at 0.9655-0.9688 was almost immediately brought into the mix, though failed to offer much in the way of support as the lower edge of this area was taken out amid the early hours of London on Friday.
Areas of consideration:
From a technical standpoint, both weekly and daily timeframes suggest selling may be the path to take. With that being the case, shorts around the underside of 0.97, targeting the top edge of daily demand at 0.9637, could be something to consider. In fact, Friday’s H4 closing candle ended the week in the shape of a nice-looking sell signal: a near-full-bodied bearish formation (stops can be positioned above the candle’s wick). Yes, we know price remains within H4 demand at the moment, but with overhead pressure potentially coming in from the higher timeframes along with the lower edge of the H4 base recently being taken, this H4 zone is likely to break today/tomorrow.
Today’s data points: US banks are closed in observance of Labor Day.
Dow Jones Industrial Average:
Weekly Gain/Loss: +0.91%
Weekly Close: 26034
Weekly perspective:
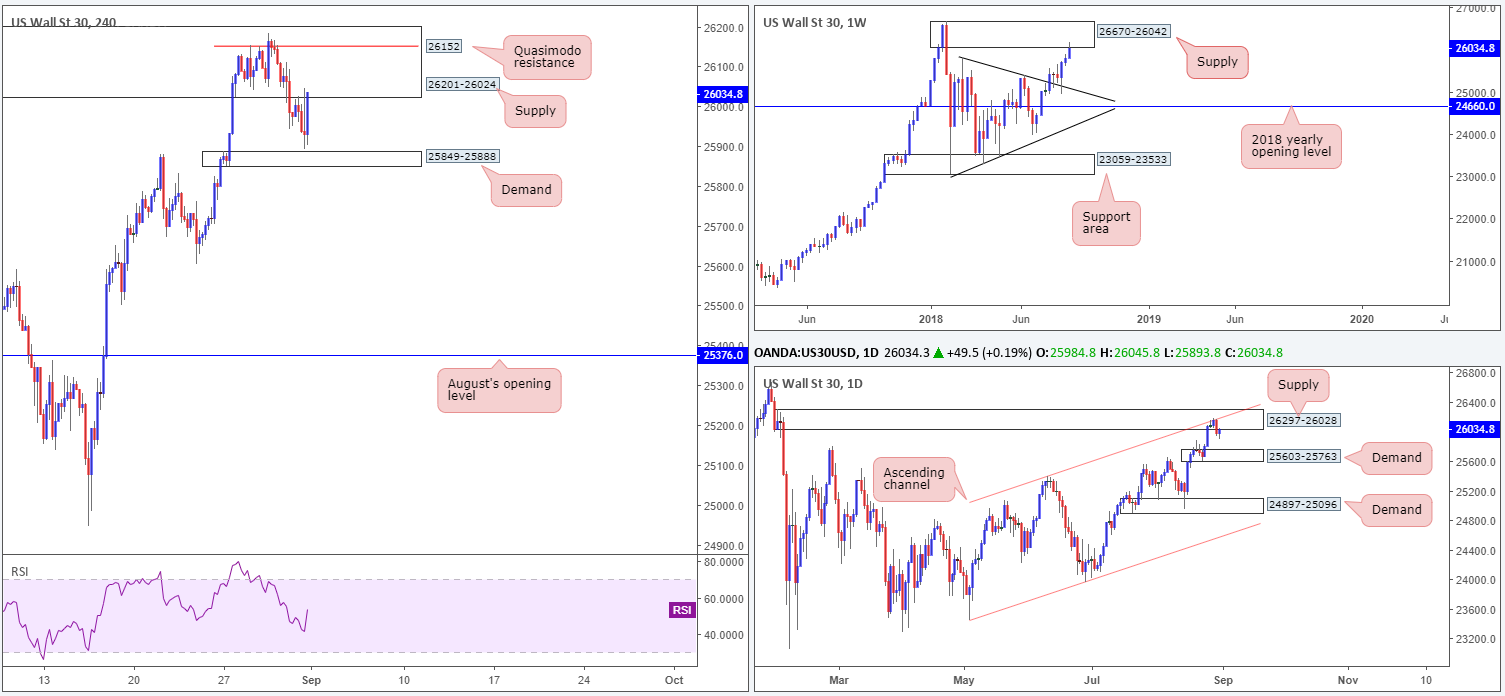
Although the DJIA registered its third consecutive weekly gain last week, traders may have noticed price recently engaged with the lower edge of a supply at 26670-26042, following a strong retest off a trend line resistance-turned support (etched from the high 25807) a few weeks back.
Daily perspective:
In terms of the daily timeframe, strong supply at 26297-26028 remains in the fold. What gives this area credibility comes down to the following:
- Downside momentum drawn from the base is incredibly strong.
- The zone intersects with a daily channel resistance (taken from the high 25399).
- Glued to the underside of the aforesaid weekly supply area.
H4 perspective:
News that US President Donald Trump was preparing to go ahead with tariffs on an additional $200 billion worth of Chinese imports dampened risk sentiment in early trade on Friday, bringing the H4 candles to lows of 25893, just ahead of a fresh H4 demand base coming in at 25849-25888.
Areas of consideration:
Taking into account both weekly and daily structure exhibit strong supply, selling from within the H4 supply zone at 26201-26024 is an option today/this week. As the H4 supply is rather large, entering short from the H4 Quasimodo resistance level at 26152 seen within the area could be something to consider. This allows traders the option of positioning stops above the overall H4 supply (while keeping risk/reward in check), targeting the H4 demand area mentioned above at 25849-25888.
Today’s data points: US banks are closed in observance of Labor Day.
XAU/USD (Gold)
Weekly Gain/Loss: -0.29%
Weekly Close: 1201.4
Weekly perspective:
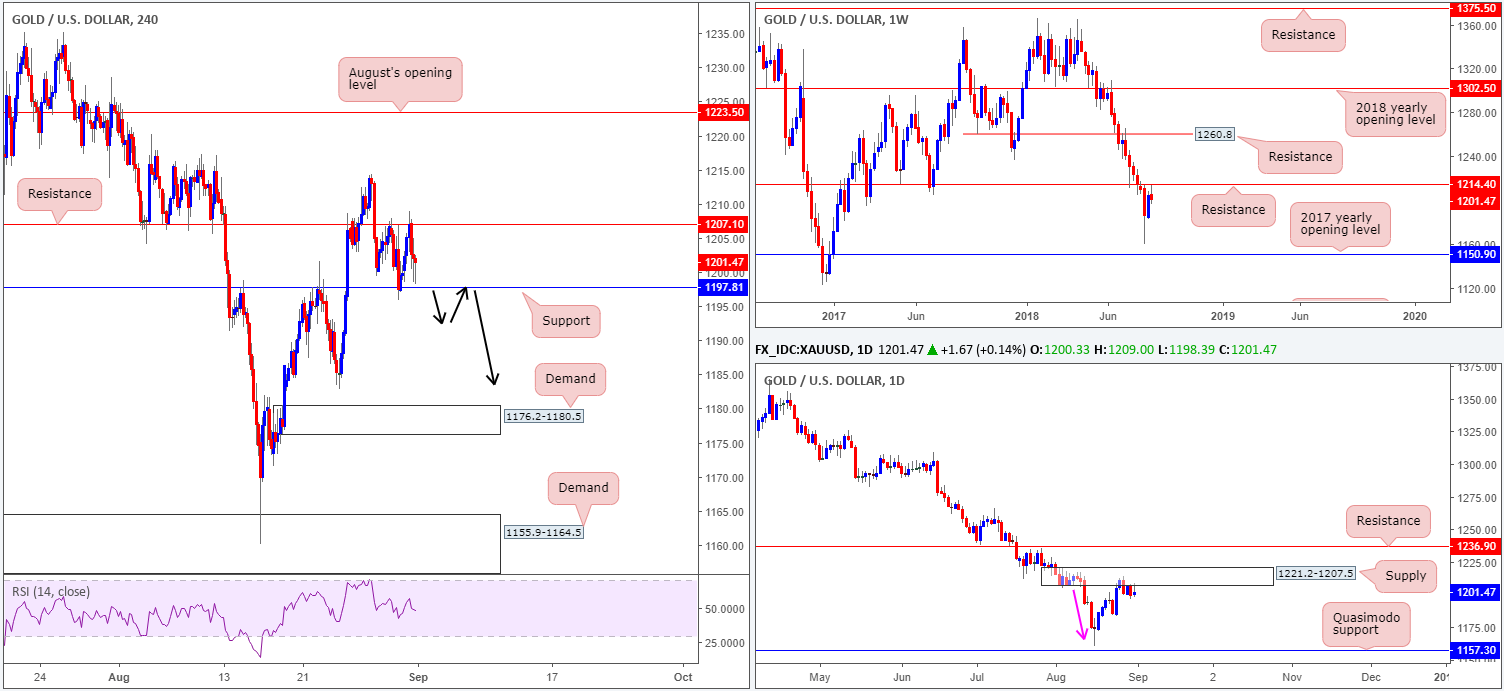
As can be seen from the weekly timeframe, price retested the underside of resistance at 1214.4 and sold off last week by way of a reasonably nice-looking bearish pin-bar formation. Further downside from this point could stretch as far south as the August 13 low 1160.3, followed closely by the 2017 yearly opening level at 1150.9.
Daily perspective:
In conjunction with weekly flow, daily movement also recently checked in with a nice-looking supply zone at 1221.2-1207.5. Aside from this zone displaying attractive downside momentum from its base (see pink arrow), it could be considered the ‘decision point’ to print 2018 yearly lows of 1160.3. Couple this with Friday’s bearish pin-bar formation off the underside of this base, we potentially have ourselves some very strong sellers in the mix.
H4 perspective:
Since Wednesday, the H4 candles have been carving out a range between resistance plotted at 1207.1 and a support level drawn from 1197.8. As we know this consolidation is forming at the base of a daily supply area, the chances of price breaking out of this range to the downside are high. Beyond the current H4 support level, traders likely have their crosshairs fixed on the August 24 low at 1182.9, followed closely by H4 demand at 1176.2-1180.5.
Areas of consideration:
To our way of seeing things, traders have themselves two options today/this week:
- Look to fade the top edge of the current H4 range: the H4 resistance level mentioned above at 1207.1, in the hope higher-timeframe sellers kick into gear and breakout of its range. To help pin down an entry and place stops, traders may want to consider entering on a bearish candlestick formation.
- Wait and see if H4 price breaks beneath the current H4 support level at 1197.8. A H4 close beneath this number, followed up with a retest in the shape of a full or near-full-bodied H4 bear candle would, technically speaking, likely be sufficient enough to consider shorts (black arrows), targeting August 24 low at 1182.9, followed closely by H4 demand at 1176.2-1180.5.
The use of the site is agreement that the site is for informational and educational purposes only and does not constitute advice in any form in the furtherance of any trade or trading decisions.
The accuracy, completeness and timeliness of the information contained on this site cannot be guaranteed. IC Markets does not warranty, guarantee or make any representations, or assume any liability with regard to financial results based on the use of the information in the site.
News, views, opinions, recommendations and other information obtained from sources outside of www.icmarkets.com.au, used in this site are believed to be reliable, but we cannot guarantee their accuracy or completeness. All such information is subject to change at any time without notice. IC Markets assumes no responsibility for the content of any linked site. The fact that such links may exist does not indicate approval or endorsement of any material contained on any linked site.
IC Markets is not liable for any harm caused by the transmission, through accessing the services or information on this site, of a computer virus, or other computer code or programming device that might be used to access, delete, damage, disable, disrupt or otherwise impede in any manner, the operation of the site or of any user’s software, hardware, data or property.


