
A note on lower timeframe confirming price action…
Waiting for lower timeframe confirmation is our main tool to confirm strength within higher timeframe zones, and has really been the key to our trading success. It takes a little time to understand the subtle nuances, however, as each trade is never the same, but once you master the rhythm so to speak, you will be saved from countless unnecessary losing trades. The following is a list of what we look for:
- A break/retest of supply or demand dependent on which way you’re trading.
- A trendline break/retest.
- Buying/selling tails/wicks – essentially we look for a cluster of very obvious spikes off of lower timeframe support and resistance levels within the higher timeframe zone.
- Candlestick patterns. We tend to only stick with pin bars and engulfing bars as these have proven to be the most effective.
We search for lower timeframe confirmation between the M15 and H1 timeframes, since most of our higher-timeframe areas begin with the H4. Stops are usually placed 5-10 pips beyond confirming structures.
EUR/USD:
Weekly gain/loss: + 11 pips
Weekly closing price: 1.1233
Weekly opening price: 1.1227
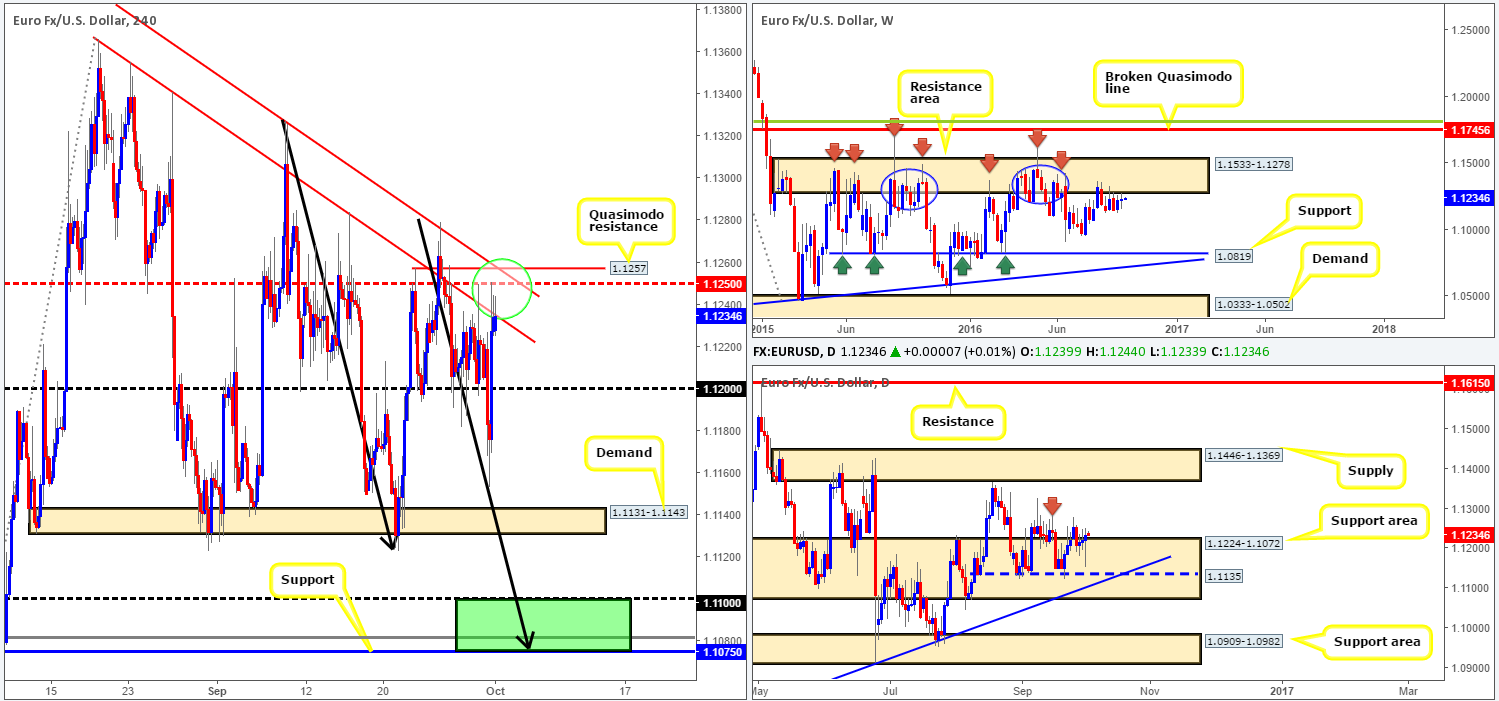
Weekly view: In spite of the shared currency ranging around 130 pips last week, the market closed relatively unchanged and as a result chalked up a clear-cut indecision candle. With this, we can see that price remains hugging the underside of a major resistance area seen at 1.1533-1.1278. While we’re confident that this zone will eventually force the pair lower, it’s difficult to judge when that will be as in the past we’ve seen price consolidate for long periods before plunging south (see blue circles). The next downside targets to have an eyeball on from this neighborhood can be seen at the 1.0970 region, followed closely by a major support seen at 1.0819.
Daily view: Looking at the daily chart, however, shows us that the major continues to hold ground within a support area seen at 1.1224-1.1072, more specifically, the 1.1135 support line which now represents a nice-looking triple- bottom formation. It goes without saying that buying from here into potential weekly sellers (see above) is never really good practice. Nevertheless, a decisive break above the September 15th high at 1.1284 (red arrow) could spark a round of buying up to the supply base coming in at 1.1446-1.1369.
H4 view: A quick recap of Friday’s sessions on the H4 timeframe shows that the EUR aggressively rebounded from lows of 1.1153 mid-ways through the London session. The pair climbed back above the 1.12 handle and tagged the mid-way resistance line at 1.1250 which capped upside going into the week’s close. Overall, we believe this move was triggered by a weaker dollar.
Direction for the week: By and large, we do feel that this market will decline in value. However, given the conflicting signals seen on the higher timeframes at the moment, it may be a while before we see this come to fruition.
Direction for today: We fail to see price breaching the H4 Quasimodo resistance line at 1.1257. Not only does this level boast a converging H4 trendline resistance (1.1366/1.1327) and H4 mid-way resistance 1.1250 (green circle), but the apex of this Quasimodo formation (1.1279) also spiked the underside of the aforementioned weekly resistance area! On the data front, nonetheless, do keep an eye on the US PMI which is set to be released at 2pm GMT.
Our suggestions: From our point of view, shorting the above said H4 Quasimodo formation is high probability. Targets for this setup can be seen at the 1.12 handle, the H4 demand at 1.1131-1.1143, finally followed by the H4 support at 1.1075 and the 1.11 region (green zone). As we mentioned in our previous weekly report, 1.1075/1.11 is not only a good take-profit area for any shorts in this market, it’s also a fantastic barrier to look for longs. It sits within the depths of the aforementioned daily support area, as well as converging with a deep H4 88.6% Fib support at 1.1081 and also a H4 AB=CD bull pattern completion point (taken from the high 1.1327). While this H4 buy zone will very likely bounce price, do keep in mind that by entering long from here you’re effectively buying into weekly flow. As a result, waiting for at least a H4 bullish close to form prior to pulling the trigger may be the better path to take.
Levels to watch/live orders:
- Buys: 1.1075/1.11 [H4 bullish close required] (Stop loss: beyond the trigger candle).
- Sells: 1.1256 [pending order] (Stop loss: 1.1281).
GBP/USD:
Weekly gain/loss: + 14 pips
Weekly closing price: 1.2971
Weekly opening price: 1.2915
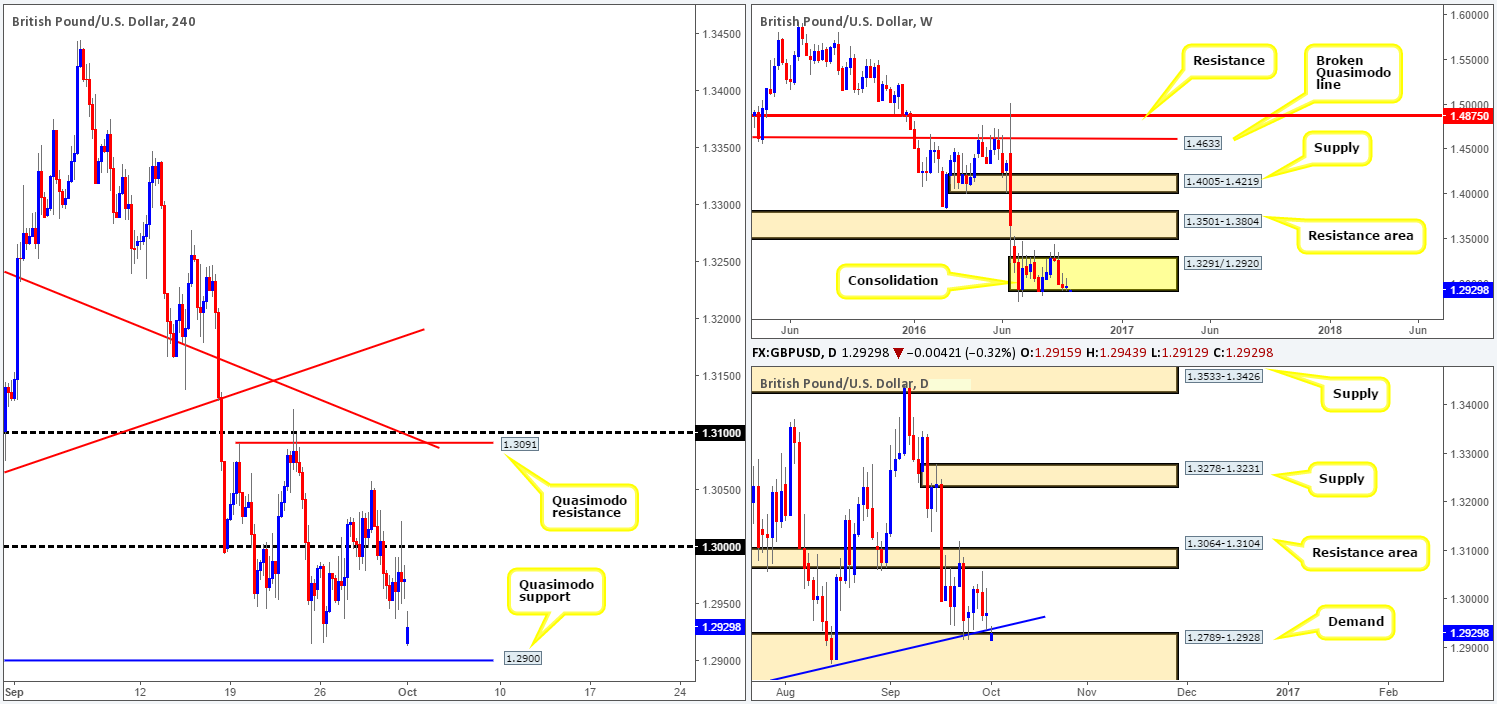
Weekly view: While the trend on cable is clearly pointing in a southerly direction right now, the buyers and sellers remain trading at the lower edge of a consolidation zone drawn from 1.2920. A decisive close below this limit would very likely see a continuation of this trend.
Daily view: The story on the daily chart also shows price trading in a phase of consolidation at the moment. To the upside, the unit is capped by a resistance area drawn from 1.3064-1.3104, while to the downside a rather large demand zone sits at 1.2789-1.2928, which happens to fuse nicely with a trendline support taken from the low 1.2789.
H4 view: Despite a string of better than expected UK data on Friday morning (GMT), the unit failed to close above the key figure 1.30, which could, given the rather bearish open seen this morning, portend further selling.
Direction for the week: All in all, it’s difficult to judge how this week will play out due to the conflicting signals seen on the higher timeframes right now. Although we feel the pair will eventually clock fresh lows, there’s a good chance that there will be some sort of correction seen from the current daily demand base.
Direction for today: The H4 Quasimodo level at 1.2900 will likely hold prices higher today. Building a case for entry here, we not only have the aforementioned daily demand supporting this level, but 1.2900 also represents a psychological boundary which a lot of traders will likely have their eye on. Just to be clear here though guys, we’re not expecting price to reverse from this H4 level, just bounce!
Our suggestions: If you find the above noted H4 Quasimodo resistance fits your trading plan, we would advise waiting for lower timeframe price action to confirm buying interest resides here before taking the plunge (see the top of this report for information on lower timeframe entry techniques). Furthermore, remain vigilant around 8.30am GMT today as UK manufacturing will be reporting how it fared the previous month.
Levels to watch/live orders:
- Buys: 1.2900 region [tentative – lower timeframe confirmation required] (Stop loss: dependent on where one confirms the area).
- Sells: Flat (Stop loss: N/A).
AUD/USD:
Weekly gain/loss: + 35 pips
Weekly closing price: 0.7655
Weekly opening price: 0.7652
(Trade update: closed the remaining 30% of our position at 0.7646).
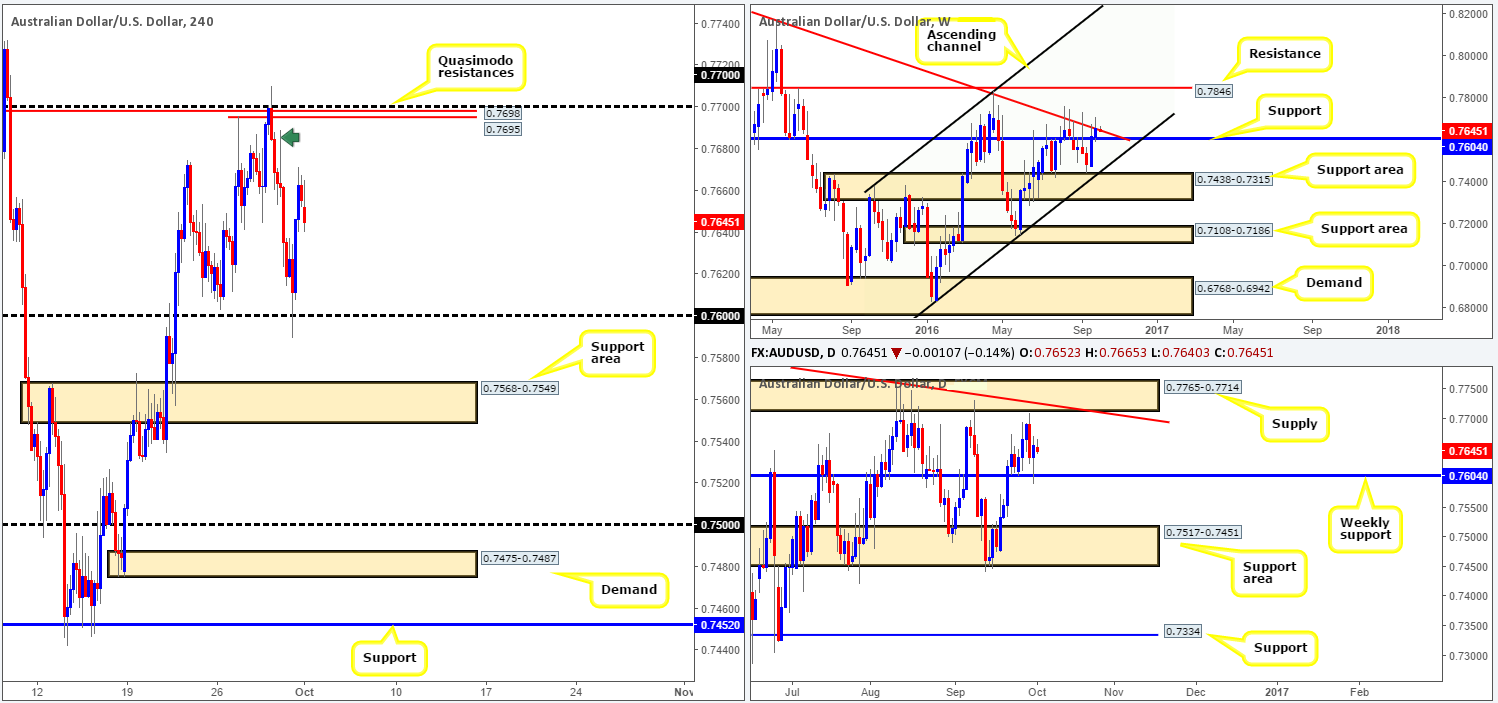
Weekly view: The AUD/USD market enjoyed another relatively successful week, forcing price to lock horns with the trendline resistance extended from the high 0.8295. As of this point, however, the pair is in a rather tricky spot, as offers will likely defend the above noted trendline resistance, but bids will also likely look to guard nearby support coming in at 0.7604.
Daily view: Friday’s rebound from the above said weekly support is certainly noteworthy. Be that as it may, our team is reluctant to become buyers on this scale with a supply zone lurking nearby at 0.7765-0.7714, which happens to merge with a trendline resistance taken from the high 0.7835.
H4 view: On the H4 chart, we can see that the commodity currency whipsawed below the 0.76 handle going into Friday’s London open. This, as you can see, sparked a round of buying in this market and ended the week touching highs of 0.7671.
Direction for the week: Similar to the EUR and GBP pairs above, anticipating weekly direction is tricky for now. Both higher-timeframe charts show somewhat restricted movement.
Direction for today: Levels we have our eye on today are the H4 Quasimodo resistances seen at 0.7698/0.7695. Not only do these lines converge with the 0.77 handle, but they also sit just ahead of the aforementioned daily supply area.
In addition to the above, the 0.76 handle is also on our radar today for the simple reason that this number also represents the weekly support level mentioned above at 0.7604.
Our suggestions: Put simply, keep a tab on the H4 levels noted above in bold. To be on the safe side though guys, we would recommend waiting for at least a H4 close to form before placing your hard-earned money on the line.
Levels to watch/live orders:
- Buys: 0.76 region [H4 bullish close required] (Stop loss: beyond the trigger candle).
- Sells: 0.7698/0.7695 [H4 bearish close required] (Stop loss: beyond the trigger candle).
USD/JPY:
Weekly gain/loss: + 29 pips
Weekly closing price: 101.27
Weekly opening price: 101.19
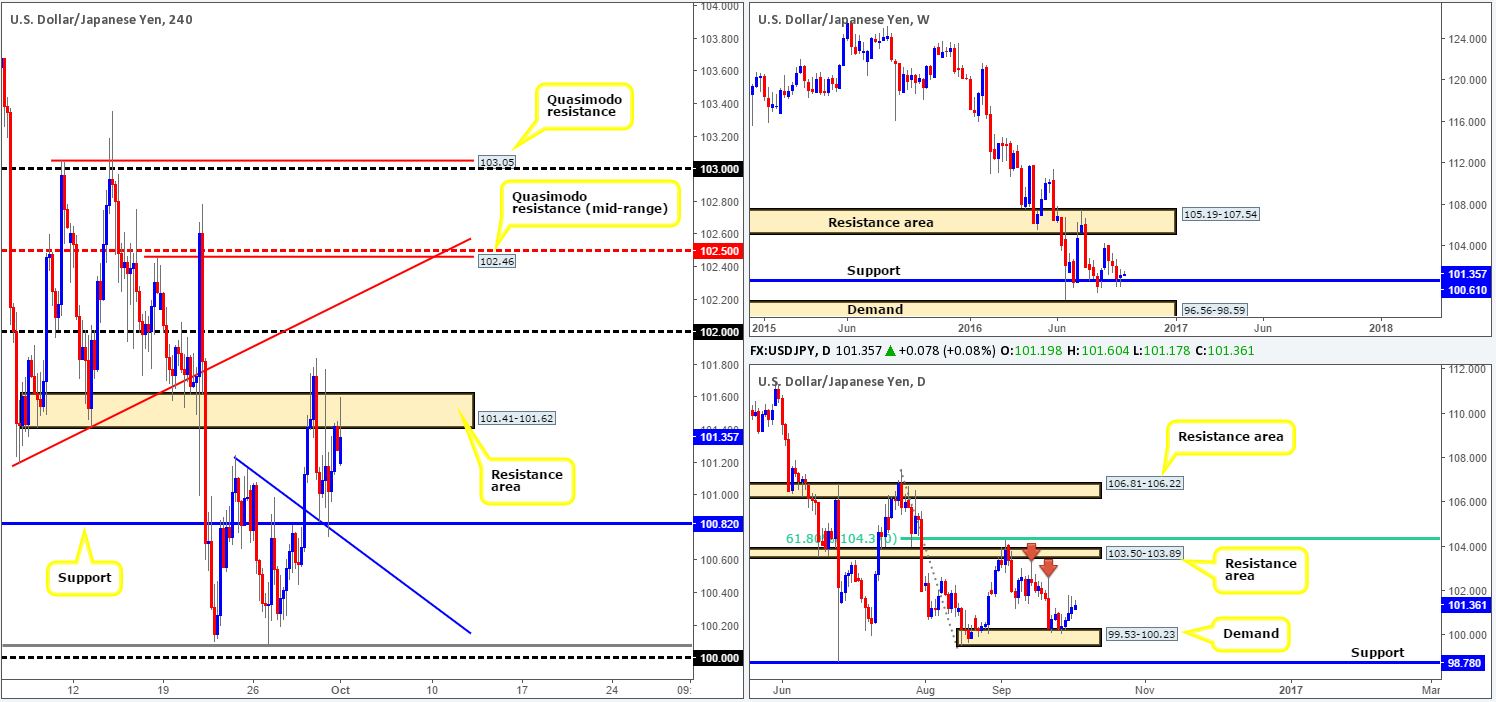
Weekly view: For the most part, the week ended relatively unchanged consequently printing a clear-cut indecision candle. Perhaps the most compelling factor here is that price did respect the support level at 100.61. Whether further buying is seen from here this week or not is difficult to judge given that the predominant trend is pointing south.
Daily view: Despite the selling wicks printed during Thursday and Friday’s sessions last week, price closed higher each time. This – coupled with very little seen stopping prices from reaching the resistance area coming in at 103.50-103.89, as well as there also being, what we believe to be, two supply consumption wicks seen marked with red arrows at 102.78 and 103.35, a move higher is likely.
H4 view: A brief look at recent dealings on the H4 chart shows price rotated from the support level at 100.82, and ended the week closing just ahead of a resistance area penciled in at 101.41-101.62. 101.82 was a noted support to watch for buys on Friday – well done to any of our readers who managed to take advantage of this move.
Direction for the week: Despite the weekly trend clearly pointing in a southerly direction right now, our team believes there is upside potential still left in this market to at least the daily resistance area mentioned above at 103.50-103.89.
Direction for today: A push above the current H4 resistance area will likely take place. This would, as you can probably see, likely clear the rubble north toward the 102 band, and with a little bit of effort, possibly the H4 trendline resistance taken from the low 101.19.
Our suggestions: Trading beyond the current H4 resistance zone, nonetheless, will be tricky since there is only 35 or so pips to play with before the first take-profit hurdle is achieved (102). Therefore, unless price retests the topside of this region and chalks up a lower timeframe buying signal (see the top of this report), allowing one to enter with a small stop loss, we would look to pass here. On top of this guys, US PMI data is set to hit the wire today at 2pm GMT, so do be prepared for some volatility during this time.
Levels to watch/live orders:
- Buys: Watch for a close above the H4 resistance area at 101.41-101.62 and look to trade any retest seen thereafter (lower timeframe confirmation required).
- Sells: Flat (Stop loss: N/A).
USD/CAD:
Weekly gain/loss: – 43 pips
Weekly closing price: 1.3122
Weekly opening price: 1.3120
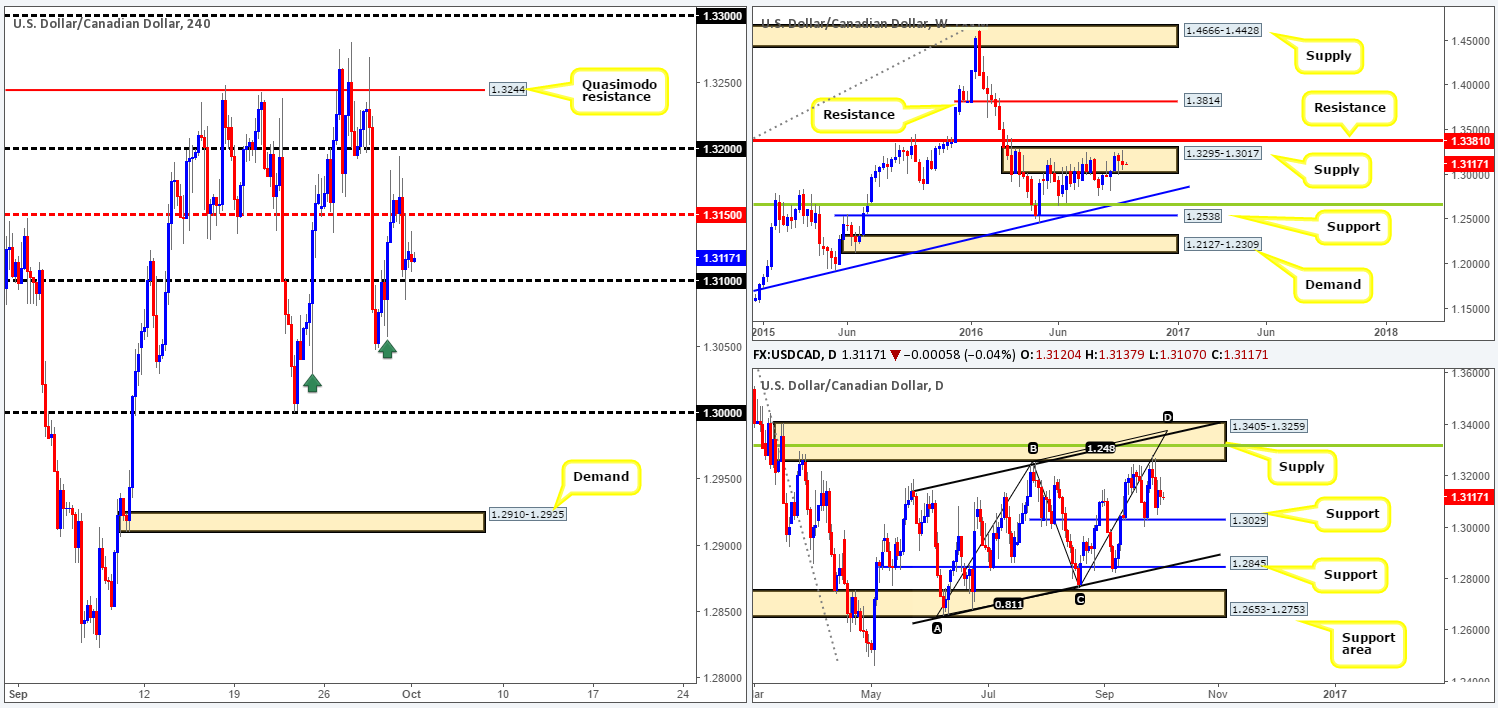
Weekly view: Although the pair sustained further losses last week from within the supply zone seen at 1.3295-1.3017, the sellers still appear to be somewhat sluggish. With that in mind, a break above the current supply area into nearby resistance seen at 1.3381 is something traders need to be prepared for. A downside move from the current supply area, however, could force price to connect with trendline support extended from the high 1.1278.
Daily view: From this angle, the USD/CAD is seen capped between a support level coming in at 1.3029 and a supply zone drawn from 1.3405-1.3259. Also worthy of consideration here is the daily convergence point located within this barrier: a 38.2% Fib resistance level at 1.3315 (green line), the weekly resistance level at 1.3381, a channel resistance taken from the high 1.3241 and an AB=CD completion point around the 1.3376ish range.
H4 view: Following Friday’s selloff from just ahead of the 1.32 handle, the pair slipped below the mid-way support 1.3150 and tagged in bids sitting around the 1.31 handle going into the close.
Direction for the week: Although the sellers are not really active within the current weekly supply zone at the moment, there is still a chance that price could tumble lower from here. To put it differently, we would not be comfortable buying this market right now.
Direction for today: 1.31 is key in our opinion. A break below this barrier could suggest further downside to the daily support at 1.3029/ key figure 1.30. The reason being is due to little active H4 demand seen between 1.31/1.30 (the green arrows represent what we believe to be H4 demand consumption tails [1.3057/1.3029]).
Our suggestions: Watch for a decisive close beyond 1.31 and look to trade any (lower timeframe) confirmed retest (see the top of this report) at the underside of this number, targeting between 1.3029: the daily support level and the 1.30 boundary.
Levels to watch/live orders
- Buys: Flat (Stop loss: N/A).
- Sells: Watch for price to close beyond 1.31 and look to trade any retest of this number seen thereafter (lower timeframe confirmation required).
USD/CHF:
Weekly gain/loss: + 14 pips
Weekly closing price: 0.9711
Weekly opening price: 0.9711
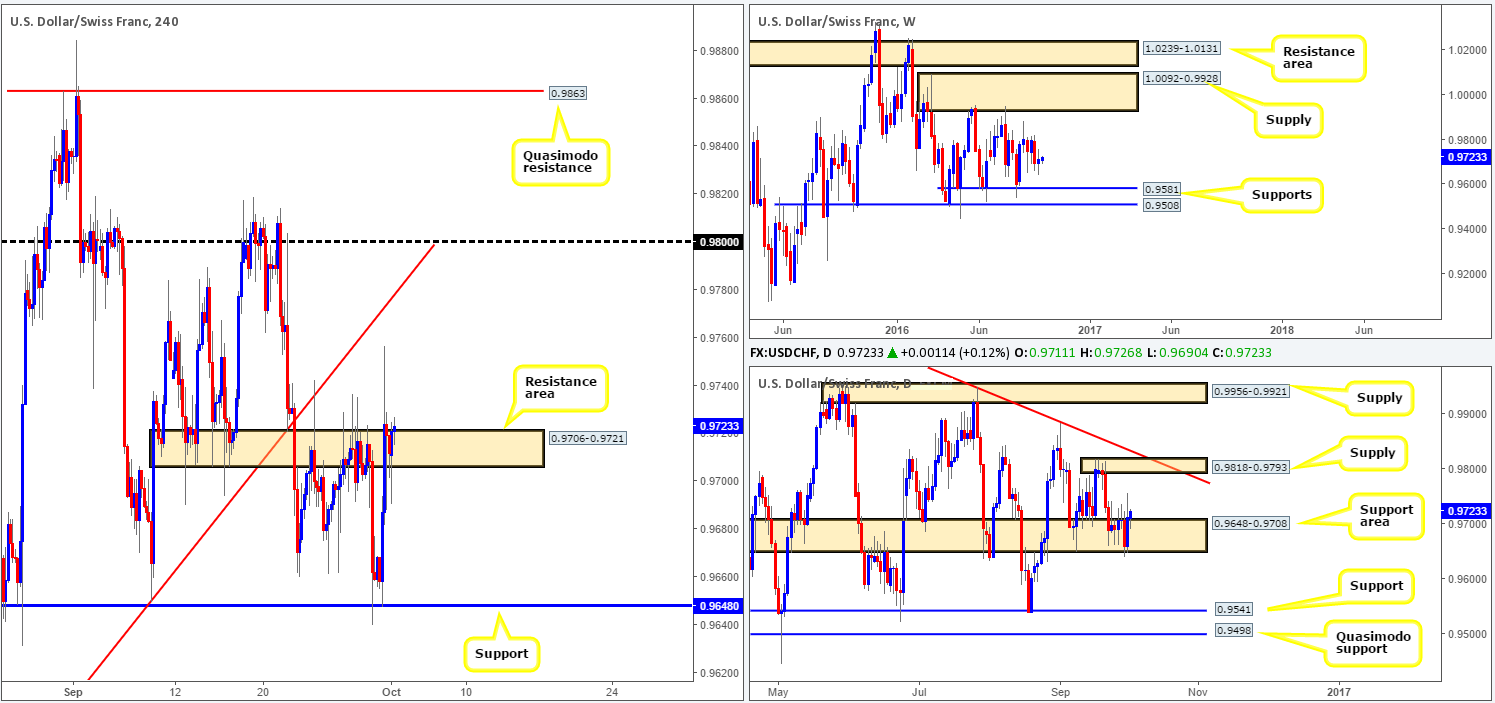
Weekly view: Since the beginning of May, the USD/CHF pair has been consolidating between a supply zone painted at 1.0092-0.9928 and a support band drawn from 0.9581. It’s unlikely that price will breach the walls of this range this week, so the best we can do on this timeframe is continue to keep a tab on the edges of this consolidation.
Daily view: Turning our attention to the daily chart, price is currently positioned within a support area carved from 0.9648-0.9708. In the event that the buyers fail to follow through here, nevertheless, the next barrier of interest beyond this zone can be seen at 0.9541: a support level. Meanwhile, a break to the upside from the current base could see prices challenge supply coming in at 0.9818-0.9793 (merges with a trendline resistance taken from the high 1.0256).
H4 view: During the course of Friday’s sessions, the Swissy aggressively punched through the resistance area coming in at 0.9706-0.9721, but, as you can see, failed to sustain gains beyond this point. For all that though, this morning’s action is currently seen retesting the top edge of this zone as we write.
Direction for the week: As the daily support area at 0.9648-0.9708 is faring well at the moment, we feel the pair will stretch north this week at least until we see the aforementioned daily supply come into play.
Direction for today: Assuming the H4 candles close above the current H4 resistance area, further buying is likely on the cards up to the H4 trendline extended from the low 0.9537/0.98 handle.
Our suggestions: For traders wishing to buy this market, we would advise waiting for price to take out the current H4 resistance area beforehand. Following a retest to the top edge of this barrier along with a H4 bullish close, our team would look to buy this market, targeting the aforementioned H4 levels highlighted in bold.
Levels to watch/live orders:
- Buys: Watch for a close above the H4 resistance area at 0.9706-0.9721 and look to trade any retest seen thereafter (a H4 bullish close following the retest would be a bonus).
- Sells: Flat (Stop loss: N/A).


