
EUR/USD:
Weekly Gain/Loss: -0.19%
Weekly Close: 1.1318
Weekly perspective:
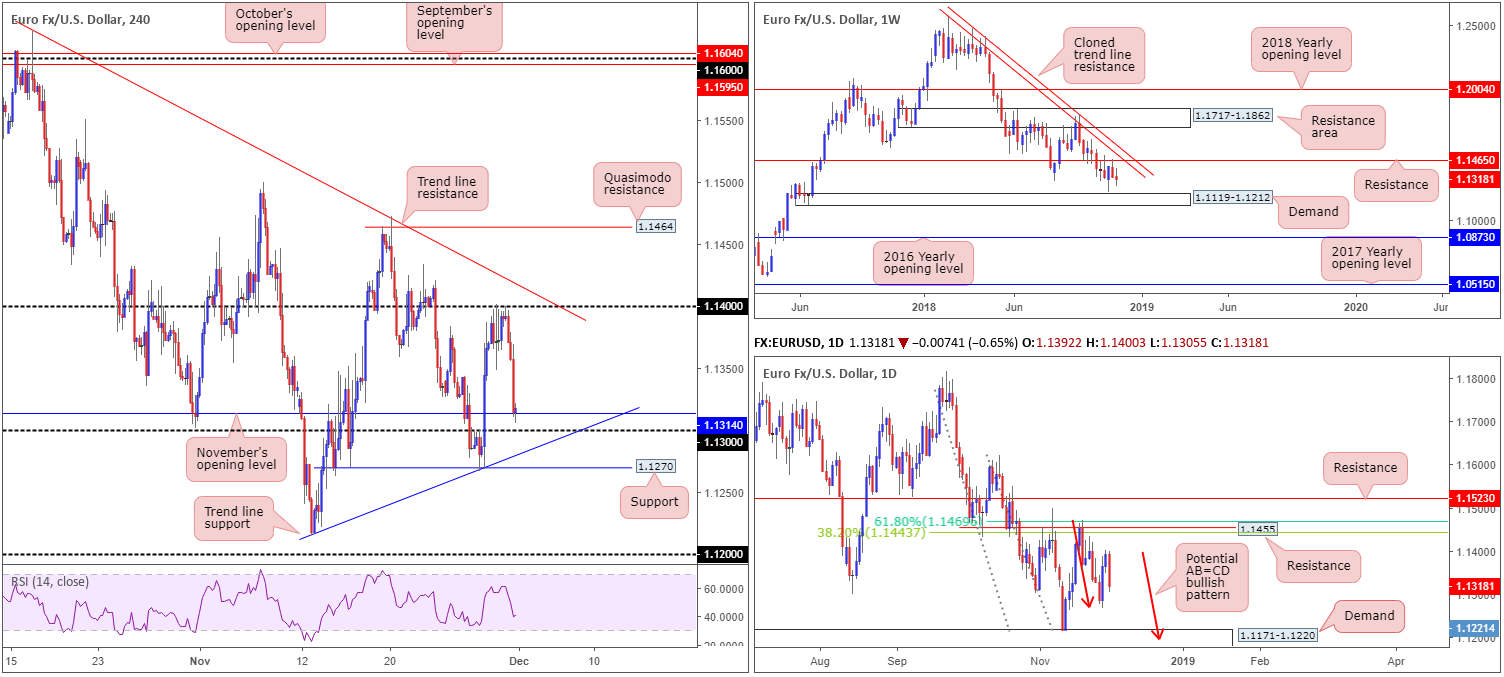
Despite the EUR/USD ranging in excess of 130 pips last week, the pair concluded trade by way of an indecision candle, albeit sporting a mild bearish tone. With respect to structure, traders’ crosshairs likely remain fixed on resistance priced in at 1.1465 (which, as you can probably see, brings with it a nearby cloned trend line resistance [extended from the high 1.2413]), and demand coming in at 1.1119-1.1212.
Daily perspective:
Closer attention adds the possibility of an AB=CD bullish pattern (red arrows) developing this week, terminating within the upper limits of a demand drawn from 1.1171-1.1220 (glued to the top edge of the aforementioned weekly demand). If it follows the pair turns northbound prior to completing the harmonic formation, however, traders are urged to pencil in resistance at 1.1455 that merges closely with two Fibonacci resistances: a 61.8% and a 38.2% at 1.1469 and 1.1443, respectively.
H4 perspective:
Reclaiming a large portion of recent gains, Friday’s movement witnessed the EUR/USD recede lower, down 0.65% on the day. The greenback gained traction at the closing stages of the week, following a hotter-than-expected Chicago PMI reading at 66.4. As is evident from the H4 chart, the major ended the week shaking hands with November’s opening level at 1.1314, positioned just north of the 1.13 handle. It may also be worth noting there’s a trend line support (etched from the low 1.1216) seen close by and support coming in from 1.1270.
Areas of consideration:
Between 1.1270/1.1314, the H4 chart promotes a number of supports, which could, of course, hold price action higher. The only caveat here is the fact both weekly and daily timeframes display room to explore ground beyond these H4 supports, with the next higher-timeframe support not emerging until we reach the top edge of the noted daily demand at 1.1171-1.1220. As a result of this, traders are urged to exercise caution around the noted H4 supports.
In the event our analysis proves to be correct and we print a H4 close under 1.1270, further selling towards daily demand is potentially on the table. A retest to the underside of 1.1270 in the shape of a bearish candlestick configuration (entry/stop parameters can be defined according to this pattern) would, according to the overall technical picture, be enough to justify an intraday sell sometime this week.
Today’s data points: FOMC Members Clarida, Quarles Williams and Brainard speak; US ISM Manufacturing PMI.
GBP/USD:
Weekly Gain/Loss: -0.58%
Weekly Close: 1.2748
Weekly perspective:
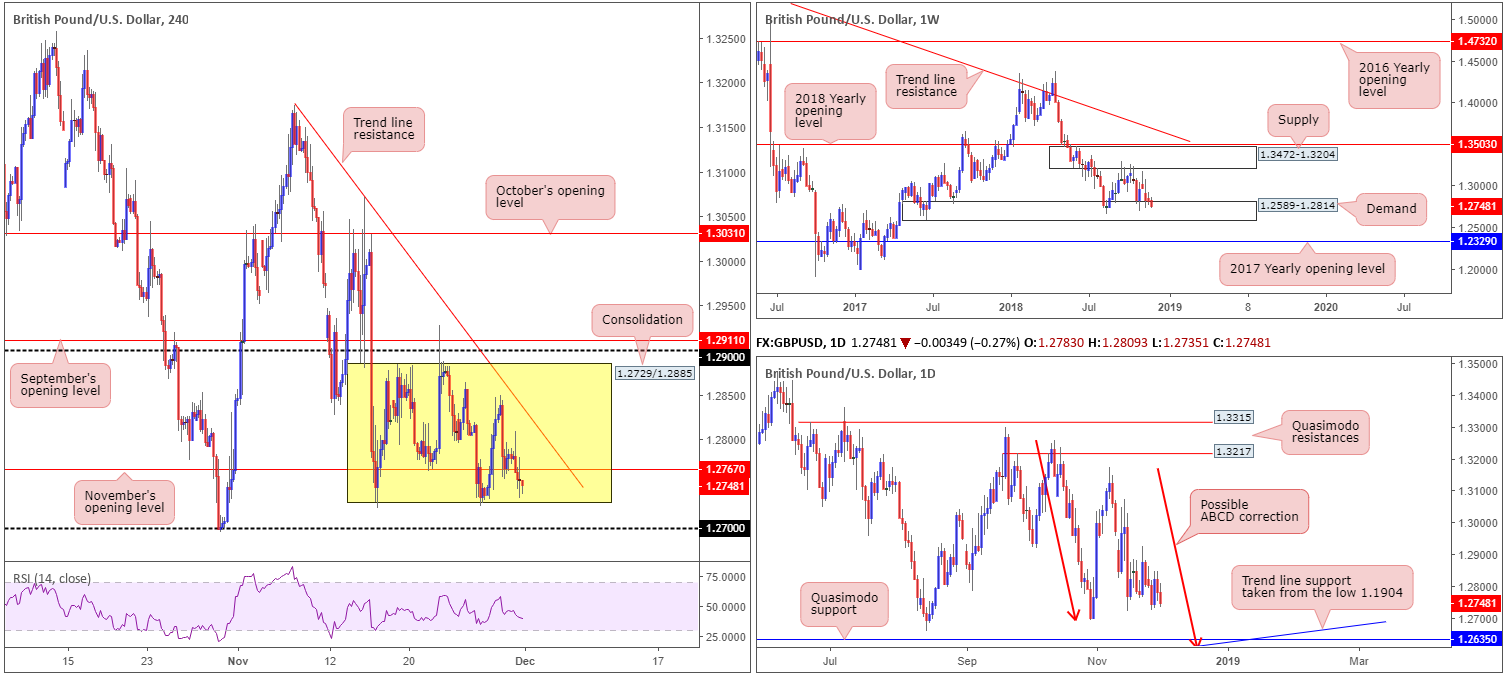
Demand at 1.2589-1.2814 remains in the spotlight as buyers and sellers battle for position. As of late, price action has failed to produce anything meaningful to the upside from the demand, consequently reflecting a bearish tone. Outside of the demand base, the 2017 yearly opening level at 1.2329 is seen as the next downside support target.
Daily perspective:
In conjunction with weekly movement, daily flow suggests the pair might want to explore lower ground within the walls of the said weekly demand area. The candles, as you can see, are hovering north of the 1.2695 Oct 30 low. While a response from this neighbourhood is certainly possible, the Quasimodo support seen at 1.2635 remains a far more appealing level. Aside from 1.2635 fusing with trend line support (taken from the low 1.1904), the approach, should we push for lower levels, will form by way of an ABCD bullish pattern (red arrows) terminating just south at 1.2614.
H4 perspective:
A quick recap of recent action on the H4 timeframe reveals the candles half-heartedly breached November’s opening level at 1.2767, exposing the lower edge of the current range at 1.2729 (yellow zone). Traders are also urged to pencil in the 1.27 handle, resting just south of this consolidation
Should buyers enter the market from the lower edge of the aforesaid range, not only will they have to contend with possible selling from the underside of November’s opening level, nearby trend line resistance (extended from the high 1.3174) is also a concern.
Areas of consideration:
Medium term, focus is on the lower edge of the current H4 consolidation at 1.2729, though buying this market from here is a challenge, not only because of the nearby H4 resistances mentioned above, traders also need to take into account the somewhat bearish stance seen on the higher timeframes at the moment.
Ultimately, we feel 1.27 will be consumed this week, leading to a move south towards the daily Quasimodo support mentioned above at 1.2635. A retest to the underside of 1.27 in the shape of a bearish candlestick configuration (entry/stop parameters can be defined according to this pattern) would, according to the overall technical picture, likely be enough to justify a sell sometime this week.
Today’s data points: UK Manufacturing PMI; MPC Member Haldane Speaks; FOMC Members Clarida, Quarles Williams and Brainard speak; US ISM Manufacturing PMI.
AUD/USD:
Weekly Gain/Loss: +1.12%
Weekly Close: 0.7308
Weekly perspective:
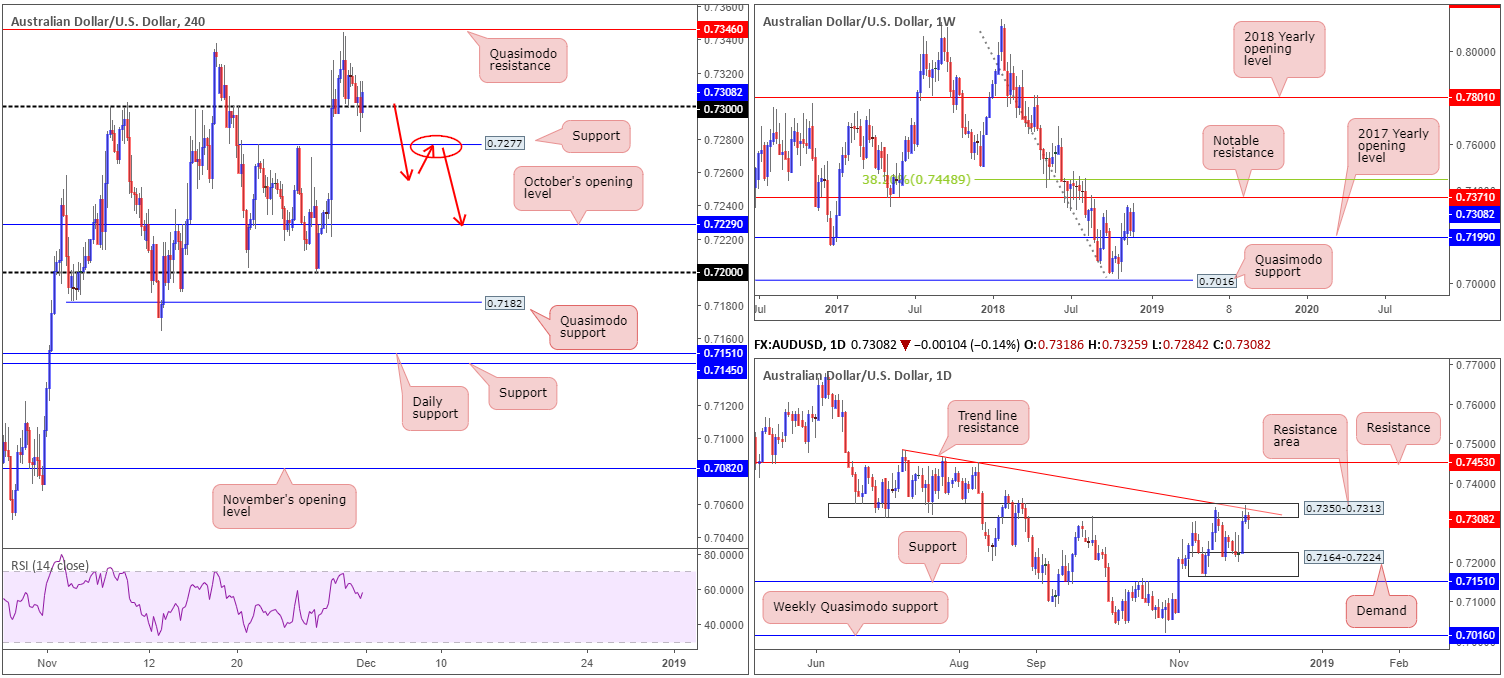
The Australian dollar chalked up healthy gains vs. its US peer last week, adding more than 80 pips in value. The commodity currency witnessed a resurgence of bidding take shape following a to-the-pip test of its 2017 yearly opening level at 0.7199. Continued buying from this neighbourhood may lead to a test of notable resistance priced in at 0.7371. This resistance has served as a critical level in this market for a number of years, and, therefore, commands attention.
Daily perspective:
Things start to become concerning for the bulls, however, once daily structure is taken into consideration. Recent buying brought the market into a resistance area at 0.7350-0.7313, which happens to converge with a nearby trend line resistance (drawn from the high 0.7483). The research team feels this area, although weekly price shows scope to possibly extend higher, is likely to continue hindering upside.
H4 perspective:
Friday’s action on the H4 timeframe was somewhat uneventful, as price attempted to press for lower ground under 0.73, though failed to breach lows of 0.7284. Despite the unit reclaiming 0.73+ status into the close, stop-loss orders beneath 0.73 have likely been tripped, consequently exposing nearby support at 0.7277.
Areas of consideration:
Should the H4 candles print a decisive close under 0.73, this, according to our technical studies, is a strong sign daily sellers are wanting to take things lower from here. H4 support, as highlighted above, rests nearby at 0.7277, though with overhead selling pressure from the daily timeframe, we expect this level to be taken out and price head in the direction of October’s opening level at 0.7229 (at this point the market would also be sited just north of daily demand at 0.7164-0.7224 – the next downside target on the daily scale).
For conservative traders interested in selling this market, you might want to consider waiting and seeing if the H4 candles consume 0.7277, and then attempt to enter short on any retest of the level as resistance (red arrows – preferably in the shape of a bearish candlestick formation as this will provide entry/stop parameters).
Today’s data points: FOMC Members Clarida, Quarles Williams and Brainard speak; US ISM Manufacturing PMI.
USD/JPY:
Weekly Gain/Loss: +0.49%
Weekly Close: 113.45
Weekly perspective:
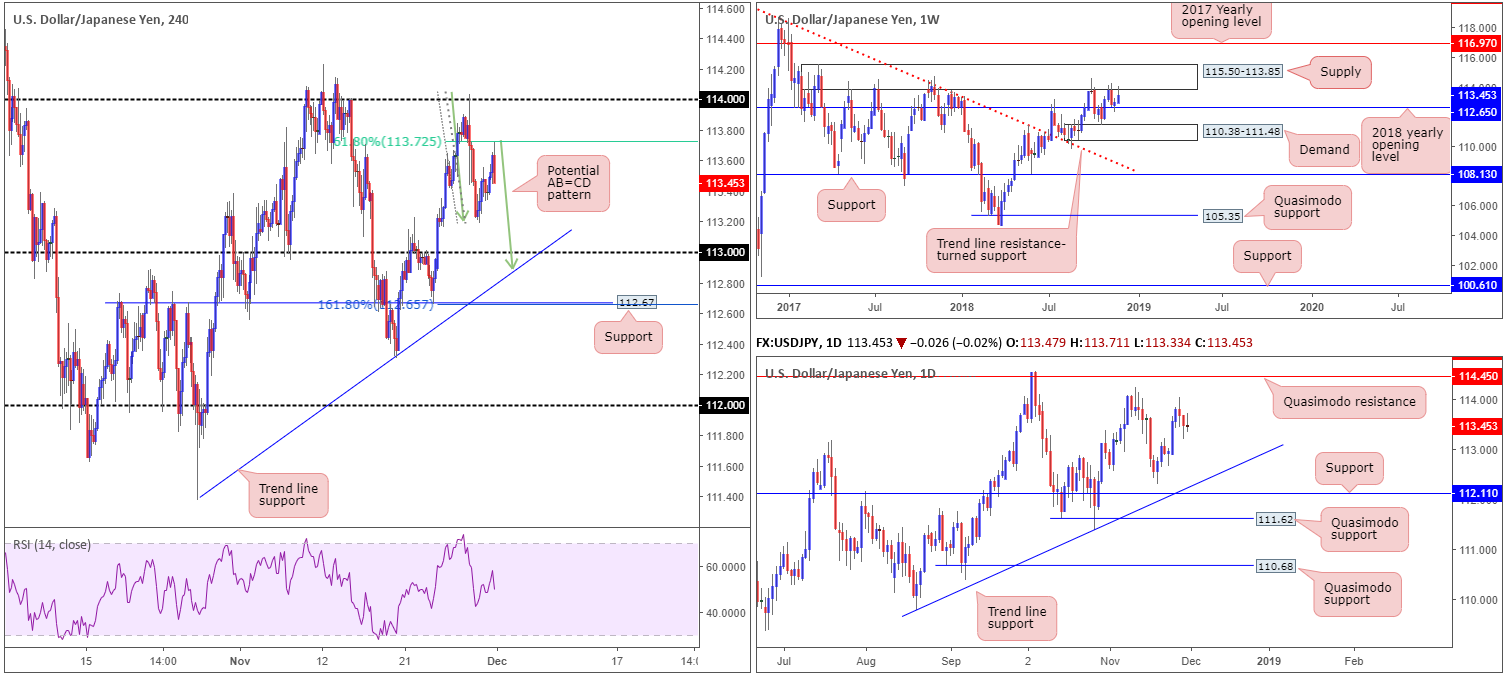
Over the past couple of weeks, the weekly candles have been capped between supply at 115.50-113.85 and the 2018 yearly opening level at 112.65. Beyond this level, traders likely have their crosshairs fixed on demand coming in at 110.38-111.48, whereas a break above the current supply has the 2017 yearly opening level to target at 116.97.
Daily perspective:
In terms of daily structure, areas worth keeping an eyeball on this week fall in at a trend line support (extended from the low 109.77), which merges closely with support drawn from 112.11. To the upside, the 114.23 Nov 12 high is likely next in line, shadowed closely by Quasimodo resistance priced in at 114.45.
H4 perspective:
Closer analysis draws attention to H4 price fading a 61.8% Fibonacci resistance value at 113.72 into the closing stages of the week. Thanks to this, the research team has noted a potential AB=CD (green arrows) bullish pattern that completes just south of 113 around trend line support (extended from the low 111.37).
Areas of consideration:
If the H4 candles continue pressing for lower ground this week and completes the aforementioned AB=CD bullish pattern, a bounce higher is likely on the cards to at least 113.20ish. Why only a bounce is simply because weekly price may pressure the unit towards its 2018 yearly opening level mentioned above at 112.65, which, as you can see, on the H4 timeframe merges closely with support at 112.67 and a 161.8% Fibonacci support. Longs from this level, therefore, are also of interest this week. Ideal entry comes in the form of a bullish candlestick signal as this not only provides buyer intent, it also serves as a way of defining entry/stop parameters. The next upside hurdle from 112.67, should the area be tested, falls in at 113.
Today’s data points: FOMC Members Clarida, Quarles Williams and Brainard speak; US ISM Manufacturing PMI.
USD/CAD:
Weekly Gain/Loss: +0.49%
Weekly Close: 1.3285
Weekly perspective:
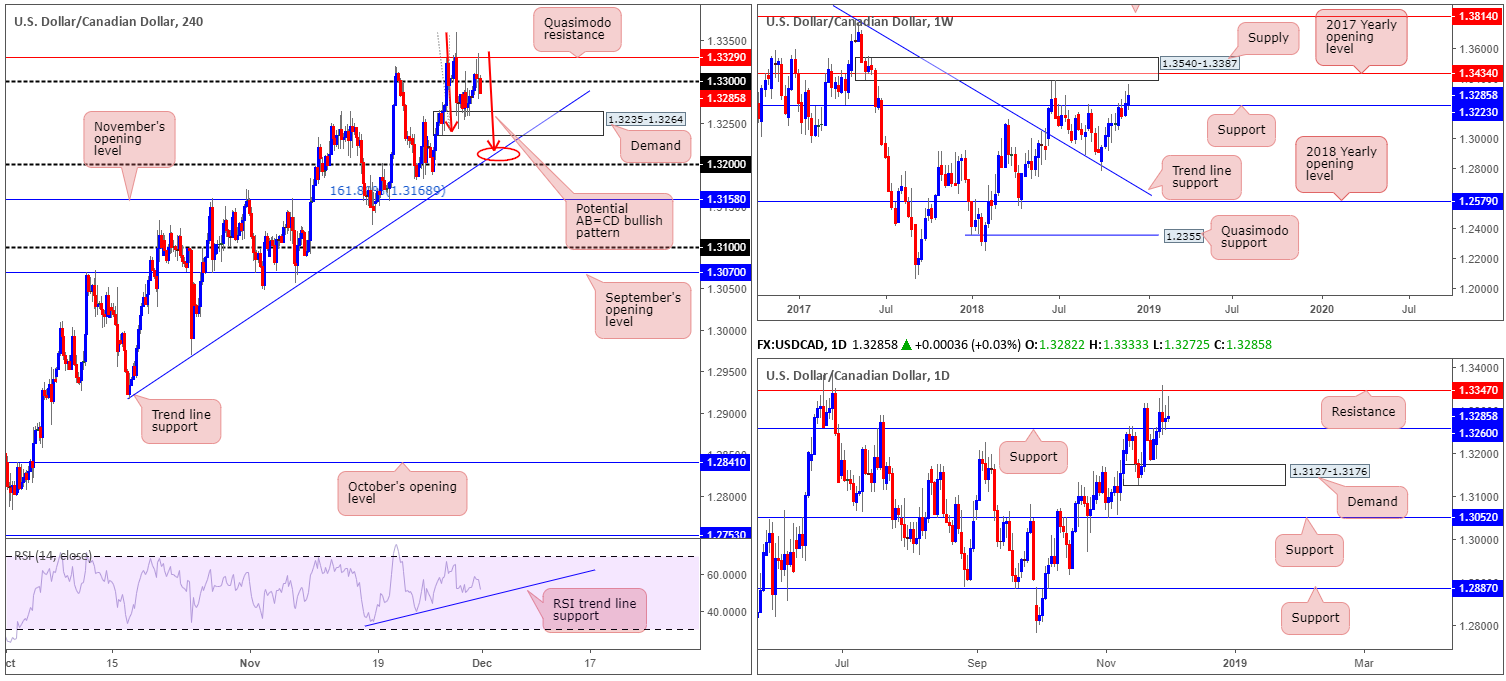
The USD/CAD enjoyed another successful session last week, increasing its value by more than 60 pips. Support at 1.3223 remains in the fold after being marginally overthrown the week prior as resistance. Continued buying from current price could lead to a test of nearby supply at 1.3540-1.3387 (houses the 2017 yearly opening level within at 1.3434).
Daily perspective:
In conjunction with weekly flow, we can also observe daily price respecting support carved from 1.3260. The concern here, nevertheless, is resistance is seen overhead at 1.3347 and the daily candles have printed little in terms of bullish intent over the past couple of days. In fact, Friday’s session concluded by way of a bearish pin-bar formation.
H4 perspective:
Disappointing Canadian growth figures immediately saw the USD/CAD explore higher ground, reaching highs of 1.3327 before swiftly returning to just north of pre-announcement levels. H4 Quasimodo resistance at 1.3329 was tested shortly after the event, which held ground and forced the H4 candles sub 1.33 into the closing bell.
Beneath 1.33, demand at 1.3235-1.3264 remains in view, which happens to house the daily support mentioned above at 1.3260 within the upper limit of its area. Should the H4 candles continue pressing lower today, however, a symmetrical AB=CD (red arrows) bullish pattern might complete just north of trend line support (taken from the low 1.2916) and the round number 1.32. It might also be worth noting the RSI indicator is seen fast approaching trend line support.
Areas of consideration:
Should the aforementioned H4 AB=CD bullish formation take shape today/early week and price tests the H4 trend line support (taken from the low 1.2916) an intraday long from here is considered high probability, with stop-loss orders either tucked beneath 1.32 or beneath the 161.8% H4 Fibonacci ext. point at 1.3169. Why high probability comes down to the fact the AB=CD pattern also merges closely with weekly support mentioned above at 1.3223. As for take-profit targets, the team has noted 1.33 as a logical starting point.
The only grumble here is in order to reach AB=CD completion, a move below daily support at 1.3260 and H4 demand at 1.3235-1.3264 will have to occur, thus potentially attracting sellers.
Today’s data points: FOMC Members Clarida, Quarles Williams and Brainard speak; US ISM Manufacturing PMI.
USD/CHF:
Weekly Gain/Loss: +0.21%
Weekly Close: 0.9988
Weekly perspective:
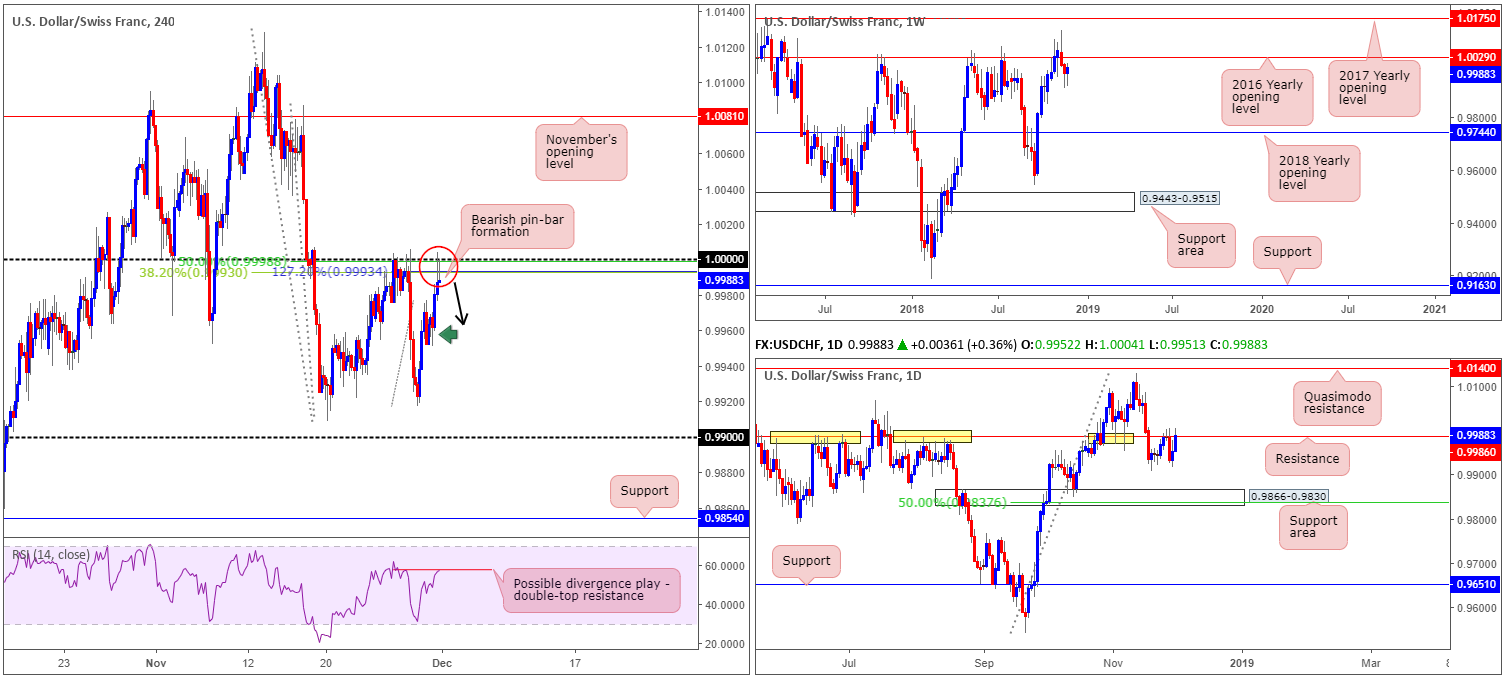
By way of two back-to-back reasonably nice-looking bullish pin-bar formations, the USD/CHF appears set to explore higher ground this week. The only problem with this is the weekly timeframe shows resistance plotted nearby at 1.0029 in the shape of the 2016 yearly opening level. Also worth taking into account is the chart confirms the next support target does not come into view until the 2018 yearly opening level at 0.9744.
Daily perspective:
In line with our weekly assessment, daily structure reveals price action ended the week engaging with resistance at 0.9986. The level, as you can see (yellow), boasts incredibly strong historical significance, and, therefore, has a chance of holding ground. Downside from this angle, apart from local support around 0.9920ish, seems reasonably free until a support area seen at 0.9866-0.9830 enters the fold.
H4 perspective:
Broad-based USD buying lifted the USD/CHF higher for a second consecutive day Friday, delivering the H4 candles to 1.0000 (parity). Note this widely watched number is also surrounded by a 38.2% Fibonacci resistance value and a 127.2% Fibonacci ext. point both at 0.9993, along with a 50.0% resistance value at 0.9999. In addition to this, we can also see the H4 candles ended Friday’s session in the shape of a bearish pin-bar formation, as well as a potential divergence play being seen out of the RSI indicator by way of a double-top resistance.
Areas of consideration:
Although weekly action portends higher prices, daily/H4 confluence strongly suggests a move lower is in store, targeting at least 0.9960ish (a H4 demand marked with a green arrow at 0.9956-0.9969).
A sell on the back of Friday’s closing pin-bar gets one in at around 0.9986ish, with a stop-loss order planted above the prior candle’s high (1.0004) at 1.0006. This equates to a 20-pip risk with 26 pips to the first target: 0.9960. Beyond 0.9960, the team has the local daily support at 0.9920 in mind as an additional target, followed then by 0.99.
Today’s data points: FOMC Members Clarida, Quarles Williams and Brainard speak; US ISM Manufacturing PMI.
Dow Jones Industrial Average:
Weekly Gain/Loss: +5.53%
Weekly Close: 25586
Weekly perspective:
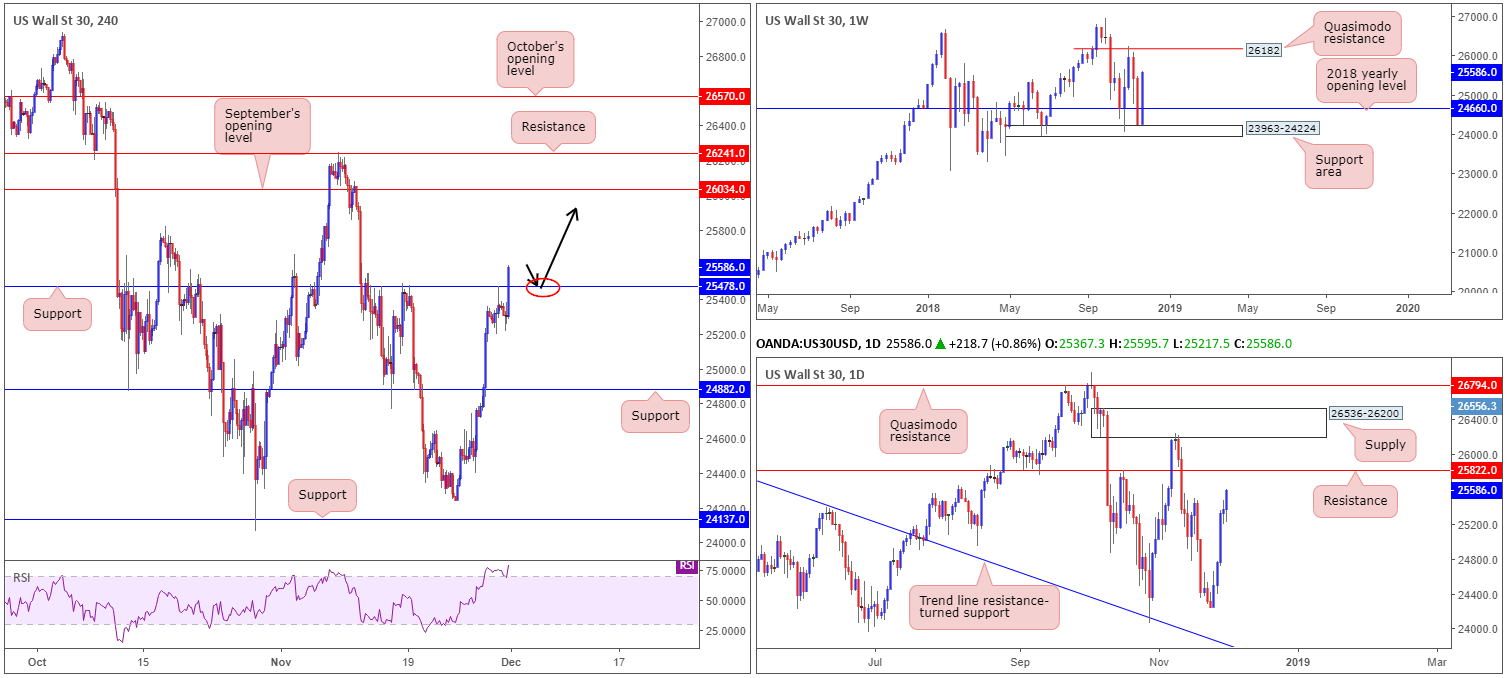
After two weeks of consecutive selling, the Dow Jones Industrial Average sported a stronger-than-expected comeback last week. Rebounding firmly off a support area coming in at 23963-24224, and reclaiming its 2018 yearly opening level at 24660, the index erased a large portion of recent losses and closed in the shape of a near-full-bodied bullish candle. Further buying from current price has a Quasimodo resistance level at 26182 on the radar.
Daily perspective:
Supporting further upside this week is the daily timeframe. By way of five consecutive days of gains, all, apart from Thursday, reporting a strong close, the unit appears to be gearing up for further buying this week, targeting resistance priced in at 25822. A break beyond here will likely see an approach towards a proven supply coming in at 26536-26200.
H4 perspective:
A brief look at recent dealings on the H4 timeframe has strong buying entering the fold amid US hours. Headlines surrounding the meeting with US President Trump and China’s President Xi Jinping heightened the hopes of a positive outcome and improved market sentiment.
The H4 candles, although held beautifully Thursday as resistance, broke through 25478 Friday, concluding the session in the form of a near-full-bodied bullish candle. This has potentially set the stage for a continuation move north this week, targeting September’s opening level at 26034.
Areas of consideration:
All three timeframes suggest additional upside may be seen this week. A H4 retest of 25748 as support (black arrows), followed up with a H4 bullish candlestick pattern – think pin-bar and engulfing formations – would, according to the overall technical landscape, likely be enough to draw in buyers and bid price to daily resistance mentioned above at 25822, followed by September’s opening level at 26034 on the H4 and then the weekly Quasimodo resistance at 26182.
Today’s data points: FOMC Members Clarida, Quarles Williams and Brainard speak; US ISM Manufacturing PMI.
XAU/USD (Gold):
Weekly Gain/Loss: -0.06%
Weekly Close: 1222.1
Weekly perspective:
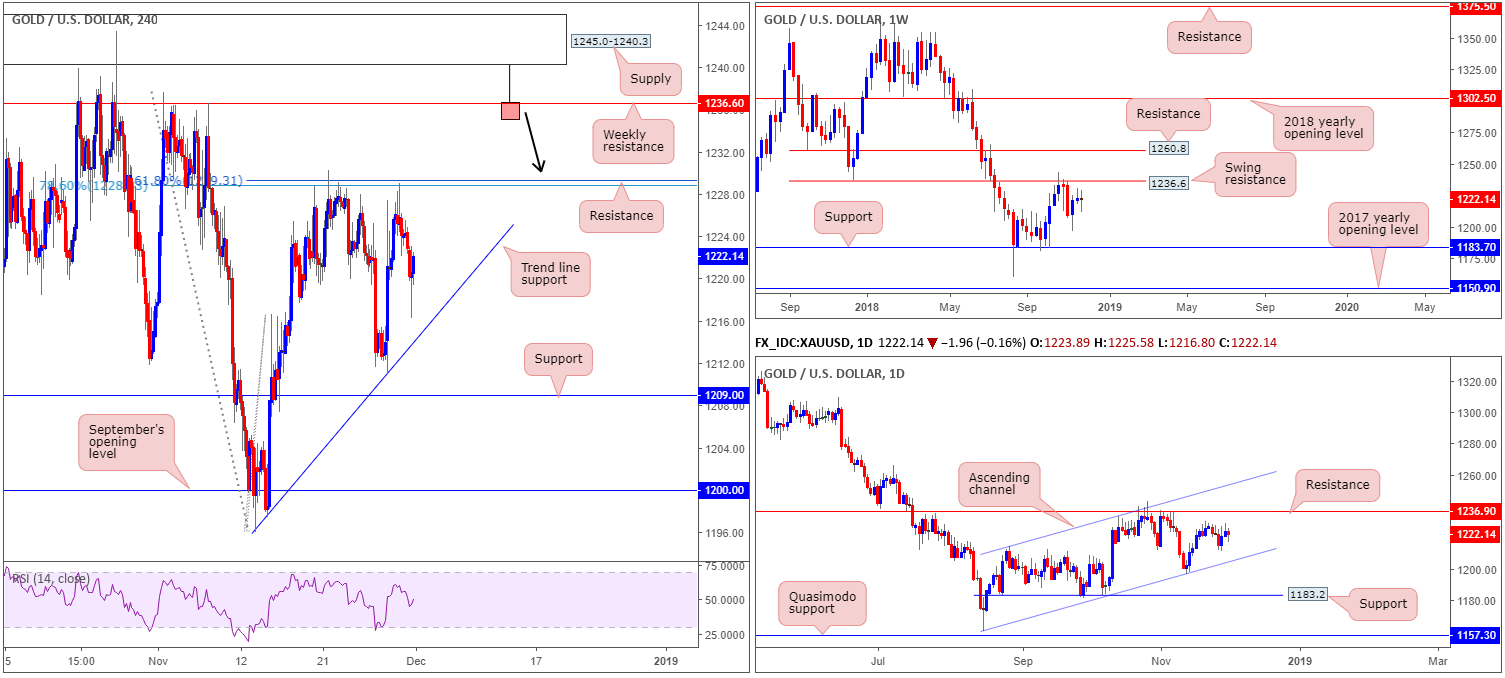
In the form of a clear-cut indecision candle, weekly flow concluded the week unchanged just south of a swing resistance priced in at 1236.6. The resistance remains a point of interest on this scale, having seen the barrier hold price action lower in October.
Daily perspective:
Looking at this market in more detail, we can see the yellow metal is currently compressing within an ascending channel formation (1160.3/1214.3), with the candles possibly working their way towards a test of resistance at 1236.9 (essentially representing the weekly swing resistance mentioned above at 1236.6).
H4 perspective:
Lower down on the curve, resistance by way of two nearby Fibonacci levels: a 161.8% Fibonacci ext. point at 1229.3 and a 78.6% retracement resistance at 1228.8 continue to have a marked effect in this market. Friday extended Thursday’s bounce lower from this level, influenced by a robust USD across the board. As attractive as the area may be, however, a move higher is still likely on the cards, according to our technical reading.
Areas of consideration:
Weekly swing resistance mentioned above at 1236.6 is of interest this week. This places the nearby H4 Fibonacci resistances in a vulnerable position. We would be surprised to see the H4 candles break beneath its trend line support (extended from the low 1196.0). In fact, this is a line worth watching for potential buying opportunities this week, should H4 price test the level in the shape of a bullish candlestick signal (entry/stop parameters can be defined according to this configuration). Upside targets from here fall in at the aforementioned H4 Fibonacci resistances, followed by the noted weekly resistance.
Something else to also keep an eyeball out for this week:
With H4 supply at 1245.0-1240.3 positioned just north of the current weekly resistance line, traders should prepare for the possibility of a fakeout play through the weekly level. In the event a H4 bearish pin-bar formation takes shape that pierces through the weekly resistance and tests the H4 supply (see H4 chart for a visual), this would be considered a high-probability shorting opportunity (stop-loss orders can be positioned either beyond the noted H4 supply or a few pips above the pin-bar’s wick), targeting 1229ish as an initial take-profit zone.
The use of the site is agreement that the site is for informational and educational purposes only and does not constitute advice in any form in the furtherance of any trade or trading decisions.
The accuracy, completeness and timeliness of the information contained on this site cannot be guaranteed. IC Markets does not warranty, guarantee or make any representations, or assume any liability with regard to financial results based on the use of the information in the site.
News, views, opinions, recommendations and other information obtained from sources outside of www.icmarkets.com.au, used in this site are believed to be reliable, but we cannot guarantee their accuracy or completeness. All such information is subject to change at any time without notice. IC Markets assumes no responsibility for the content of any linked site. The fact that such links may exist does not indicate approval or endorsement of any material contained on any linked site.
IC Markets is not liable for any harm caused by the transmission, through accessing the services or information on this site, of a computer virus, or other computer code or programming device that might be used to access, delete, damage, disable, disrupt or otherwise impede in any manner, the operation of the site or of any user’s software, hardware, data or property.


