
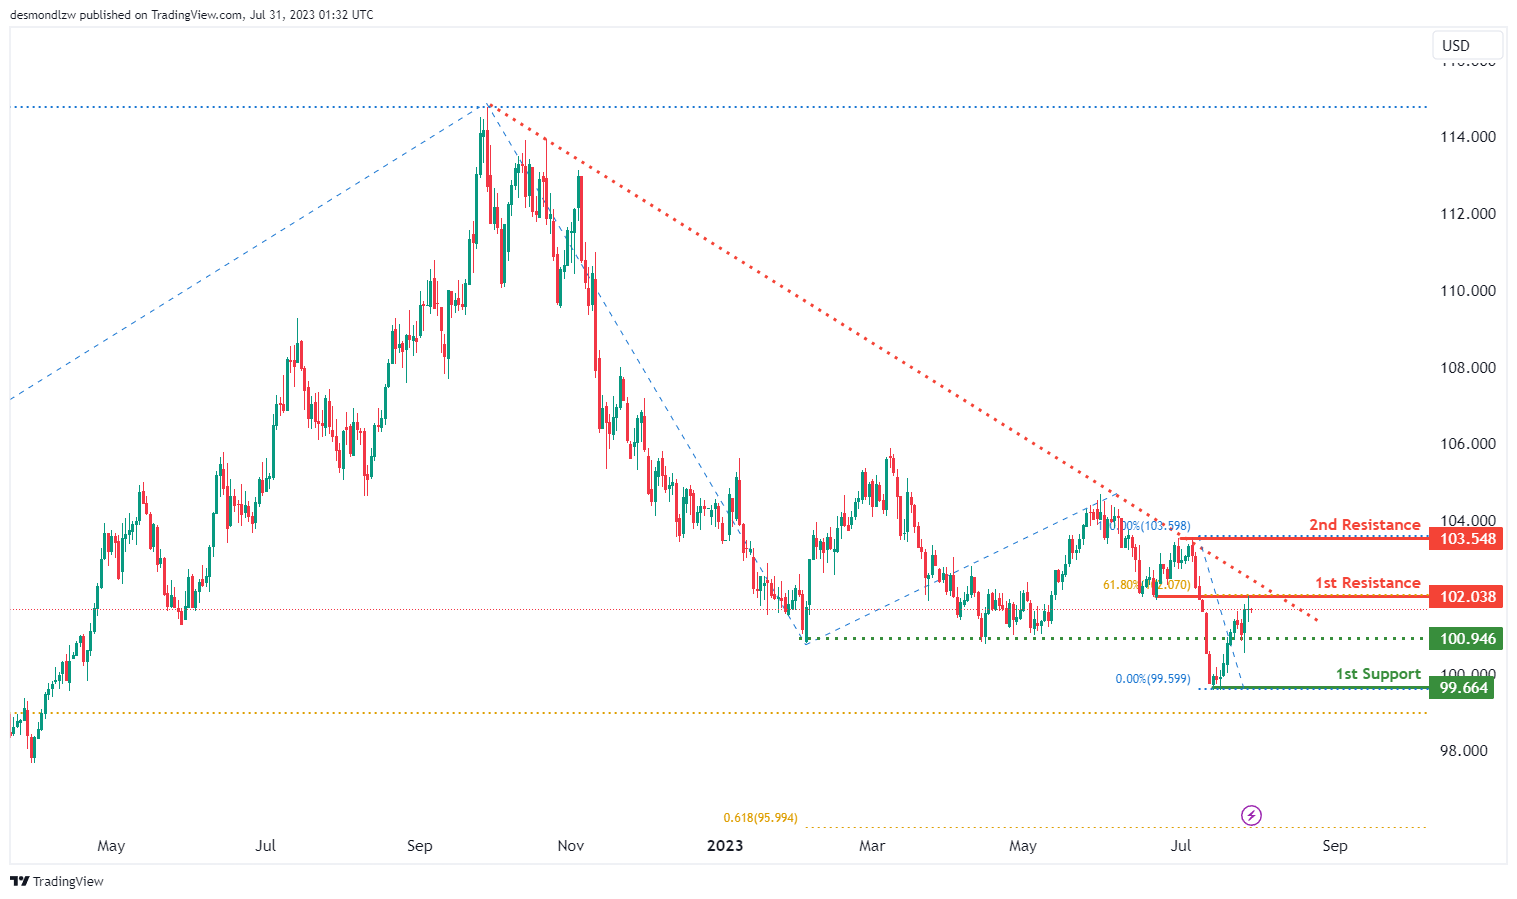
DXY:
The DXY is demonstrating a bearish trend at the moment, being positioned below a significant descending trend line. This suggests the potential for a continuation of bearish momentum.
The likelihood is that price could potentially continue its bearish move towards the 1st support, located at 99.66. This support level has credibility due to its history as a multi-swing low support.
An intermediate support level is also present at 100.94, acting as a pullback support, offering an additional cushion against a stronger downtrend.
In case of an upward movement, the 1st resistance level to watch is at 102.03. This resistance point is an overlap resistance and also aligns with the 61.80% Fibonacci retracement level.
Further up, the 2nd resistance is found at 103.54. This level has acted as a swing high resistance in the past and could serve as a significant barrier against price advancement.
EUR/USD:
The EUR/USD is currently showing a bullish trend, positioning itself above a key ascending trend line which suggests the potential for additional bullish momentum.
The price is expected to make a bullish bounce off the 1st support level and head towards the 1st resistance. The 1st support level is at 1.0989 and it’s seen as a key level due to its role as an overlap support as well as its alignment with the 61.80% and 50% Fibonacci retracement levels, creating a Fibonacci confluence.
If the price does fall further, the 2nd support at 1.0832 could come into play. This level is deemed solid due to its previous role as a multi-swing low support.
On the upside, the 1st resistance level to watch is at 1.1252, which has functioned as a swing high resistance in the past. Should the price break past this level, the 2nd resistance at 1.1509 could present a challenge. This level is significant as it has served as an overlap resistance previously.

EUR/JPY:
The EUR/JPY chart demonstrates a bullish momentum, supported by the fact that the price is above the bullish Ichimoku cloud.
A potential scenario indicates a bullish continuation towards the 1st resistance level at 157.97. This resistance is considered significant as it represents a multi-swing high resistance.
In case of any potential retracement, the price might find support at the 1st support level of 151.78, which aligns with the 23.60% Fibonacci retracement. Additionally, the 2nd support at 148.60 is another relevant area as it corresponds to the 50% Fibonacci retracement.
Furthermore, there is a 2nd resistance at 160.77, which is identified as the -61.8% Fibonacci expansion level. These support and resistance levels are vital in determining possible price movements for EUR/JPY.

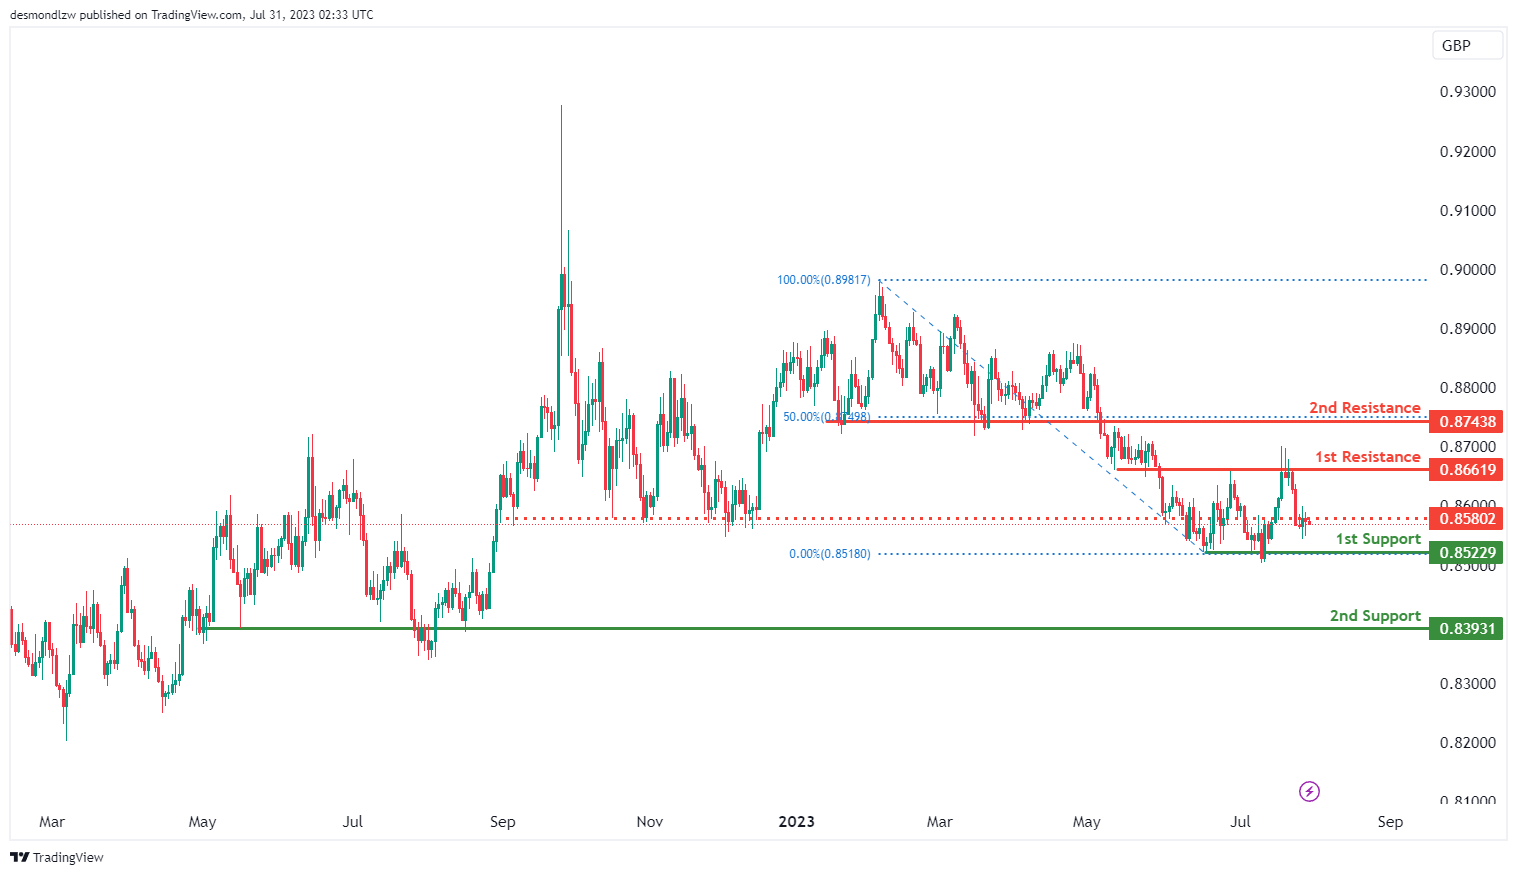
EUR/GBP:
The EUR/GBP chart indicates a bearish momentum, suggesting a potential bearish continuation towards the 1st support level at 0.8522. This support is considered significant as it acts as an overlap support.
In the event of further downward movement, the price might find additional support at the 2nd support level of 0.8393, which also functions as an overlap support.
On the upside, the 1st resistance at 0.8661 is recognized as an overlap resistance, and the 2nd resistance at 0.8743 represents a pullback resistance, coinciding with the 50% Fibonacci retracement. Additionally, there is an intermediate resistance at 0.8580, which also acts as an overlap resistance.
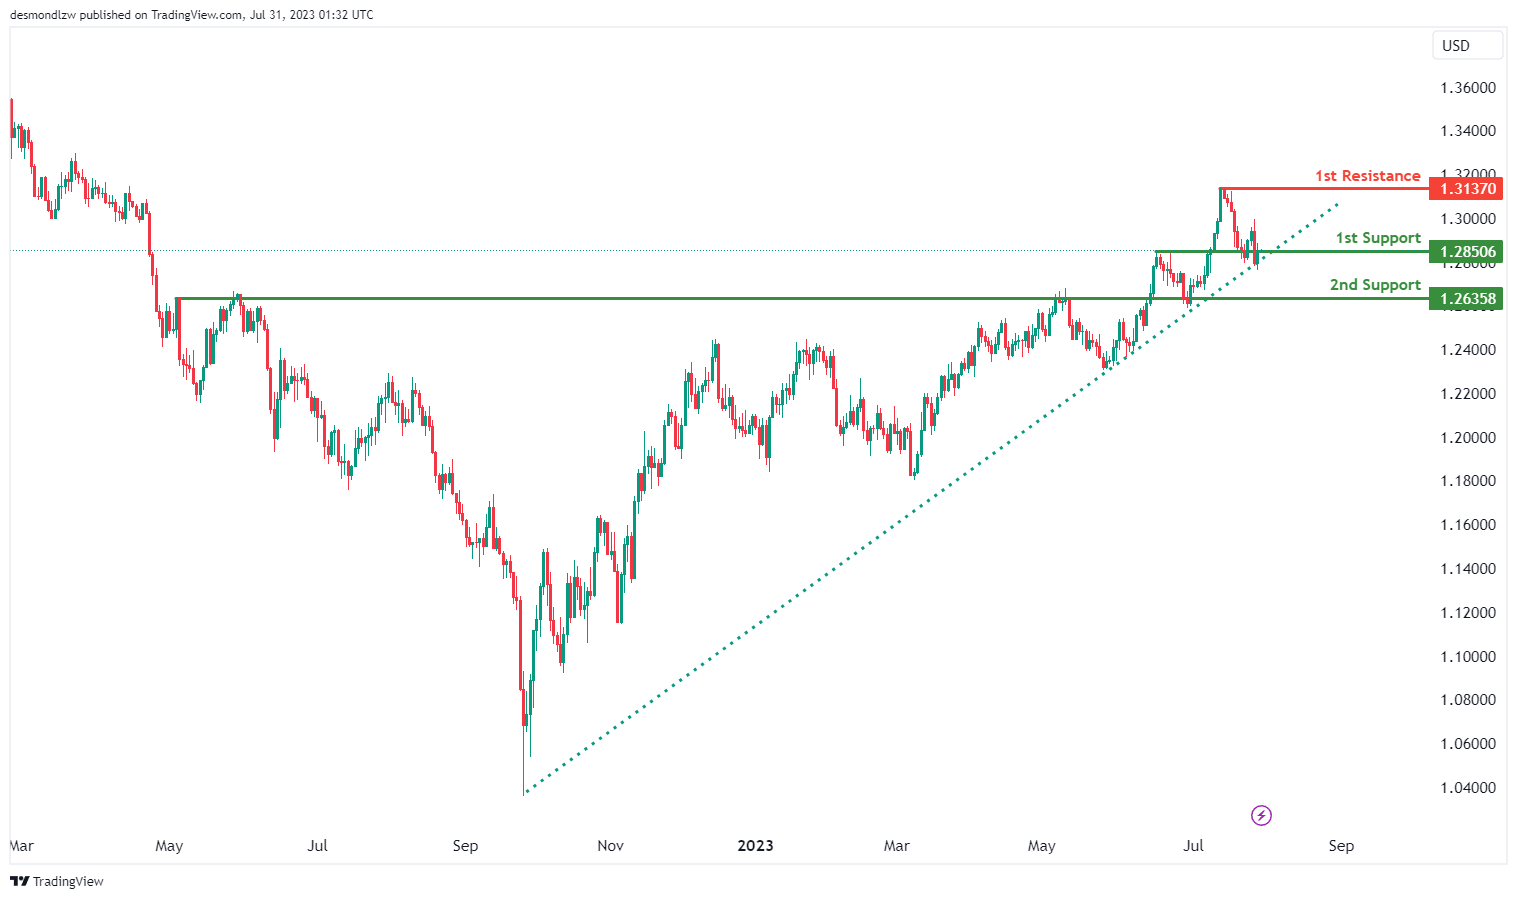
GBP/USD:
The GBP/USD pair is presently illustrating a bullish trend, as it’s positioned above an important ascending trend line, indicating the potential for further bullish momentum.
The price is anticipated to follow a bullish trajectory towards the 1st resistance. The 1st support level is set at 1.2850 and is considered strong due to its role as an overlap support.
Should the price decline further, the 2nd support at 1.2635, another overlap support, could serve as a significant level to halt the price drop.
On the bullish side, the 1st resistance level is located at 1.3237, a level that has previously served as a swing high resistance, posing a potential hurdle to the price movement.
GBP/JPY:
The GBP/JPY chart indicates a bullish momentum, supported by the fact that the price is above the bullish Ichimoku cloud.
A potential scenario suggests a bullish continuation towards the 1st resistance level at 183.82. This resistance is considered significant as it represents a multi-swing high resistance.
In case of any potential retracement, the price might find support at the 1st support level of 179.91. Additionally, the 2nd support at 176.18 is another relevant area as it corresponds to the 23.60% Fibonacci retracement.
Furthermore, there is a 2nd resistance at 186.29, which is identified as a swing high resistance. Moreover, the intermediate resistance at 182.12 also acts as an important overlap resistance.

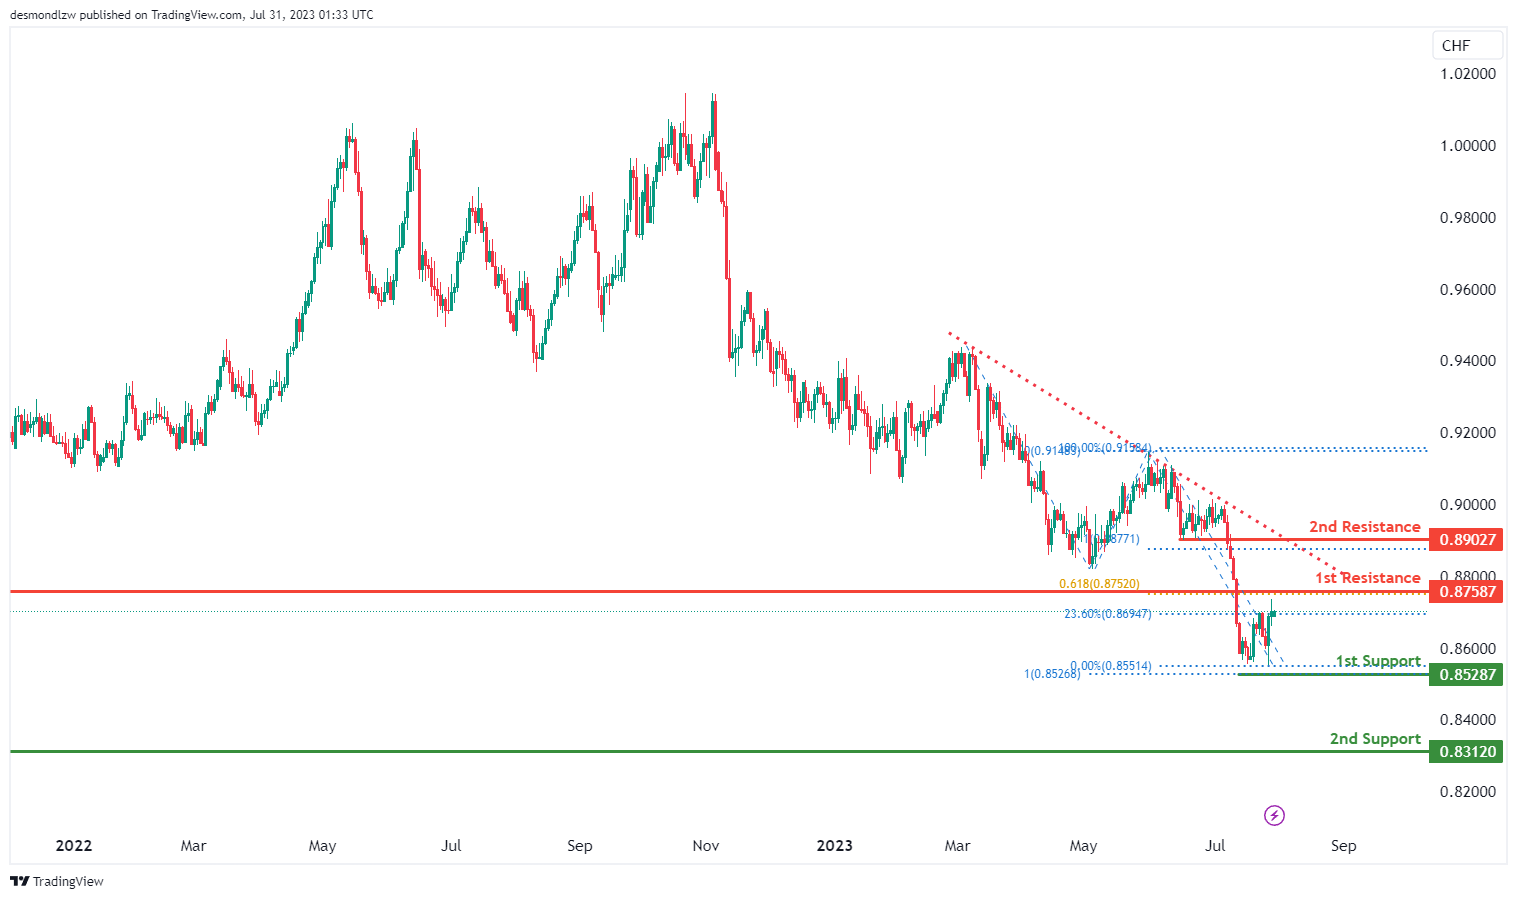
USD/CHF:
The USD/CHF currency pair is currently showing a bearish trend, positioned below a significant descending trend line, suggesting potential for further bearish momentum.
There could potentially be a bearish reaction off the 1st resistance level, causing the price to drop towards the 1st support level. The 1st support level is found at 0.8528 and it’s important due to its position at the 100% Fibonacci Projection.
If the price continues its downward trajectory, the 2nd support level at 0.8312, serving as a swing low support, could halt further price decline.
On the upward side, the 1st resistance level is at 0.8758, acting as a pullback resistance and corresponding with the 61.80% Fibonacci Projection. If the price manages to exceed this level, it would encounter the 2nd resistance at 0.8902, which serves as a pullback resistance and coincides with the 100% Fibonacci Projection.
USD/JPY:
The USD/JPY currency pair is currently displaying a bullish trend, indicating a potential for further upward momentum.
The expectation is that the price may continue its bullish progression towards the 1st resistance level. The 1st support level, positioned at 134.57, provides a key role as an overlap support which could potentially halt any short-term price declines.
If the bearish pull becomes stronger and the price falls below the 1st support, the 2nd support at 134.57, functioning as a pullback support, is the next significant level to watch.
On the other hand, in an upward direction, the 1st resistance level is located at 142.27. This level has previously acted as an overlap resistance and corresponds with the 61.80% Fibonacci retracement level, thus could provide a hurdle to further price increase.
If the price manages to breach this resistance, the 2nd resistance level at 145.00, recognized as a swing high resistance, would be the next target.

USD/CAD:
The USD/CAD chart demonstrates a bullish momentum, suggesting a potential bullish movement towards the 1st resistance level at 1.3377, which is identified as an overlap resistance coinciding with the 50.0% Fibonacci retracement level.
In case of a downward movement, there is an intermediate support at 1.3117 that acts as a pullback support should price retreat to this level. Should price break below this intermediate support level,
the 1st support at 1.2983 holds significance as it aligns with multiple factors of Fibonacci levels. These factors include an overlap support that coincides with both the 50.00% Fibonacci retracement and the 78.60% projection levels, indicating a Fibonacci confluence. This convergence of Fibonacci levels strengthens the support’s significance. It is also worth noting that price is trading within a bearish channel.

AUD/USD:
The AUD/USD chart displays a bullish momentum, indicating a potential bullish move towards the 1st resistance at 0.6889. This 1st resistance level represents an overlap resistance. Additionally, the 2nd resistance at 0.7137 serves as another important area, acting as an overlap resistance coinciding with the 61.80% Fibonacci projection level.
In case of a downward movement, the 1st support level at 0.6580 is identified as an overlap support coinciding with the 100.00% Fibonacci projection level. Should the bearish trend persist, the 2nd support at 0.6501 represents another significant level, acting as an overlap support coinciding with the 61.80% Fibonacci retracement level.

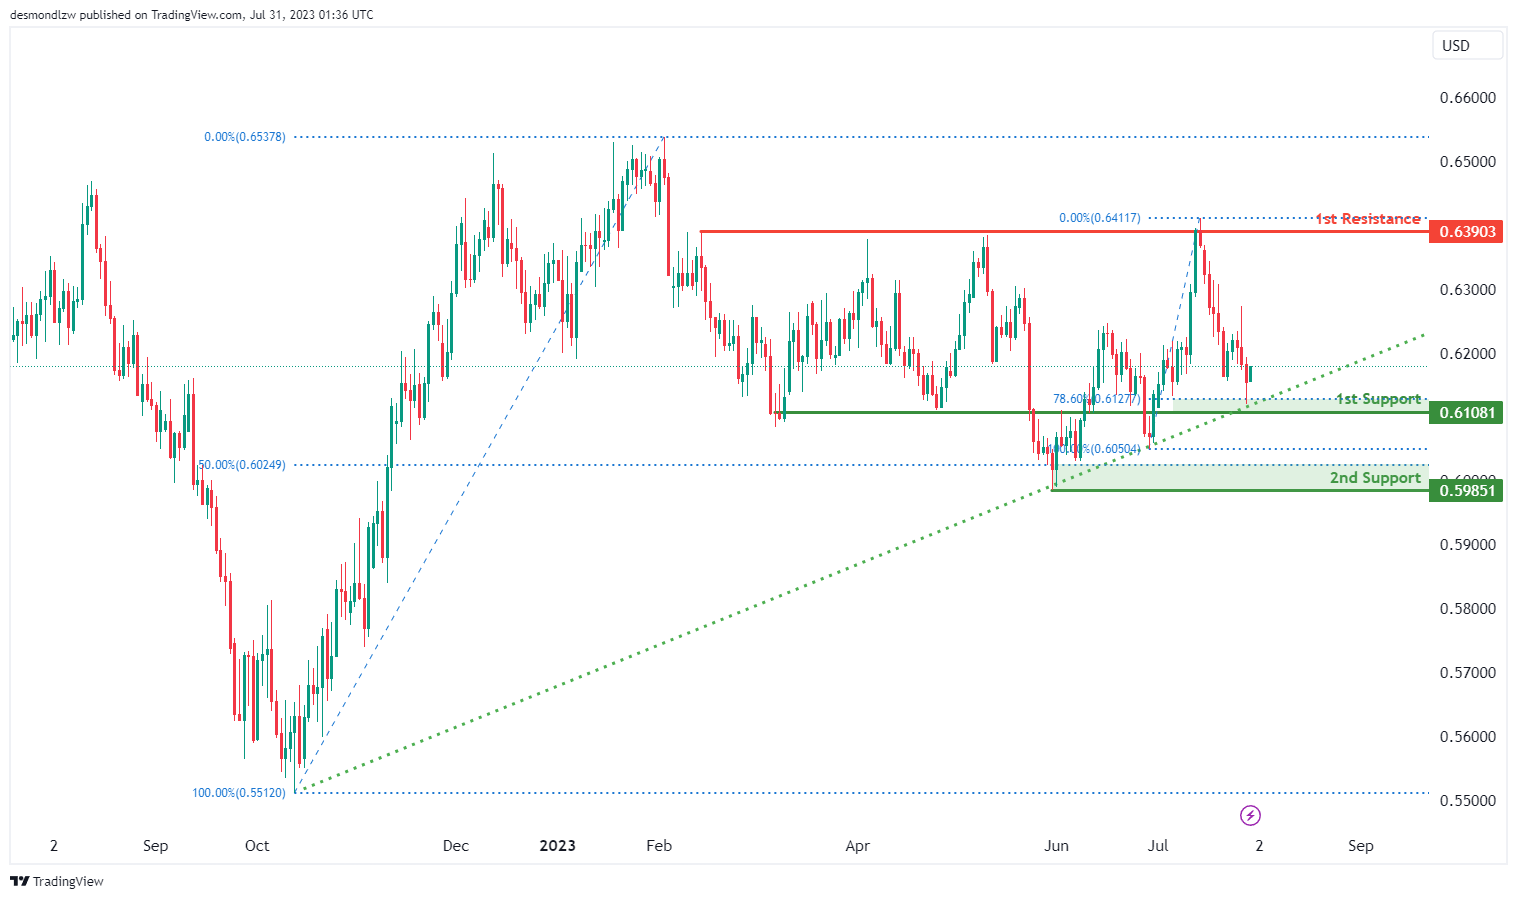
NZD/USD
The NZD/USD chart currently demonstrates a bullish momentum, indicating a potential scenario for price to rise towards the 1st resistance level at 0.6390 which is an overlap resistance.This is attributed to the price reversing above a major ascending trend line, suggesting the possibility of further bullish movement.
The 1st support at 0.6108 is a significant area, acting as an overlap support that coincides with the 78.60% Fibonacci retracement level. Furthermore, the 2nd support at 0.5985 represents another key level, serving as a pullback support and coinciding with the 50.00% Fibonacci retracement level.
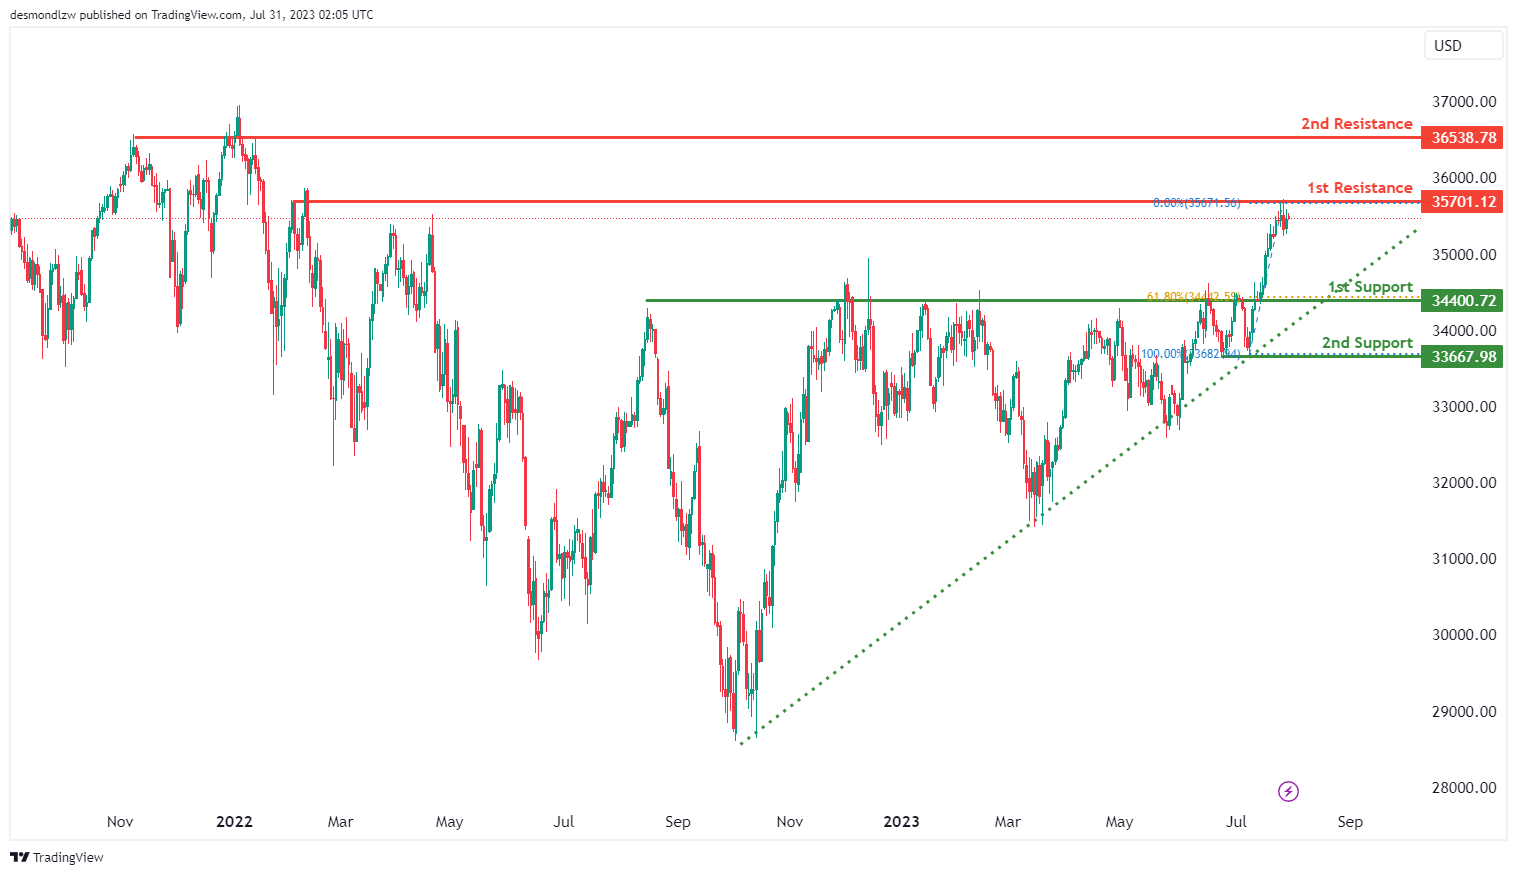
DJ30:
The DJ30 chart demonstrates a bullish momentum, as the price is above a major ascending trend line, suggesting the potential for further upward movement.
A possible scenario indicates a bullish continuation towards the 1st resistance at 35701.12, which is identified as an overlap resistance.
On the downside, the 1st support at 34400.72 is a significant area, acting as an overlap support and coinciding with the 61.80% Fibonacci retracement. Additionally, the 2nd support at 33667.98 serves as another key level, representing a multi-swing low support.
On the upside, the 2nd resistance at 36538.78 is recognized as an overlap resistance. These support and resistance levels play crucial roles in determining potential price movements for DJ30.
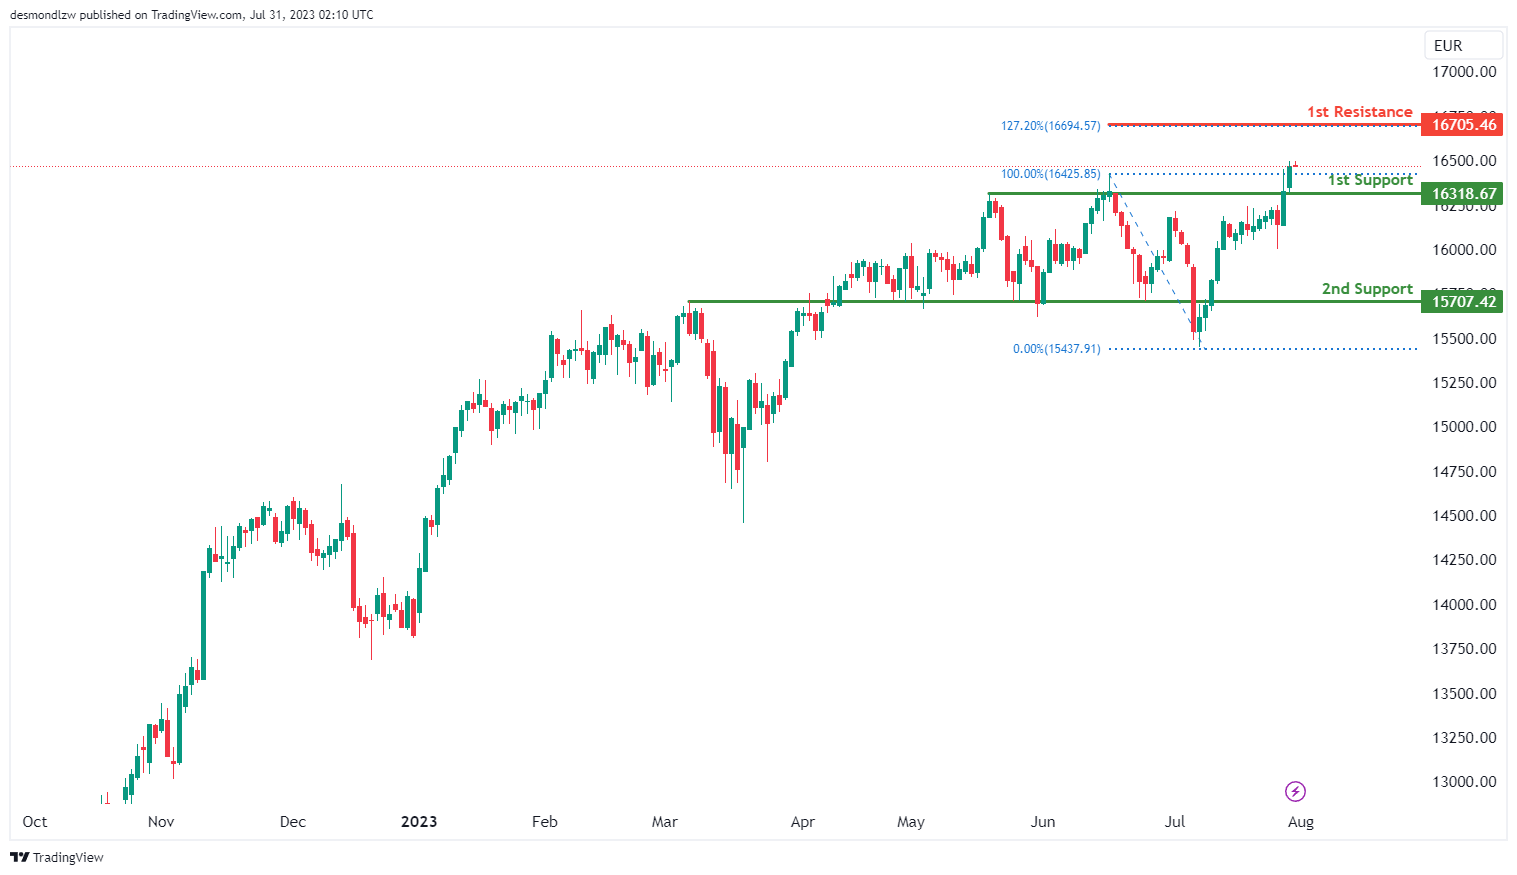
GER30:
The GER30 chart indicates a bullish momentum, suggesting a potential bullish bounce off the 1st support level at 16318.67, which is an overlap support. This bounce could lead the price towards the 1st resistance at 16705.46, which is significant as it corresponds to the 127.20% Fibonacci Extension.
Additionally, the 2nd support at 15707.42 serves as another important area, acting as an overlap support. These support and resistance levels are critical in determining potential price movements for GER30.
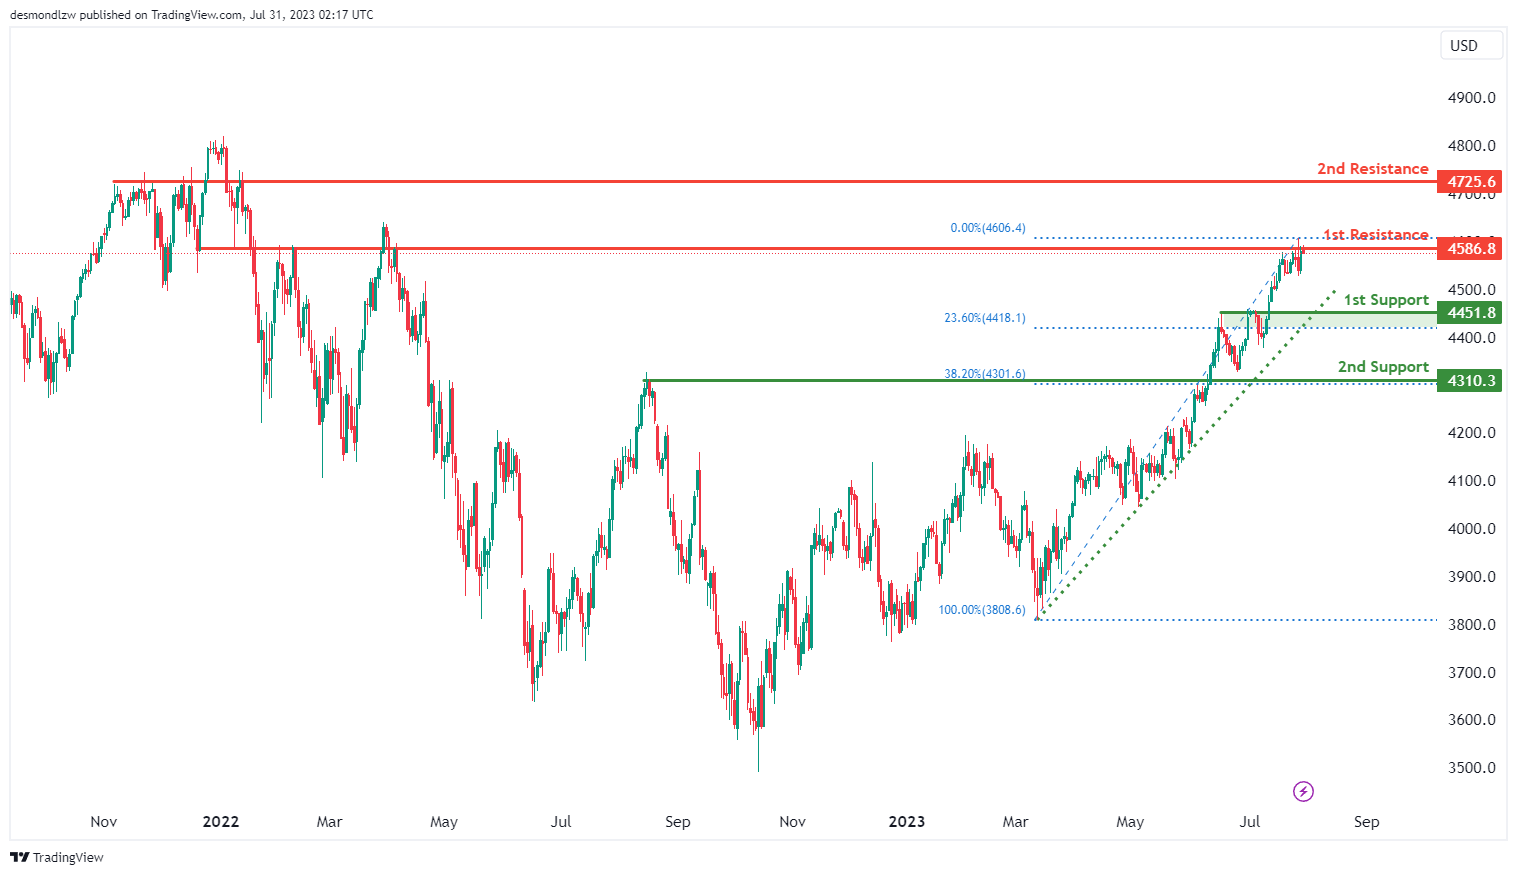
US500
The US500 chart shows a bearish momentum, suggesting a potential bearish reaction off the 1st resistance level at 4586.8. This resistance is significant as it acts as an overlap resistance.
If the bearish reaction occurs, the price might drop towards the 1st support level at 4451.8, which is recognized as a pullback support and coincides with the 23.60% Fibonacci retracement. Further downward movement may find additional support at the 2nd support level of 4310.3, which is another pullback support aligned with the 38.20% Fibonacci retracement.
On the upside, the 2nd resistance at 4725.6 represents an important level, acting as an overlap resistance. These support and resistance levels play a crucial role in determining potential price movements for US500.
BTC/USD:
The BTC/USD chart currently exhibits a neutral overall momentum. However, it’s worth noting that the price is above a major ascending trend line, which suggests the possibility of further bullish momentum in the future.
Price could potentially fluctuate between the 1st resistance at 29853 and the 1st support at 27800. The 1st support level is considered significant as it represents an overlap support, while the 1st resistance is recognized as another overlap resistance.
On the upside, the 2nd resistance at 31386 is a critical level, acting as a multi-swing high resistance. Conversely, the intermediate support at 28473 serves as a pullback support and may provide additional stability in case of price retracements.

ETH/USD:
The ETH/USD chart indicates a bullish momentum, supported by the fact that the price is above a major ascending trend line, suggesting the potential for further upward movement.
A possible scenario for the price is a bullish bounce off the 1st support level at 1829.07, which is a multi-swing low support, leading it towards the 1st resistance at 2028.15. This resistance level is identified as an overlap resistance.
In case of further upward movement, the 2nd resistance at 2143.59 represents a significant swing high resistance. Conversely, on the downside, the 2nd support at 1712.99 acts as another key area, functioning as an overlap support. These support and resistance levels play crucial roles in determining potential price movements for ETH/USD.

WTI/USD:
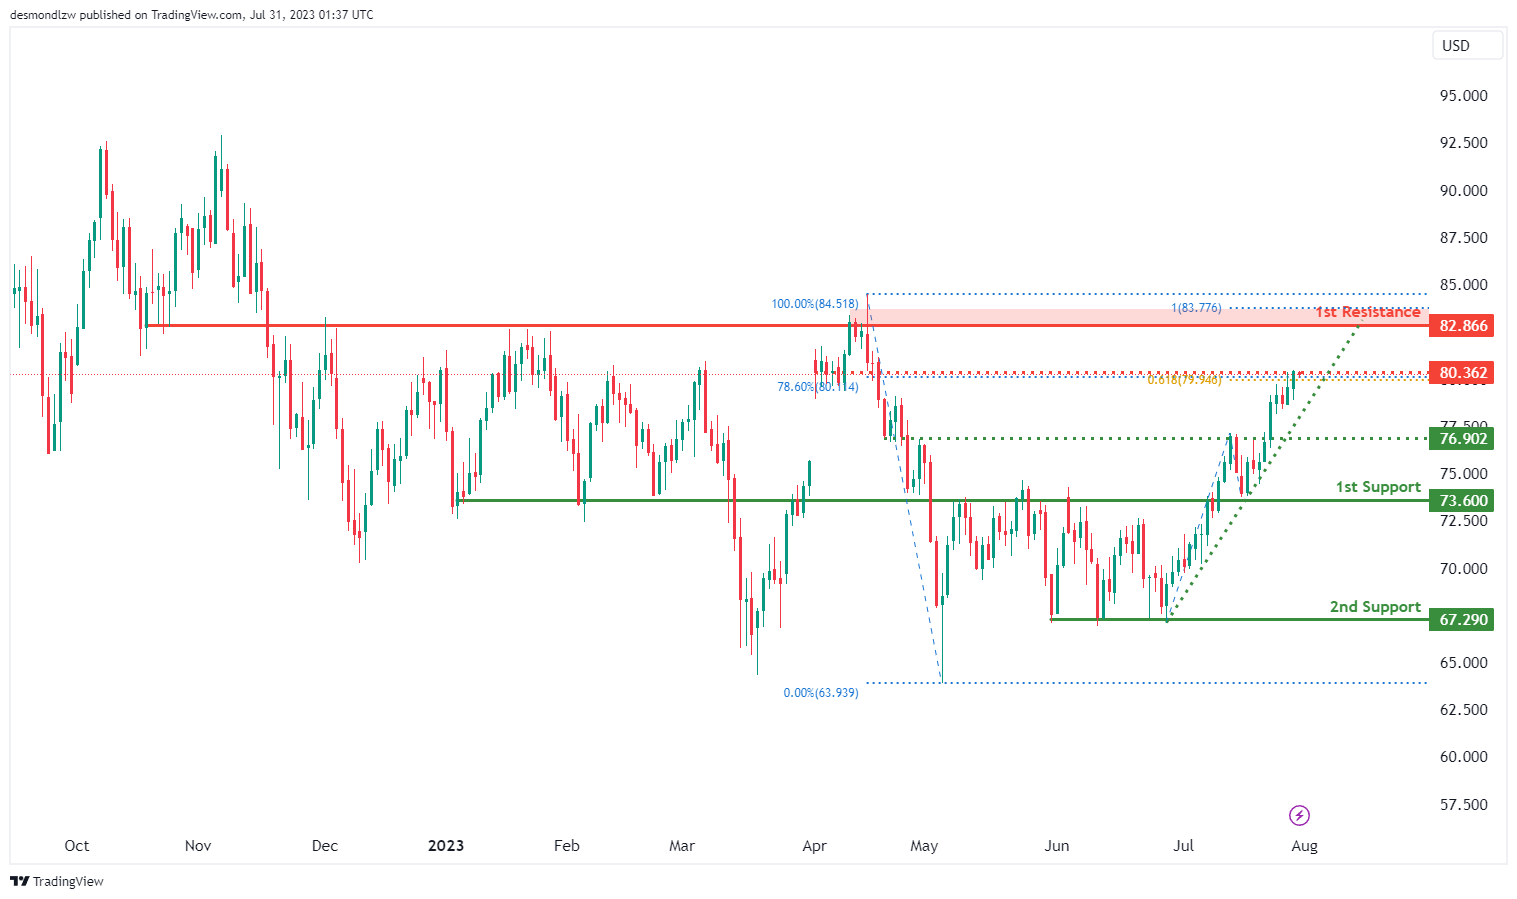
The WTI/USD chart currently shows a bullish momentum. This is attributed to the price being above a major ascending trend line, suggesting the possibility of further bullish movement. However, it’s worth noting that price is trading close to an intermediate resistance level at 80.36 which coincides with a confluence of Fibonacci levels i.e. the 78.60% retracement and 61.80% projection levels. Should the price break above this level, the 1st resistance at 82.87 is significant as it represents an overlap resistance that coincides with the 100.00% Fibonacci projection level.
On the downside, there is an intermediate support level at 76.90 which represents a pullback level.
The 1st support at 73.60 is significant as it represents an overlap support. Additionally, the 2nd support at 67.29 also serves as an overlap support level.
XAU/USD (GOLD):
The XAUUSD pair is currently exhibiting a neutral trend. The 1st support level is positioned at 1891.41, which has served as a swing low support in the past, making it a key level to monitor for potential price rebounds.
The level at which one should look for downside confirmation is 1935.01. The specifics of why this level is significant aren’t provided, but it’s likely due to past price interactions at this level.
On the flip side, the 1st resistance level lies at 2048.81. This level has been a multi-swing high resistance and aligns with the 61.80% Fibonacci retracement level, thus could pose a challenge to bullish movements.
Finally, one should watch for upside confirmation at the level of 1979.68. This level, which aligns with the 50% Fibonacci retracement, has acted as an overlap resistance in the past. Hence, it could offer a level of resistance to upward price movements.

The accuracy, completeness and timeliness of the information contained on this site cannot be guaranteed. IC Markets does not warranty, guarantee or make any representations, or assume any liability regarding financial results based on the use of the information in the site.
News, views, opinions, recommendations and other information obtained from sources outside of www.icmarkets.com, used in this site are believed to be reliable, but we cannot guarantee their accuracy or completeness. All such information is subject to change at any time without notice. IC Markets assumes no responsibility for the content of any linked site.
The fact that such links may exist does not indicate approval or endorsement of any material contained on any linked site. IC Markets is not liable for any harm caused by the transmission, through accessing the services or information on this site, of a computer virus, or other computer code or programming device that might be used to access, delete, damage, disable, disrupt or otherwise impede in any manner, the operation of the site or of any user’s software, hardware, data or property.


