
Key risk events today:
China Manufacturing PMI and Non-Manufacturing PMI; Caixin Manufacturing PMI; German Prelim CPI m/m; UK Current Account; UK Final GDP q/q; Canada RMPI m/m; Chicago PMI; New Zealand NZIER Business Confidence.
EUR/USD:
Weekly gain/loss: -0.70%
Weekly close: 1.0940
Weekly perspective:
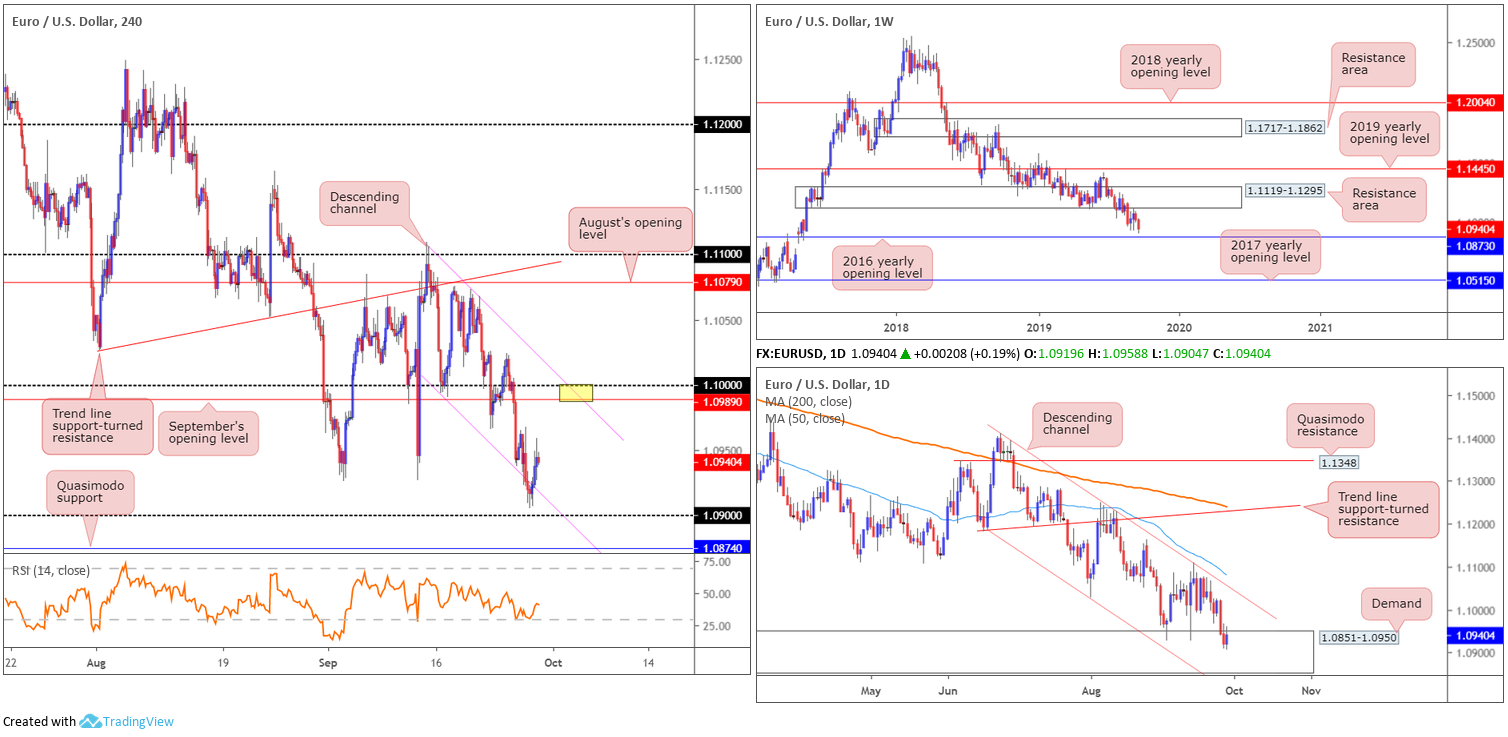
Dollar strength – US dollar index toppled its 99.00 mark and concluded the week just shy of YTD highs at 99.37 – guided EUR/USD to fresh YTD lows of 1.0904 last week, down for a second consecutive session ahead of support priced in the form of the 2016 yearly opening level at 1.0873. To the upside, the next area of resistance falls within 1.1119-1.1295.
Concerning trend direction, since topping in early 2018 at 1.2555, the long-term trend remains facing a southerly bearing.
Daily perspective:
Daily action found itself back within the parapets of demand at 1.0851-1.0950 last week – formed April 2017 and houses the 2016 yearly opening level inside its lower bounds. In addition to this, price has remained compressing within a descending channel formation since late June (1.1412/1.1026), with the 50-day SMA (blue – 1.1081) trailing the upper limit.
H4 perspective:
In terms of macroeconomic data, headline US durable goods orders rose +0.2% m/m in august, topping the consensus view at -1.1%, according to the US Census Bureau on Friday. US personal consumption expenditures, according to the Bureau of Economic Analysis, fell 0.1% m/m, unable to meet consensus at 0.3%.
Technically, the H4 candles left 1.09 unchallenged Friday, sporting several lower candlestick shadows before rotating back within the descending channel formation (1.1109/1.0993). Aided on the back of daily demand highlighted above at 1.0851-1.0950, the pair certainly has scope to shake hands with September’s opening level at 1.0989, closely followed by the key figure 1.10 and channel resistance, this week.
Failure to reach the said resistances would draw 1.09 back into the framework, followed by a possible push to Quasimodo support at 1.0874.
Areas of consideration:
Based on the technical studies, two possible scenarios are on the cards this week:
- With well-placed weekly support at 1.0873 in sight, together with daily action testing demand, the H4 Quasimodo support level highlighted above at 1.0874 is likely of interest for longs.The key observation here, aside from clear-cut higher-timeframe confluence, is the psychological number 1.09. This figure naturally entices stop-loss orders, which, in this situation, are asking to be filled. The break of 1.09 will fill sell stops, both from traders with long orders at 1.09 and those attempting to sell the breakout, therefore providing liquidity for traders long out of 1.0874.Traders likely eye 1.0874 as an entry point, with protective stop-loss placement eyed beneath the low of the Quasimodo formation at 1.0839 (see May 2017).
- Marked in yellow, the point the key figure 1.10, H4 channel resistance and September’s opening level at 1.0989 merge, is an interesting area of resistance for potential shorts. Although the area lacks higher-timeframe resistance, it is positioned in line with the current downtrend. Given the size of the area (1.10/1.0989), however, traders may want to consider waiting for additional candlestick confirmation to form before pulling the trigger (traders then have the option of setting entry and risk levels according to this structure).
GBP/USD:
Weekly gain/loss: -1.49%
Weekly close: 1.2284
Weekly perspective:
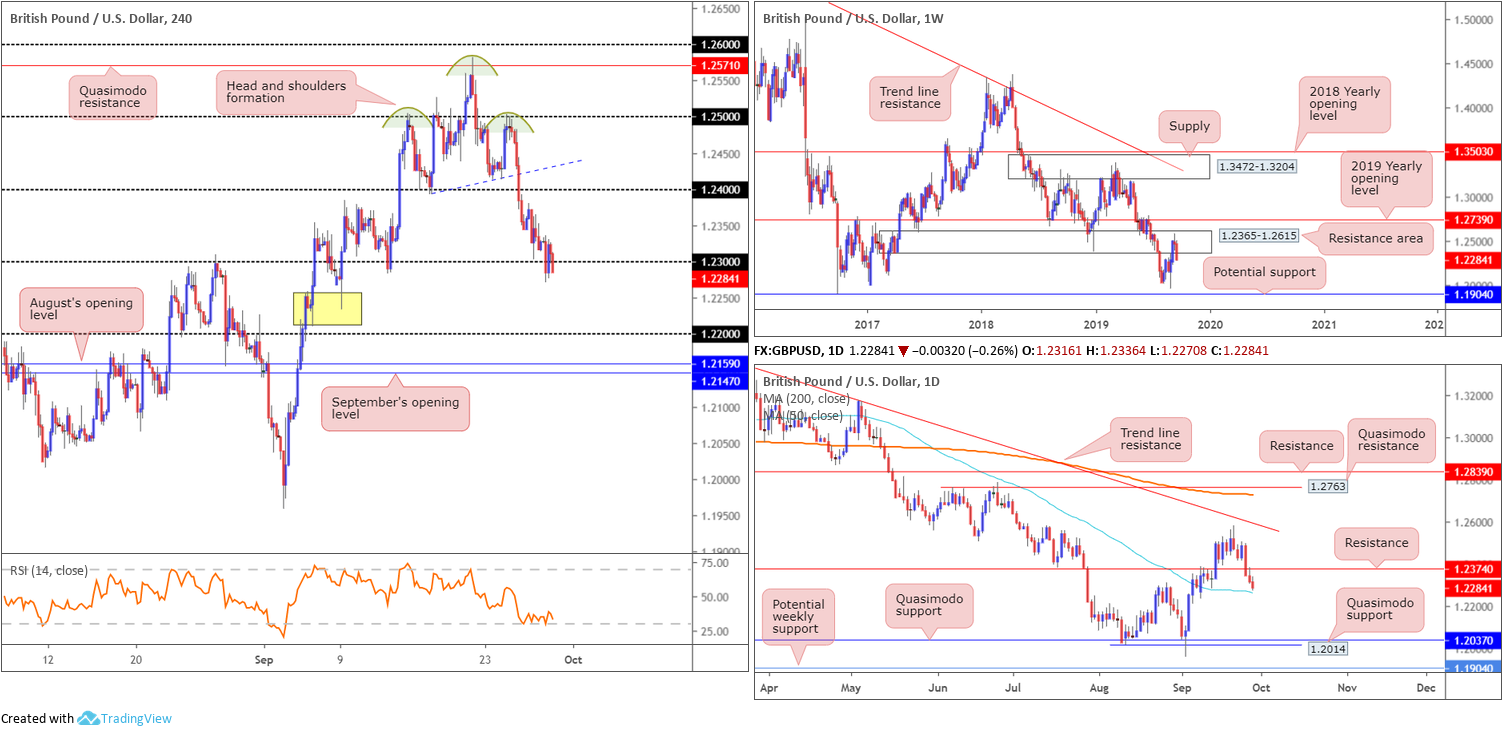
Following the prior week’s pause in momentum within a long-term resistance area coming in at 1.2365-1.2615, shaped in the form of an indecision Doji candle, strong selling materialised last week. Shedding more than 180 points, the near-full-bodied bearish close positions the spotlight back on support at 1.1904 – held price action strongly higher in October 2016.
Daily perspective:
Wednesday witnessed the unit dethrone support coming in at 1.2374 in strong fashion last week, prompting additional selling into the week’s close. With 1.2374 now likely to serve as resistance, sellers face immediate support this week in the form of the 50-day SMA (blue – 1.2262). A break, nevertheless, may set the stage for a sizable run towards two layers of Quasimodo support drawn from 1.2037 and 1.2014.
H4 perspective:
Persistent Brexit-related uncertainties continued to weigh on sterling Friday, down 0.26% against the buck. Following Wednesday’s completion of a head and shoulders topping formation off Quasimodo resistance at 1.2571, technical structure observed a marginal close form sub 1.23.
Beneath 1.23, traders face possible support off the 50-day SMA (blue – 1.2262) on the daily timeframe, with a break of this barrier perhaps exposing the 1.22 angle. The H4 demand marked in yellow at 1.2230/1.2256 is in a vulnerable position, according to our chart studies, given 1.22 likely to act as a magnet to price.
Areas of consideration:
Having weekly action suggest further downside, traders may find use in the close beneath 1.23. Followed up with a retest, preferably by way of a H4 bearish candlestick signal (entry and risk can then be determined according to this pattern), this move has an initial target set at the 50-day SMA, with a break of this region, as highlighted above, likely clearing the pathway to 1.22.
AUD/USD:
Weekly gain/loss: -0.01%
Weekly close: 0.6761
Weekly perspective:
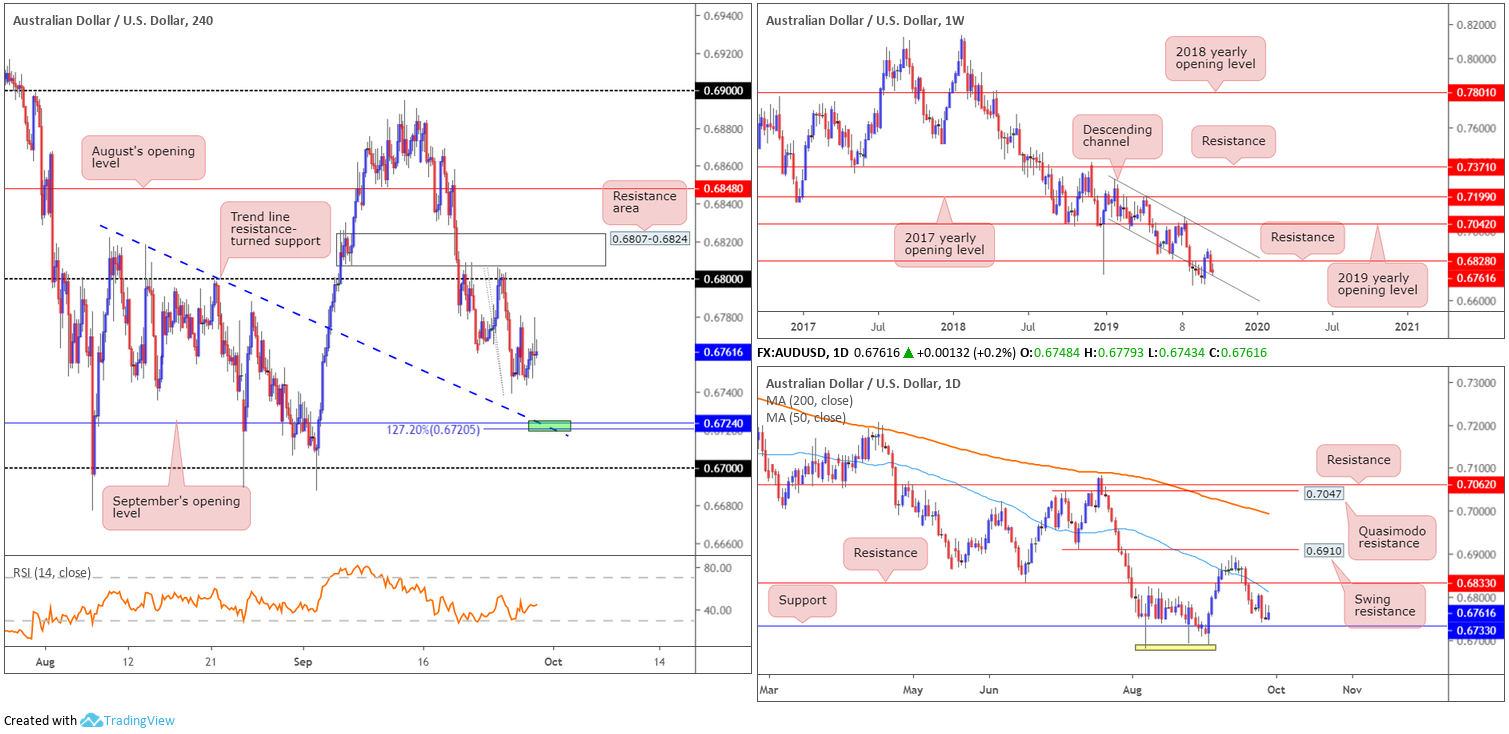
The Australian dollar wrapped up the week unmoved against the buck last week, unable to overthrow channel support taken from the low 0.7003. To the upside, resistance resides close by at 0.6828, with a break of the aforementioned channel possibly exposing 0.6677, the YTD low.
As is painfully obvious on the weekly chart, the long-term downtrend remains in full swing, and has done since early 2018.
Daily perspective:
Support at 0.6733 remains a key fixture on the daily timeframe, as does resistance plotted at 0.6833. Also of interest is the 200/50-day SMAs both facing south. A break of the said support has a bottom formation to target around 0.6687, followed by support at 0.6301 (not visible on the screen).
H4 perspective:
Friday saw the Australian dollar finish a shade higher against the greenback, though failed to penetrate the upper edge of Thursday’s range.
Traders appear wavering at present, buoyed currently by the weekly channel support (see above). Despite this, research on the H4 timeframe has September’s opening level at 0.6724 on the radar as potential support this week. Intersecting closely with a trend line resistance-turned support (taken from the high 0.6818) and a 127.2% Fibonacci extension point at 0.6720, the chances of a reaction forming off here is reasonably high. In addition to H4 confluence, daily support resides just north of the 0.6724 region at 0.6733.
To the upside, however, the 0.68 handle is in sight, shadowed by a resistance area at 0.6807-0.6824. Note this zone is sited just south of the daily resistance at 0.6833 and weekly resistance at 0.6828, and currently intersects with the 50-day SMA mentioned above on the daily timeframe.
Areas of consideration:
Should the H4 candles test 0.6724 this week, active buyers may make an appearance. For that reason, keep eyes on this area for signs of buying, preferably in the form of a H4 bullish candlestick formation (traders then have the choice of calculating entry and risk based on this structure).
A move higher, on the other hand, could see a test of the 0.68 handle and the H4 resistance area at 0.6807-0.6824, though sellers in this vicinity must be prepared for a fakeout to nearby higher-timeframe resistances, 0.6833 and 0.6828.
USD/JPY:
Weekly gain/loss: +0.37%
Weekly close: 107.93
Weekly perspective:
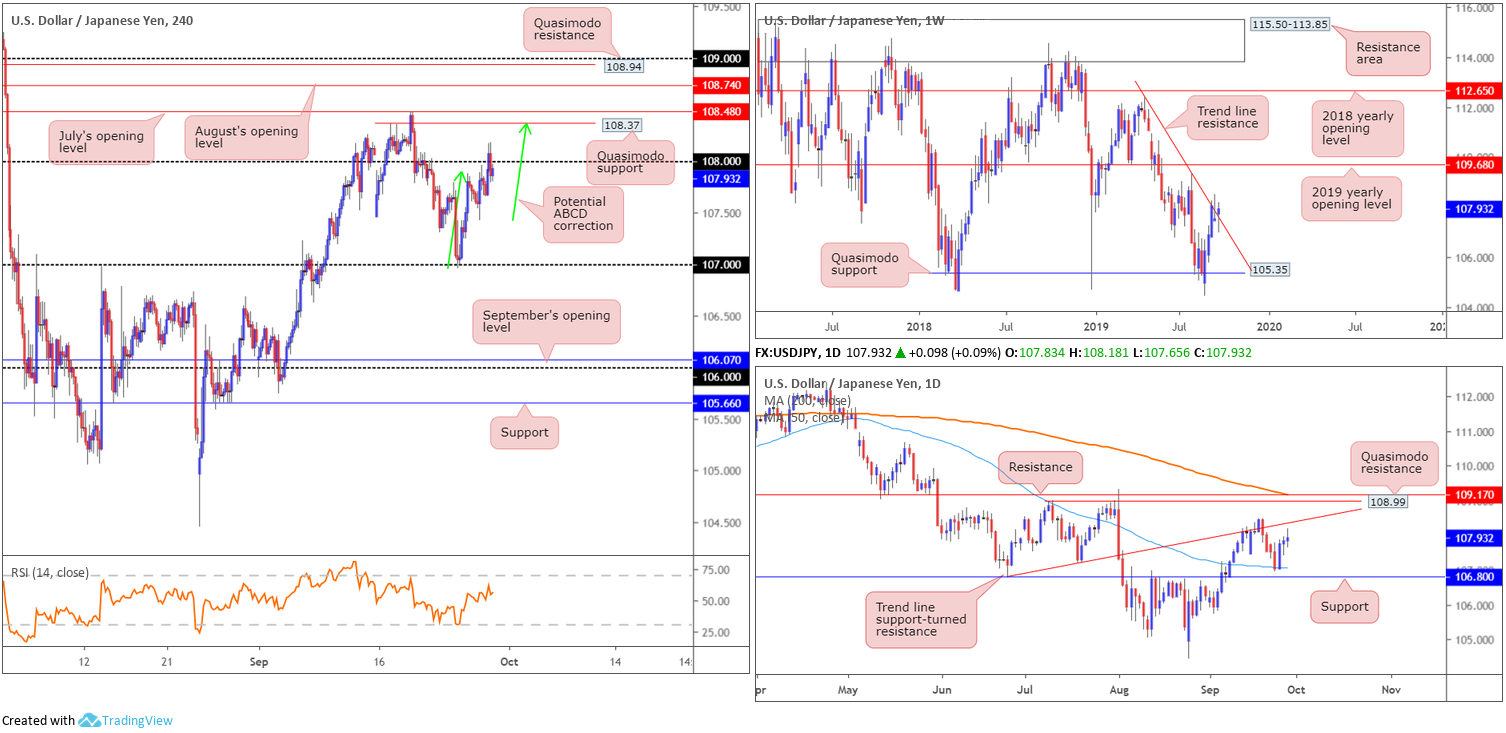
Trend line resistance (extended from the high 112.40), which held price action lower in the early stages of September, was mildly unseated last week. Entering long based on this breakout is likely of interest to many traders this week, though until the unit engulfs the upper boundary of the prior week’s range (108.47), this could simply be a run of stops for a move lower.
Additional upside, nonetheless, could have the 2019 yearly opening level at 109.68 enter the mix, but a reaction off the 109.31 high may also occur.
Daily perspective:
The 50-day SMA (blue – 107.07), sited a few points north of well-placed support at 106.80, held price action strongly higher Wednesday, placing trend line support-turned resistance (extended from the low 106.78) in view as the next upside target on the daily timeframe.
Structure positioned beyond the said trend line falls in at Quasimodo resistance at 108.99, closely trailed by another film of resistance at 109.17 and the 200-day SMA (orange – 109.18).
H4 perspective:
A brief recap of price action on Friday reveals a mild break through orders at 108 was seen, though was unable to sustain gains as market sentiment soured. A number of news outlets stated Trump officials were contemplating restricting portfolio flows into China, and delisting China firms from US stock exchanges.
Beyond 108, traders’ crosshairs are likely fixed on the Quasimodo resistance level coming in at 108.37, followed by July’s opening level at 108.48 and August’s opening level at 108.74.
Areas of consideration:
Buy stops above 108, both from traders attempting to short the figure and those bidding a breakout, are likely of interest for a possible short off H4 Quasimodo resistance at 108.37 this week. 108.37 also boasts a clear connection to the daily trend line support-turned resistance and a potential H4 ABCD correction (green arrows).
As underscored in Friday’s technical research, entry at 108.37 is an option, with a protective stop-loss order positioned either above July or August’s opening levels at 108.48 and 108.74, respectively, dependent on risk appetite. Downside expectation falls on a break back beneath 108: a cue to think about reducing risk to breakeven and liquidating a portion of the position.
USD/CAD:
Weekly gain/loss: -0.19%
Weekly close: 1.3236
Weekly perspective:
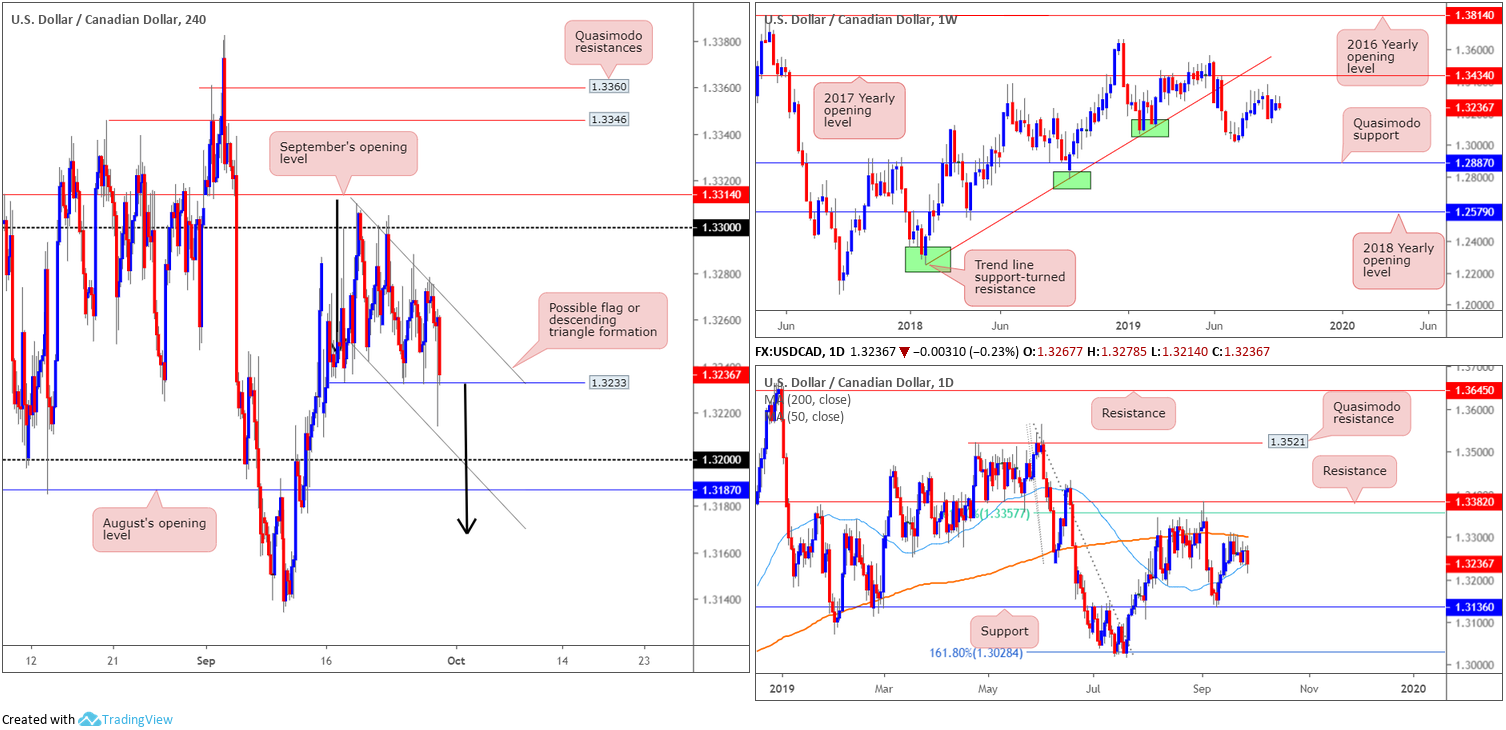
USD/CAD action, to some extent, was unresponsive last week, limited within the prior week’s range and forming an inside bearish candle formation. Resistance on the weekly timeframe is fixed at the 2017 yearly opening level drawn from 1.3434, closely lagged by trend line support-turned resistance extended from the low 1.2247. To the downside, we have the 1.3016 July 15 low representing potential support, followed by a Quasimodo formation at 1.2887.
Daily perspective:
Daily action, on the other hand, was mostly confined between the 200-day SMA (orange – 1.3301) and the 50-day SMA (blue – 1.3236) over the past week. Outside of this range, traders likely have eyes fixed on support coming in at 1.3136 and resistance drawn from 1.3382, sited just north of a 61.8% Fibonacci ratio at 1.3357.
H4 perspective:
Since September 19, the H4 candles have been carving out either a bullish flag (1.3310/1.3242) or a potential descending triangle formation. Friday witnessed the candles fall sharply and test the lower support of the triangle formed at 1.3233, though failed to print a close lower. Crude prices, down a sixth consecutive session, dropped to levels seen before the recent attacks on Saudi energy facilities as traders priced-out the geopolitical risk premium.
H4 supports to be aware of beyond the said range can be seen at the 1.32 handle and nearby August’s opening level at 1.3187. Overhead, we have the 1.33 handle and September’s opening level at 1.3314.
With a bearish inside candlestick formation taking shape on the weekly timeframe, implying a contraction of volatility (and possible expansion this week), and both daily and H4 charts forming consolidative patterns, a large move could be in store this week.
Areas of consideration:
Based on the technical chart studies, weekly price suggests a lower move this week, as does daily price after marginally closing beneath the 50-day SMA Friday. This implies H4 price may continue to fill its current flagging formation and possibly complete the descending triangle pattern, positioned beyond 1.32/1.3187 at 1.3168 (black arrows). Therefore, sellers, on the break of the H4 support level at 1.3233, are likely looking to get involved, targeting 1.3168.
USD/CHF:
Weekly gain/loss: -0.01%
Weekly close: 0.9906
Weekly perspective:
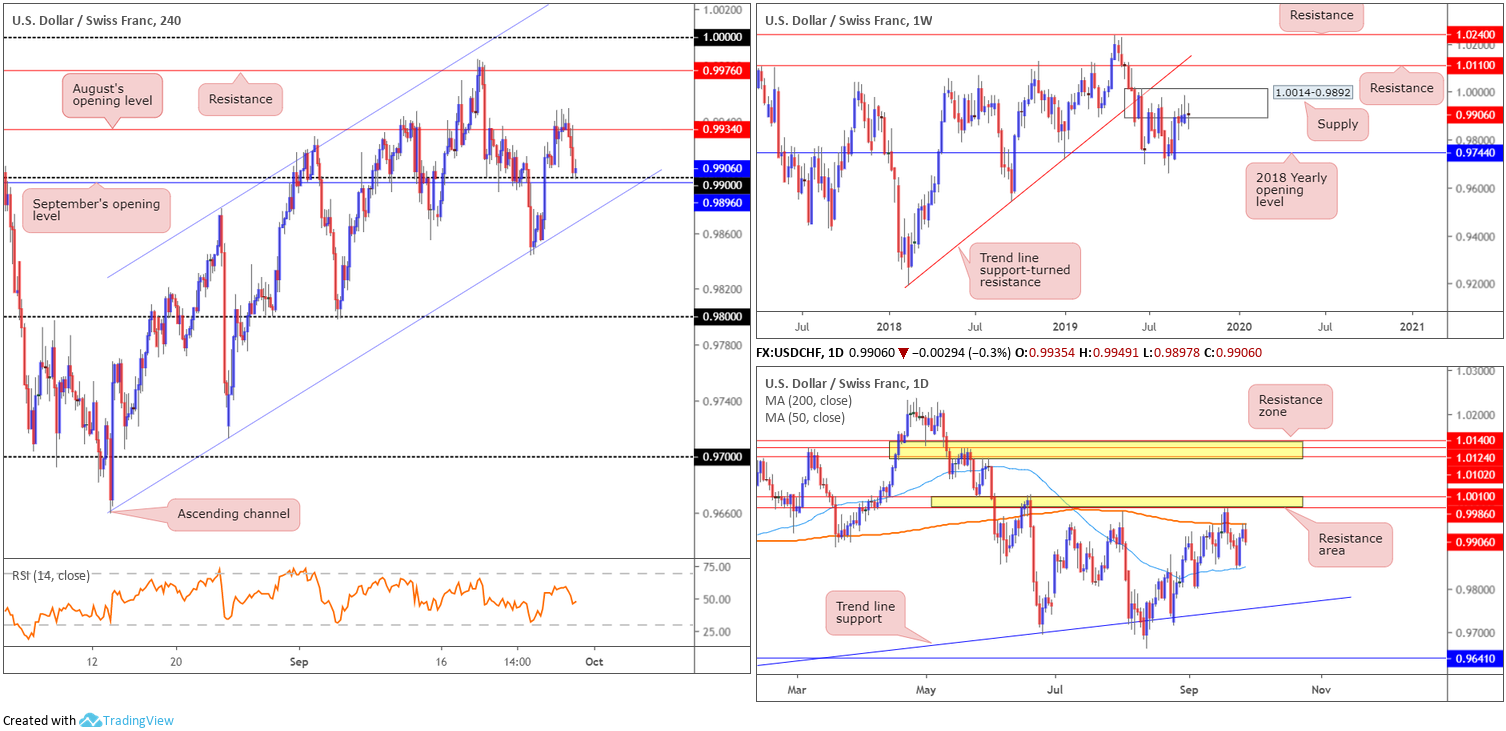
Longer-term flow has action engaging with familiar supply coming in at 1.0014-0.9892, with last week’s movement producing a clear-cut Doji candle. This implies indecision in the market.
This is the second time back to the supply area, meaning sell orders may be limited. A violation of the zone has resistance at 1.0110/trend line support-turned resistance (etched from the low 0.9187) to target. A rotation lower from here, nevertheless, has the 2018 yearly opening level at 0.9744 in view.
Daily perspective:
A closer examination of price action on the daily timeframe positions the unit at the underside of its 200-day SMA (orange – 0.9948) in the shape of a bearish outside day formation, following a two-day run off the 50-day SMA (blue – 0.9850). This infers a downward move back to the 50-day SMA this week, with a break of this line exposing trend line support extended from the low 0.9542. Above the 200-day SMA, a familiar area of resistance resides close by between 1.0010/0.9986.
H4 perspective:
Despite several attempts to seize August’s opening level at 0.9934, things turned sour amid the early hours of London Friday and price spiralled back to 0.99, which happens to be sited a few points north of September’s opening level at 0.9896.
0.99, as you can see, held ground into the close, though lacked zeal. The bearish outside day as well as weekly price shaking hands with supply (see above), will likely pressure further selling this week and overthrow orders at this psychological boundary. Though before sellers engage, notable channel support etched from the low 0.9659 will need to give way.
Areas of consideration:
According to the current technical status of this market, sellers appear to have the upper hand. A H4 close formed below the said H4 channel support, therefore, may be interpreted as a bearish indicator this week, with an initial downside target set at the 50-day SMA, followed then by a potential run to 0.98 and daily trend line support.
Entry on the breakout candle is an option, as is an entry on a retest of the broken channel support, preferably formed by way of a H4/H1 bearish candlestick signal. That way, not only have traders identified seller intent, entry and risk levels can be set according to the candlestick’s structure.
Dow Jones Industrial Average:
Weekly gain/loss: -0.20%
Weekly close: 26844
Weekly perspective:
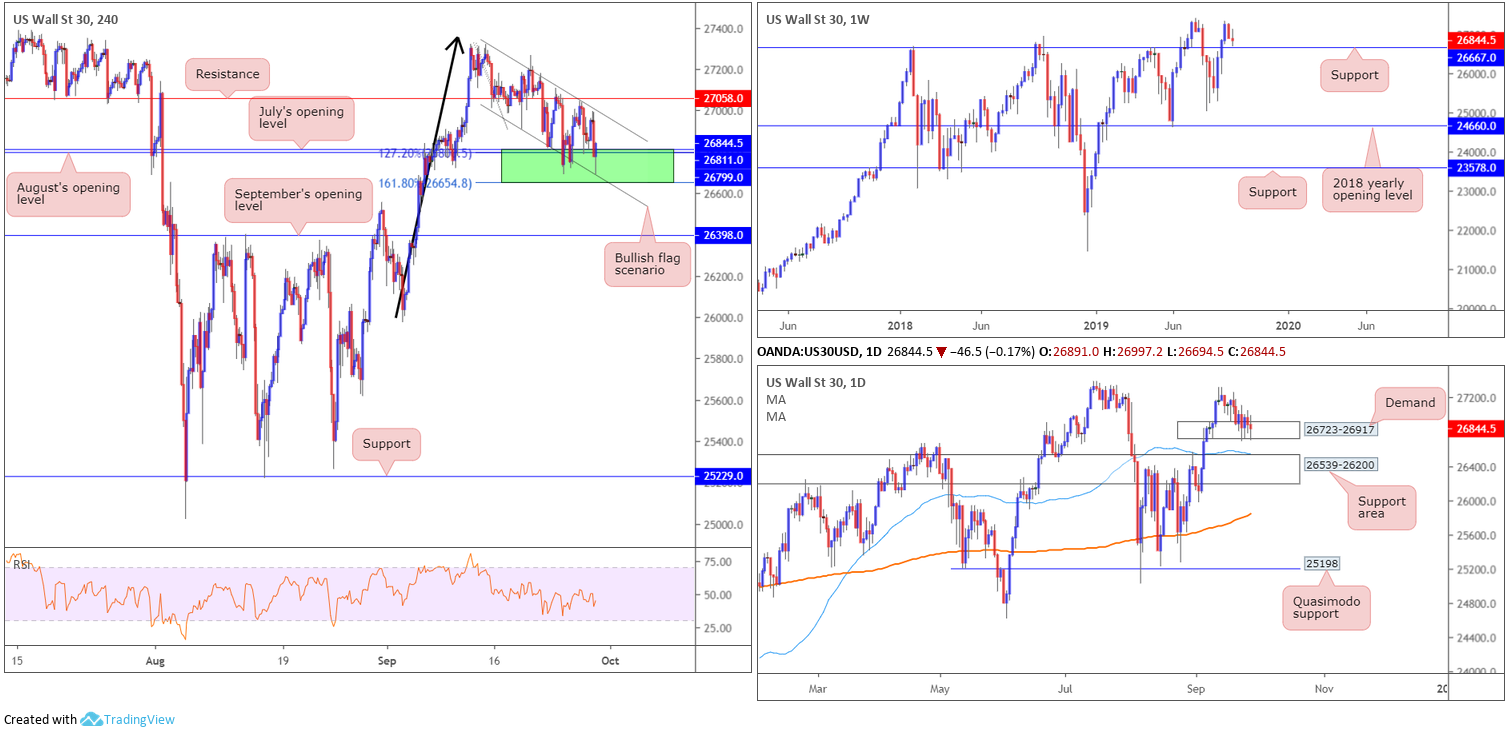
Down more than 300 points and forming a bearish inside candle formation the week prior, US equities extended losses last week erasing more than 50 points, ahead of prominent support coming in at 26667.
A decisive retest of the said support this week may entice buying, with an objective to challenge the all-time high 27388.
Daily perspective:
In response to recent selling, daily activity entered the parapets of fresh demand priced in at 26723-26917 and clipped the lower edge of the zone on a couple of occasions.
Failure to hold prices higher from here this week could result in the support area at 26539-26200 entering the fray, which aligns closely with a 50-day SMA (blue – 26542).
H4 perspective:
Major US equity indexes slipped lower Friday, amid reports the Trump administration were contemplating restricting portfolio flows into China and delisting China firms from US stock exchanges. The Dow Jones Industrial Average fell 70.87 points, or 0.26%; the S&P 500 also fell 15.83 points, or 0.53% and the tech-heavy Nasdaq 100 erased 90.41 points, or 1.16%.
Concerning the technical picture on the H4 chart, the support zone marked in green at 26654/26811, comprised of August and July’s opening levels at 26799 and 26811, respectively, the 127.2% Fibonacci extension value at 26800 and the 161.8% Fibonacci extension at 26654, remains intact. In addition to this, since topping mid-September the candles have been compressing within what appears to be a bullish flag scenario (27321/26908). A firm breakout of this pattern, followed by a run above resistance parked at 27058, all-time highs mentioned above at 27388 are then likely in the offing as the next upside target.
Areas of consideration:
A test of weekly support at 26667 could inspire a move higher this week. Confirmation of buyer intent, according to H4 structure, may materialise in the shape of a H4 candle close above the bullish flag highlighted above. Stop-loss orders can conservatively be positioned beneath the bullish flag’s lower limit, as the take-profit target, measured as the size of the preceding move (the black arrow) added to the breakout point, offers a favourable risk/reward ratio.
Traders, however, are still urged to consider the all-time high 27388 as the initial take-profit target, even if only as a cue to reduce risk to breakeven.
XAU/USD (GOLD):
Weekly gain/loss: -1.32%
Weekly close: 1496.7
Weekly perspective:
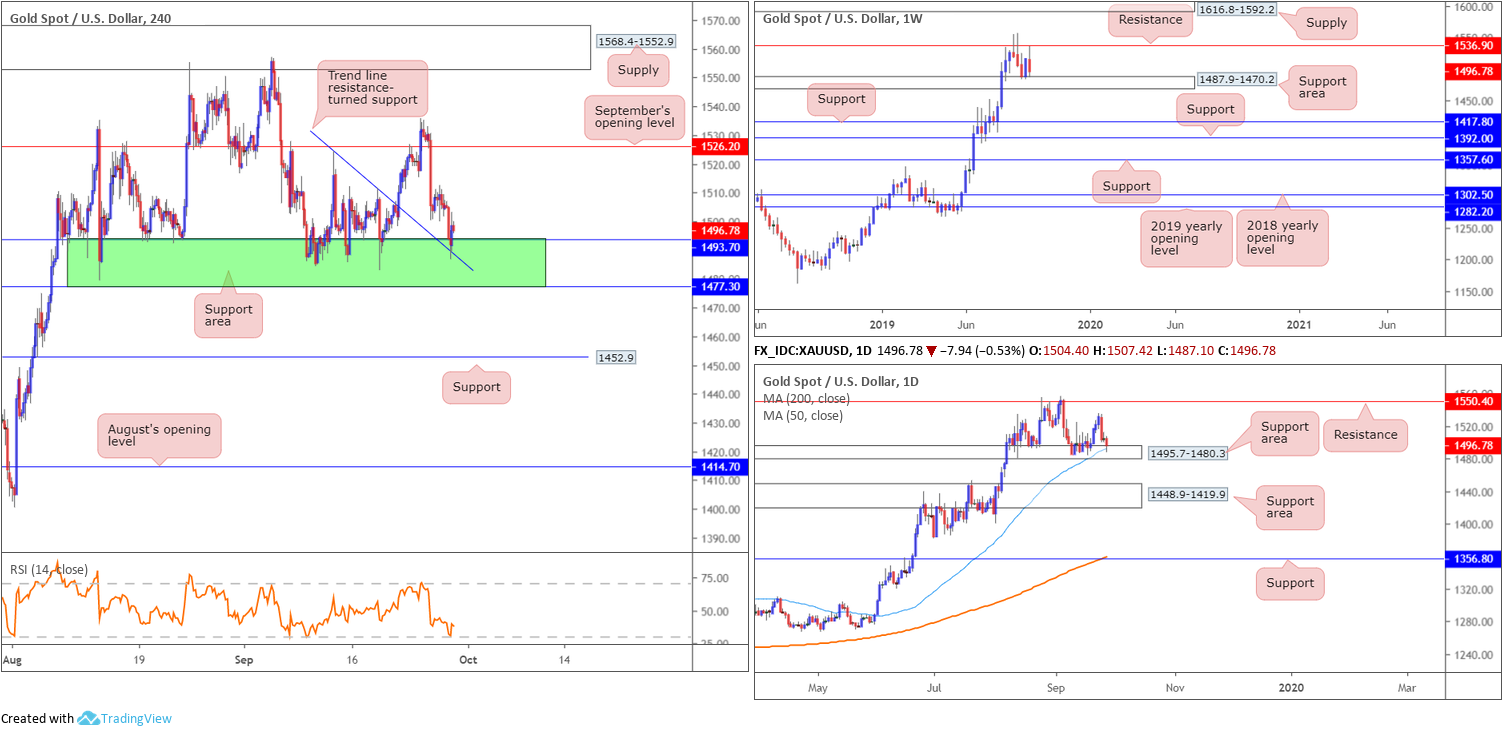
Recent selling came about a few points south of weekly resistance at 1536.9 last week, guiding price action towards a support area coming in at 1487.9-1470.2. This is now considered a consolidatory phase within the overall uptrend.
A breakout north has supply at 1616.8-1592.2 to target, whereas a move lower could extend as far south as support drawn from 1417.8.
Daily perspective:
In similar fashion to weekly structure, daily price wrapped up the week testing a support area seen at 1495.7-1480.3 (glued to the upper limit of the said weekly support zone) and corresponding 50-day SMA (blue – 1492.8). From this angle, though, the next upside target falls in a touch higher than weekly resistance (1536.9) at 1550.4, while a move lower could bring in the support area at 1448.9-1419.9.
H4 perspective:
Since mid-August, the H4 candles found support between 1477.3/1493.7 (green), which boasts a connection to both the weekly support area at 1487.9-1470.2 and the daily support area at 1495.7-1480.3. In addition to this, a local trend line resistance-turned support (taken from the high 1524.2) bolsters the said H4 zone and held price action higher into the close Friday.
Beyond the H4 support area, we have H4 support fixed at 1452.9, sited a few points north of the daily support area mentioned above at 1448.9-1419.9.
Areas of consideration:
In view of the technical structure, the outlook remains unchanged as we head into a fresh week.
The retest of the said H4 support area at 1477.3/1493.7 is likely of interest to buyers, given its connecting confluence, targeting September’s opening level at 1526.2 as the initial take-profit zone.
Entry and risk parameters are, of course, trader dependent. Some will simply enter long at current price and position stops below the H4 support zone accordingly, while others may prefer to wait and see how the H4 candles behave before pulling the trigger.
The accuracy, completeness and timeliness of the information contained on this site cannot be guaranteed. IC Markets does not warranty, guarantee or make any representations, or assume any liability regarding financial results based on the use of the information in the site.
News, views, opinions, recommendations and other information obtained from sources outside of www.icmarkets.com.au, used in this site are believed to be reliable, but we cannot guarantee their accuracy or completeness. All such information is subject to change at any time without notice. IC Markets assumes no responsibility for the content of any linked site.
The fact that such links may exist does not indicate approval or endorsement of any material contained on any linked site. IC Markets is not liable for any harm caused by the transmission, through accessing the services or information on this site, of a computer virus, or other computer code or programming device that might be used to access, delete, damage, disable, disrupt or otherwise impede in any manner, the operation of the site or of any user’s software, hardware, data or property.


