
Waiting for lower timeframe confirmation is our main tool to confirm strength within higher timeframe zones, and has really been the key to our trading success. It takes a little time to understand the subtle nuances, however, as each trade is never the same, but once you master the rhythm so to speak, you will be saved from countless unnecessary losing trades. The following is a list of what we look for:
- A break/retest of supply or demand dependent on which way you’re trading.
- A trendline break/retest.
- Buying/selling tails/wicks – essentially we look for a cluster of very obvious spikes off of lower timeframe support and resistance levels within the higher timeframe zone.
We typically search for lower-timeframe confirmation between the M15 and H1 timeframes, since most of our higher-timeframe areas begin with the H4. Stops are usually placed 1-3 pips beyond confirming structures.
EUR/USD:
Weekly gain/loss: – 172 pips
Weekly closing price: 1.1605
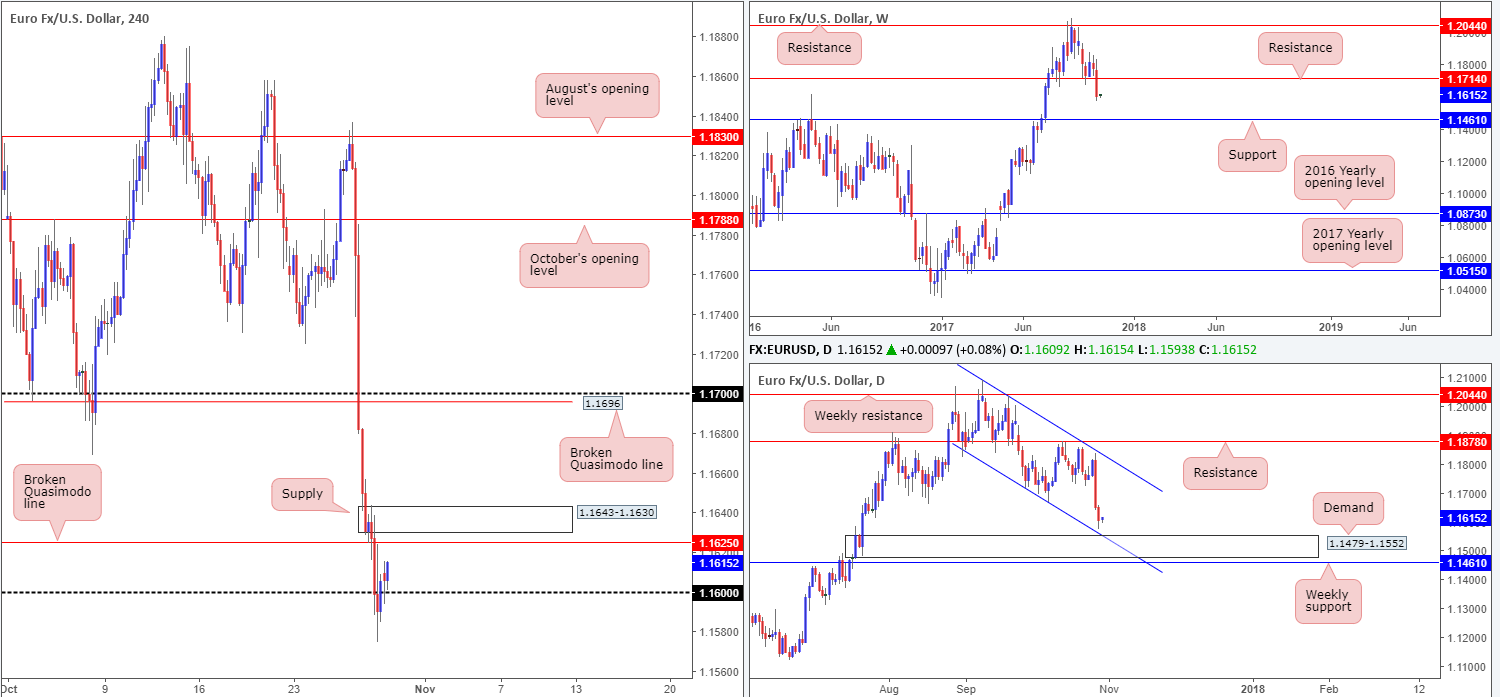
Down 1.50% on the week, we can see that weekly price chewed its way through a support level at 1.1714 (now acting resistance), and possibly cleared the trail south for further selling down to support penciled in at 1.1461.
The story on the daily timeframe, nonetheless, shows that the buyers may make a stand ahead of the aforementioned weekly support. Sitting directly above this level is a strong-looking demand area at 1.1479-1.1552, which happens to unite beautifully with a channel support etched from the low 1.1717.
A quick recap of Friday’s trade on the H4 timeframe reveals that the candles remained under pressure on Friday, following the ECB’s dovish turn announced on Thursday. Hotter-than-expected advanced US GDP figures also helped fuel downside, forcing the shared currency sub 1.16. Regardless of the unit mildly pairing losses and closing back above 1.16 during the last hours, the day ended down 0.38%.
Suggestions: Owing to both weekly and daily action showing room for the pair to dive lower this week, our desk is biased to the downside until the aforementioned daily demand/channel support is brought into the fray.
On that basis, a short from the nearby broken H4 Quasimodo line at 1.1625 could be an option today. Besides having a reasonably clear run to the downside on the higher timeframes, there’s also a H4 supply area sitting directly above the line at 1.1643-1.1630. The first area of concern, should one manage to pin down a trade here, would be the 1.16 handle, which is where we’d look at reducing risk to breakeven. Ultimately though, we would be watching for a H4 close below 1.16, as this would likely open the gates down to the mid-level support 1.1550 – an ideal take-profit target as it is plotted around the top edge of the current daily demand.
Data points to consider: German retail sales m/m at 7am; Spanish flash CPI y/y and Spanish flash GDP q/q at 8am; US core PCE index m/m and US personal spending/income m/m at 12.30pm GMT.
Levels to watch/live orders:
- Buys: Flat (stop loss: N/A).
- Sells: 1.1625 region (stop loss: 1.1645).
GBP/USD:
Weekly gain/loss: – 61 pips
Weekly closing price: 1.3124
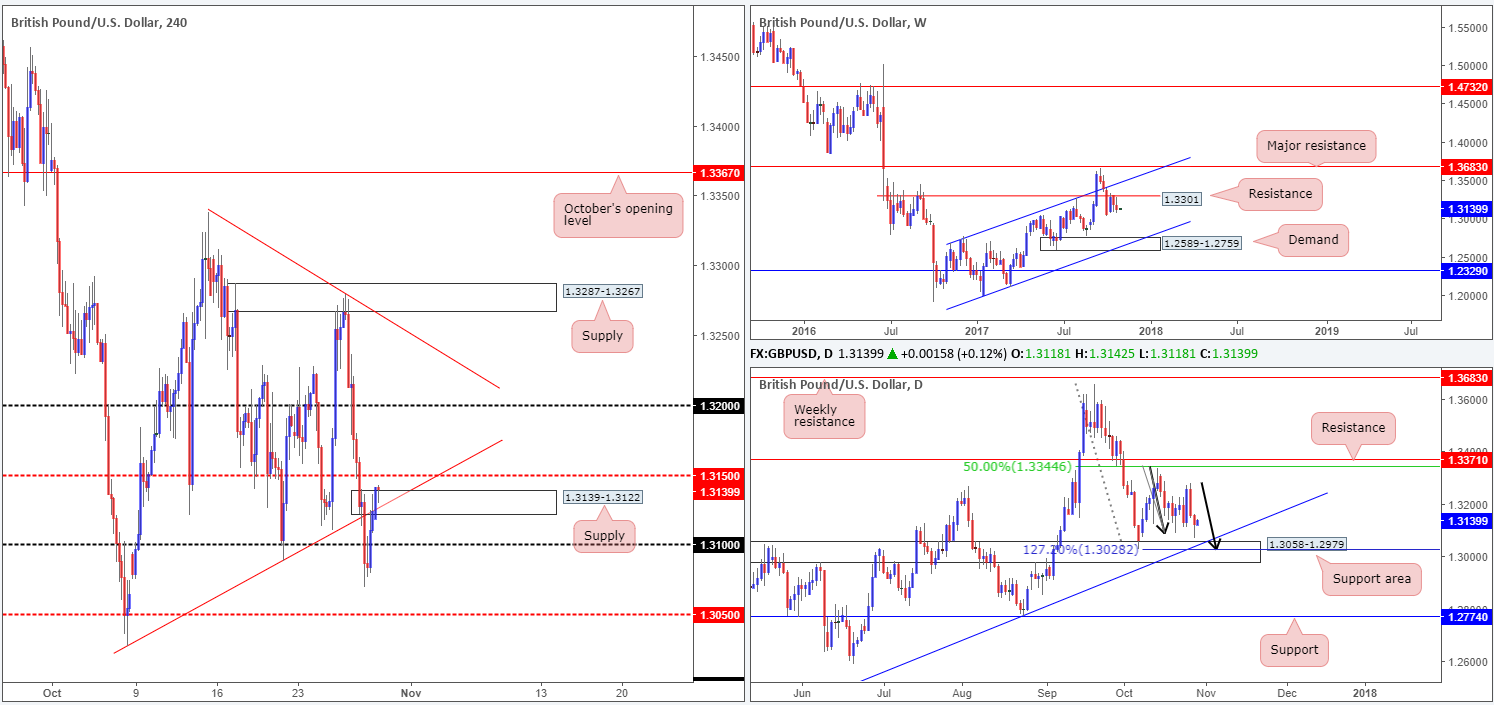
Down 0.46% on the week, the GBP/USD sustained its second consecutive loss beneath a weekly resistance level coming in at 1.3301. Further losses from this region would likely place weekly demand at 1.2589-1.2759 in the spotlight, along with its merging weekly channel support drawn from the low 1.1986.
Turning our attention to the daily timeframe, price is currently seen lurking just ahead of a support area at 1.3058-1.2979. What makes this zone stand out, however, is its association with a trendline support etched from the low 1.2108 and an AB=CD 127.2% ext. point at 1.3028.
Looking across to the H4 timeframe, we can see that the unit maintained its heavily offered tone throughout most of the London session on Friday, diving sub 1.31. Despite this, the candles managed to mildly trim gains during the US segment, breaking back above 1.31 and shaking hands with supply at 1.3139-1.3122 (converges with a trendline resistance taken from the low 1.3027) into the closing bell.
Suggestions: Neither a long nor short seems attractive at the moment. Here’s why:
- By entering long in this market, you’d effectively be going up against potential weekly sellers and the current H4 supply.
- Selling would make sense from the weekly timeframe, but it’d be extremely rash according to the daily timeframe given the nearby support area. In addition to this, 25 pips below current price sits the 1.31 handle: a potential support.
Data points to consider: UK Net lending to individuals m/m at 9.30; US core PCE index m/m and US personal spending/income m/m at 12.30pm GMT.
Levels to watch/live orders:
- Buys: Flat (stop loss: N/A).
- Sells: Flat (stop loss: N/A).
AUD/USD:
Weekly gain/loss: – 141 pips
Weekly closing price: 0.7672
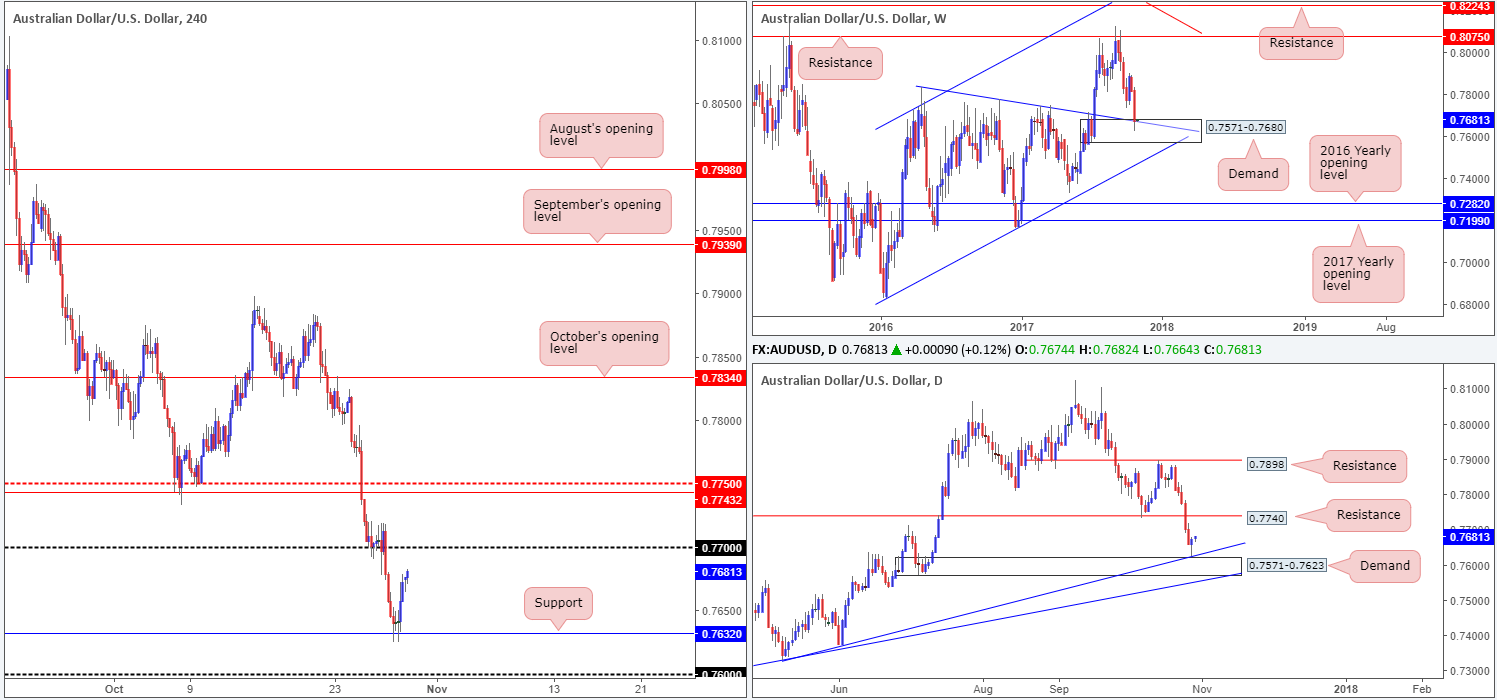
The AUD/USD witnessed a rather aggressive selloff last week, consequently stamping in its second consecutive weekly loss. Down 1.79%, the pair ended the week bumping heads with a weekly trendline support taken from the high 0.7835 that intersects with a strong-looking weekly demand based at 0.7571-0.7680.
Alongside the noted weekly demand, a daily demand area at 0.7571-0.7623 was also brought into the fray on Friday, which, as you can probably see, happens to merge beautifully with a daily trendline support extended from the low 0.7328. The other key thing to note is the daily buying tail (pin bar) that formed as a result of the buying seen from the aforesaid daily demand.
For those who read Friday’s report you may recall that the team highlighted a possible buy zone at 0.76/0.7632. Comprised of the psychological band 0.76 and a H4 support at 0.7632, this area, given that it’s bolstered by a daily/weekly demand, was a high-probability reversal zone, in our technical view.
Suggestions: As we’re currently long the DJIA, taking a long on the AUD/USD was not of interest due to its correlation to the DOW. Should any of our readers have taken the Aussie long call, we would strongly recommend having your stops at breakeven right now, and your first take-profit target set at 0.77.
Data points to consider: US core PCE index m/m and US personal spending/income m/m at 12.30pm GMT.
Levels to watch/live orders:
- Buys: Flat (stop loss: N/A).
- Sells: Flat (stop loss: N/A).
USD/JPY:
Weekly gain/loss: + 15 pips
Weekly closing price: 113.65
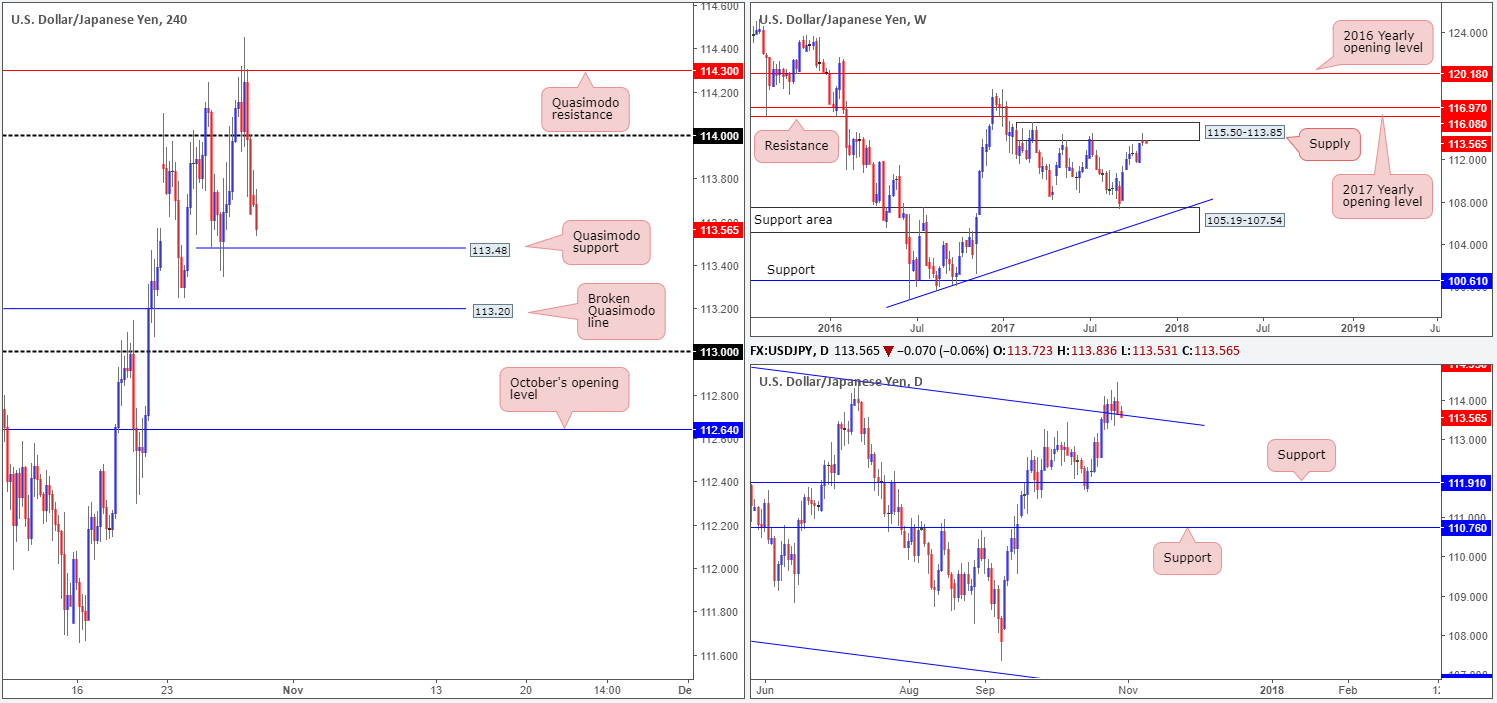
Weekly price, as you can see, chalked up a clear selling wick within the walls of a supply area coming in at 115.50-113.85. This supply zone has held price lower on two separate occasions so far this year. Therefore, there’s a chance that we may see history repeat itself.
Daily action on the other hand, recently closed above a channel resistance taken from the high 115.50, and is now seen retesting the line as support. Should the barrier hold, this potentially opens up the path north to a Quasimodo resistance seen at 114.95 (not seen on the screen).
A closer look at price action on the H4 timeframe shows that the unit whipsawed through a H4 Quasimodo resistance at 114.30, following Friday’s US GDP data. Although the figures came in better than expected, the pair failed to sustain gains. As a result, the 114 handle was quickly taken out, with price concluding the week’s trade forming a full-bodied bearish H4 candle.
Suggestions: The next downside target on the H4 timeframe can be seen at 113.48: a Quasimodo support. Buying from this angle may hang together with the current daily channel (support), but would simultaneously place one in the direct line of fire with the noted weekly supply! The same goes for selling. While weekly supply indicates a sell, both H4 and daily structures, as you already know, do not currently share this bias.
Data points to consider: US core PCE index m/m and US personal spending/income m/m at 12.30pm GMT.
Levels to watch/live orders:
- Buys: Flat (stop loss: N/A).
- Sells: Flat (stop loss: N/A).
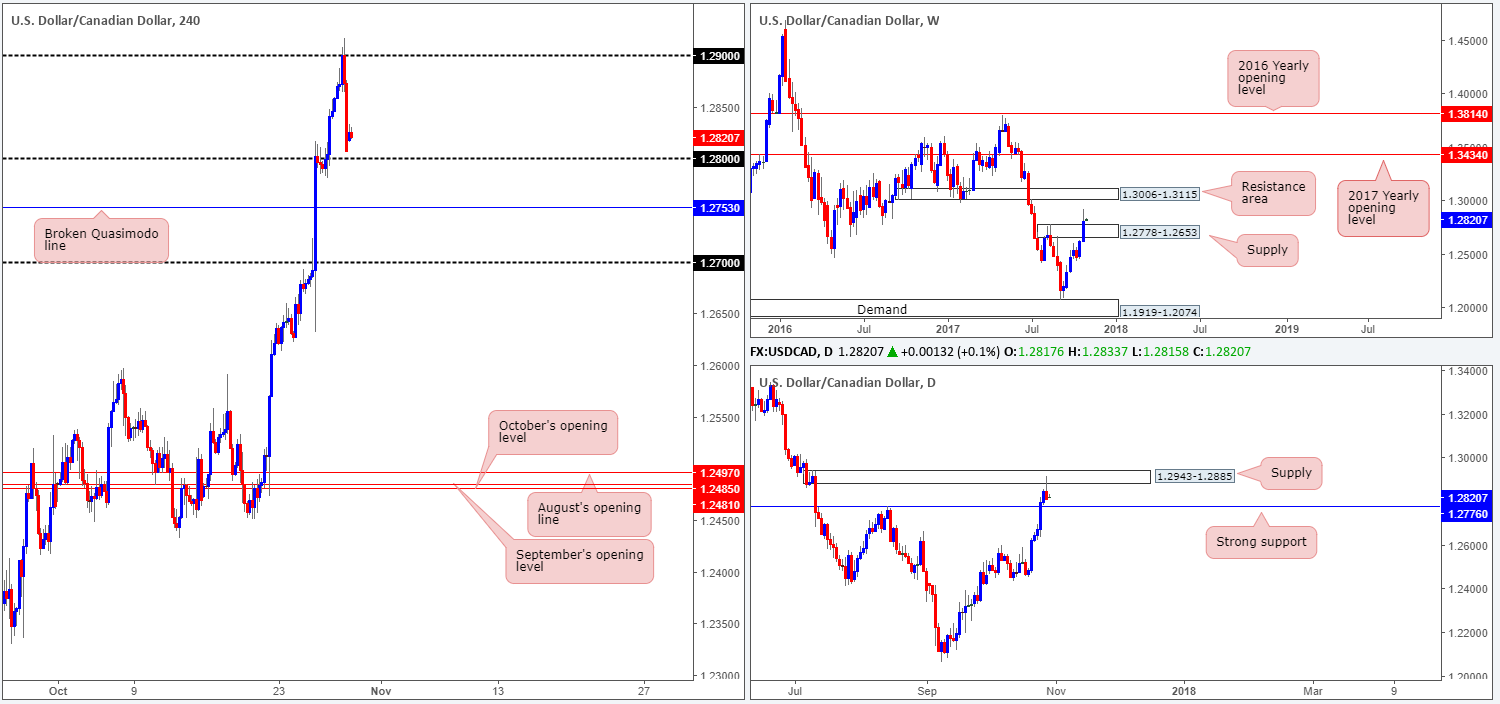
USD/CAD:
Weekly gain/loss: + 186 pips
Weekly closing price: 1.2807
Over the course of last week’s trading, the USD/CAD forced itself above a weekly supply zone at 1.2778-1.2653, reaching a high of 1.2916. As you can see, this has potentially opened up the path north to a resistance area at 1.3006-1.3115.
Before weekly buyers can lift price higher though, the daily supply at 1.2943-1.2885 will need to be consumed. This area, albeit a somewhat small zone, held price lower on Friday and penciled in a strong-looking selling wick. However, without a strong bearish close below nearby daily support at 1.2760, this holds little value, in our humble opinion.
Failing to maintain a bullish presence above 1.29, despite upbeat US GDP figures, Friday’s action energetically moved to the downside and wrapped up the week a few pips ahead of 1.28 in the shape of a full-bodied bearish candle.
Suggestions: A long from 1.28 could be an option today. Besides weekly price suggesting further upside might be at hand, there is a nearby daily support mentioned above at 1.2760 bolstering 1.28. With that in mind, do remain aware of the possibility of a fakeout being seen down to the noted daily support. Remember, psychological levels are prone to fakeouts due to the large amount of liquidity placed around these numbers.
To be on the safe side, why not consider waiting for H4 candle action to prove (a H4 full or near full-bodied candle) buyer intent exists from 1.28 before committing? This would help avoid any nasty fakeout seen to the downside.
Data points to consider: US core PCE index m/m and US personal spending/income m/m at 12.30pm GMT.
Levels to watch/live orders:
- Buys: 1.28 region ([waiting for a reasonably sized H4 bullish candle to form – preferably a full or near-full-bodied candle – is advised] stop loss: ideally beyond the candle’s tail).
- Sells: Flat (stop loss: N/A).
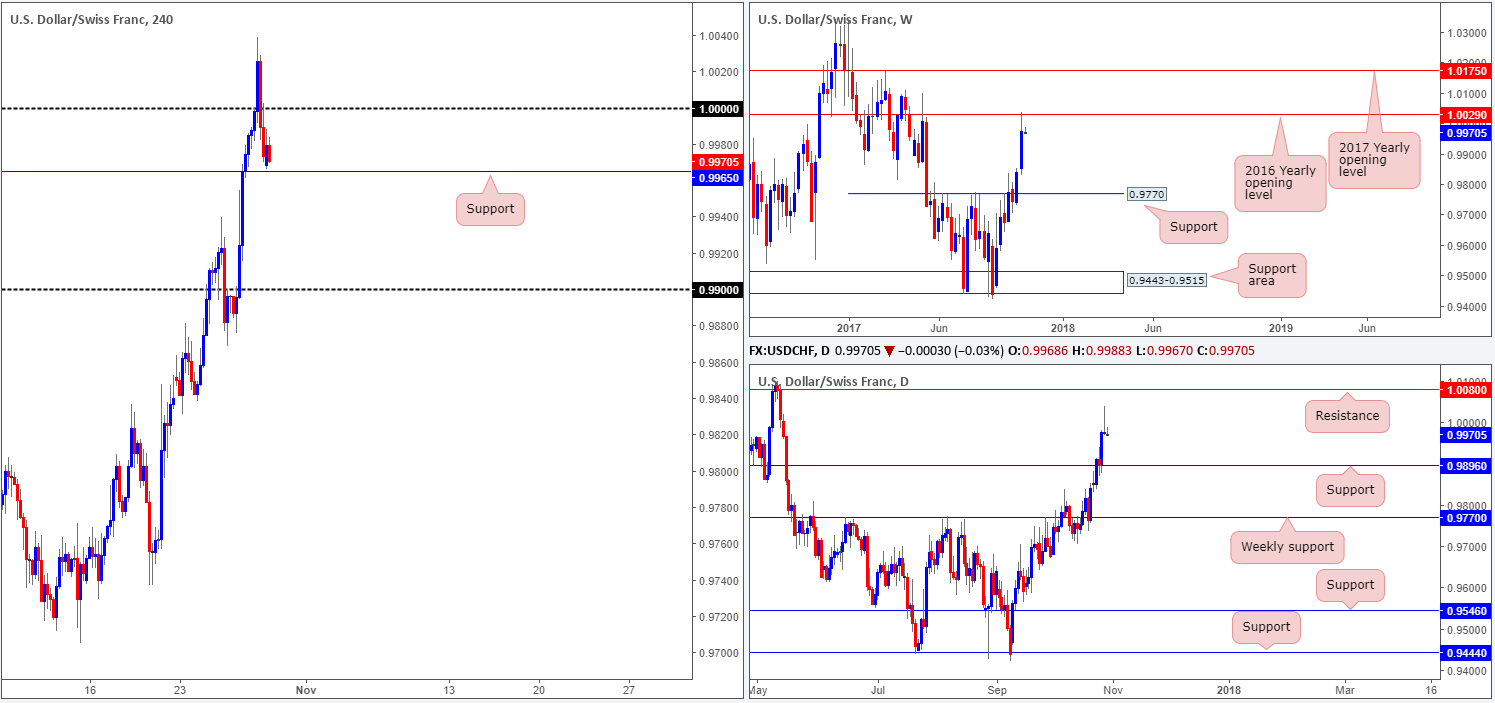
USD/CHF:
Weekly gain/loss: + 134 pips
Weekly closing price: 0.9973
Although the Swissie grew 1.36% on the week, marking its second consecutive weekly gain, the 2016 yearly opening level at 1.0029 (weekly chart) was brought into the picture. These yearly levels are considered, at least by the team here, to be heavy-weight barriers.
After the pair crossed swords with the noted yearly level, traders might have also noticed that daily price penciled in a fine-looking bearish selling wick. This, coupled with the weekly picture, may very well be enough to force the unit to revisit a daily support etched from 0.9896.
In Friday’s report, we highlighted that we would be watching 1.0029/1.0000 for possible shorts. We also emphasized the importance of waiting for H4 price to chalk up a reasonably sized bearish candle from here, preferably a full or near-full-bodied candle. As can be seen from the H4 chart, such a candle was seen and, in our opinion, was a nice-looking sell opportunity.
Suggestions: Although we never took the sell trade highlighted above (largely because we’re already long the DOW – see below), the pair is likely going to head lower and take out nearby H4 support at 0.9965. This will, according to our technicals, open up the runway south down to 0.99, which happens to be positioned a few pips above the aforementioned daily support. As such, for those now short, we would advise holding the position and waiting for a push lower.
Data points to consider: US core PCE index m/m and US personal spending/income m/m at 12.30pm GMT.
Levels to watch/live orders:
- Buys: Flat (stop loss: N/A).
- Sells: Flat (stop loss: N/A).
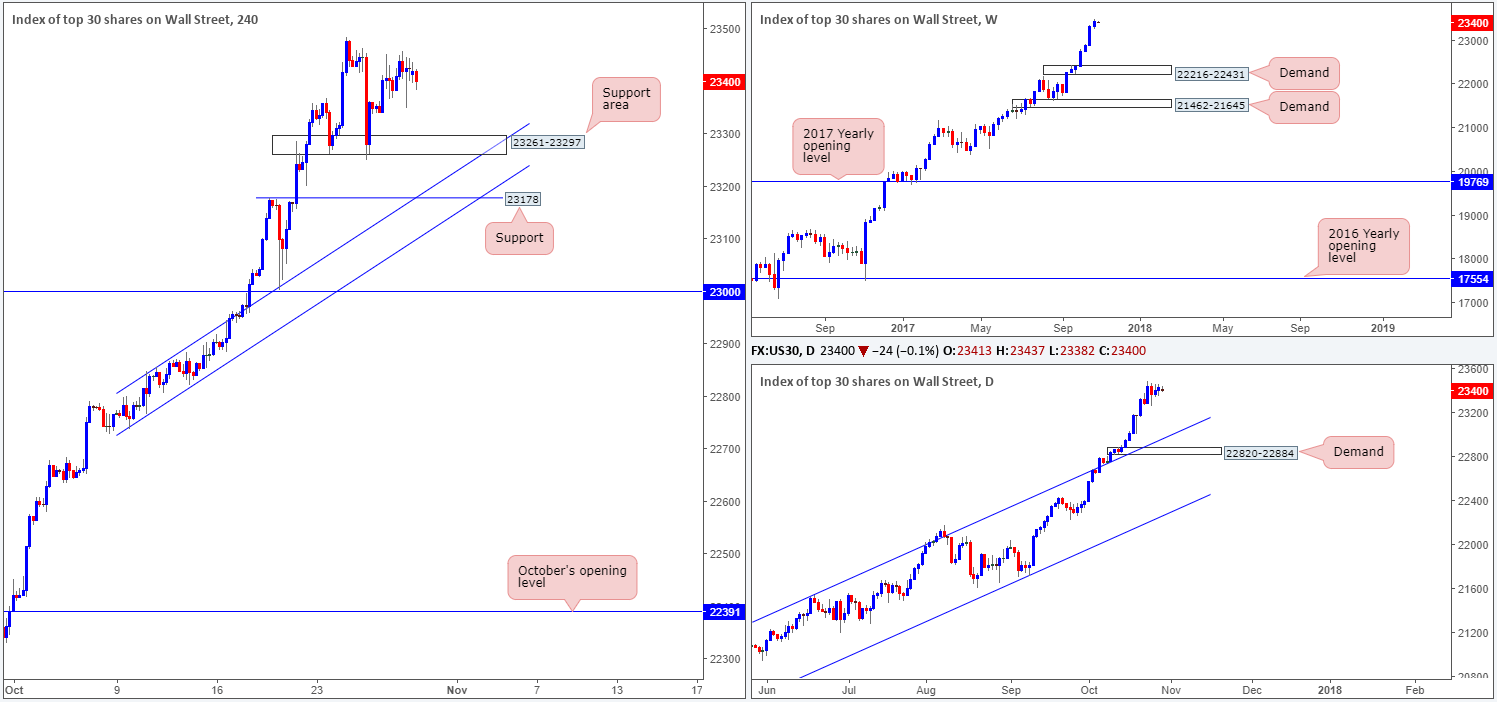
DOW 30:
Weekly gain/loss: + 103 points
Weekly closing price: 23425
US stocks extended higher for a seventh consecutive session last week, dragging the index up to a fresh record high of 23484. Should the unit pullback this week, the next weekly downside target in view is demand coming in at 22216-22431. On the daily timeframe, the closest demand base can be seen at 22820-22884. However, price would first have to get through potential support from the channel resistance-turned support taken from the high 21541.
For those who read our previous reports you may recall that our desk recently entered long at 23356, with stops positioned below the H4 support area (23261-23297) at 23240. The long was based on price responding from a H4 support area and forming a nice-looking near-full-bodied H4 bullish candle.
Suggestions: What we’re looking for from here is a push up to fresh highs. This will be our cue to reduce risk to breakeven and begin thinking about taking some profits off the table.
Data points to consider: US core PCE index m/m and US personal spending/income m/m at 12.30pm GMT.
Levels to watch/live orders:
- Buys: 23356 ([live] stop loss: 23240).
- Sells: Flat (stop loss: N/A).
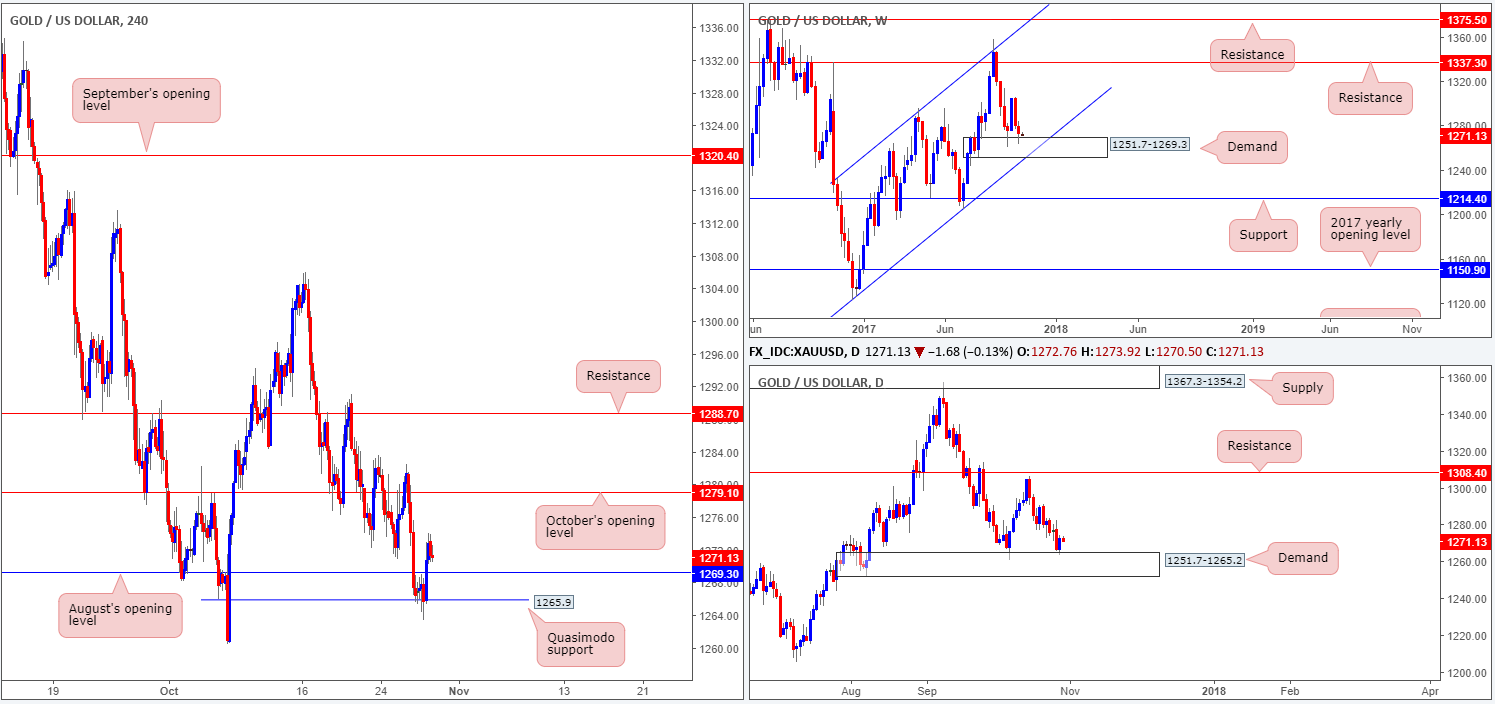
GOLD:
Weekly gain/loss: – $7
Weekly closing price: 1272.8
With the US dollar up 1.86% against its G10 peers last week, it was no surprise to see that gold ended the week in the red.
Extending prior week’s losses, weekly price dived lower last week and shook hands with a demand base at 1251.7-1269.3, which happens to merge with a channel support etched from the low 1122.8. Supporting the aforementioned weekly demand is a daily demand (housed within the lower limits of the weekly zone) at 1251.7-1265.2.
Zooming in for a closer look on the H4 timeframe, we can clearly see the Quasimodo support at 1265.9 held firm on Friday, forcing the candles back above August’s opening level at 1269.3. With both weekly and daily structures seen in play right now, a long on any retest seen at 1269.3 could be an option.
Suggestions: Put simply, watch for H4 price to retest 1269.3 as support. Should the metal hold firm and print a full or near-full-bodied bull candle, a long from this angle would then be considered valid, in our opinion. The first take-profit target, at least for us, would be October’s opening level at 1279.1.
Levels to watch/live orders:
- Buys: 1269.3 region ([waiting for a reasonably sized H4 bullish candle to form – preferably a full or near-full-bodied candle – is advised] stop loss: ideally beyond the candle’s tail).
- Sells: Flat (stop loss: N/A).


