
A note on lower timeframe confirming price action…
Waiting for lower timeframe confirmation is our main tool to confirm strength within higher timeframe zones, and has really been the key to our trading success. It takes a little time to understand the subtle nuances, however, as each trade is never the same, but once you master the rhythm so to speak, you will be saved from countless unnecessary losing trades. The following is a list of what we look for:
- A break/retest of supply or demand dependent on which way you’re trading.
- A trendline break/retest.
- Buying/selling tails/wicks – essentially we look for a cluster of very obvious spikes off of lower timeframe support and resistance levels within the higher timeframe zone.
- Candlestick patterns. We tend to only stick with pin bars and engulfing bars as these have proven to be the most effective.
We search for lower timeframe confirmation between the M15 the H1 timeframes, since most of our higher-timeframe areas begin with the H4. Stops are usually placed 5-10 pips beyond confirming structures.
EUR/USD:
Weekly gain/loss: – 108 pips
Weekly closing price: 1.1109
Weekly opening price: 1.1112
Weekly view: Last week’s decline now marks the fourth consecutive bearish week for this pair. The big question for us, and most probably the majority of traders on the EUR at the moment is: how long can the sellers continue pushing this market lower? Well, from a technical standpoint, with price trading from a major area of supply at 1.1533-1.1278 that has capped upside since May 2015, we feel further selling is possible down to support drawn from 1.0796.
Daily view: Thanks to Friday’s drive lower, the shared currency is now crossing swords with demand seen at 1.1057-1.1108. Should buyers defend this area this week, we’ll be looking for price to advance north to supply coming in at 1.1215-1.1264. On the flip side, a cut through this zone could open the doors to further downside towards support at 1.0824.
H4 view: A quick recap of Friday’s sessions on the H4 chart show price was unable to push above the 1.12 mark and instead heavily sold-off going into London trading. This was further boosted by comments from Fed Chair Janet Yellen regarding a possible interest rate hike in the near future. We do hope some of our readers jumped in on this as it was something we mentioned to watch for in Friday’s report.
Owing to a stable open this morning, price is now hovering just ahead of demand logged in at 1.1057-1.1096. This demand, as you can probably see, sits within the extremes of daily demand mentioned above at 1.1057-1.1108, and is also supported by a psychological barrier at 1.11.
Our suggestions: Given the confluence seen at the current H4 demand base, we feel it is worth keeping an eye on this area today for a possible entry long from here. However, trading from this region without lower timeframe confirmation is not something our team would stamp high probability due to what we’ve noted above on the weekly chart (see the top of this report for ways of looking for lower timeframe confirmation). Should one manage to lock down a position from this base, we’d personally target the 1.1143 region, followed by the 1.12 handle, and then maybe the underside of daily supply we talked about above at 1.1215-1.1264
In closing, do remember that today’s liquidity will likely be thin due to both the UK and US on vacation.

Levels to watch/live orders:
- Buys: 1.1057-1.1096 [Tentative – confirmation required] (Stop loss: dependent on where one confirms this area).
- Sells: Flat (Stop loss: N/A).
GBP/USD:
Weekly gain/loss: + 117 pips
Weekly closing price: 1.4612
Weekly opening price: 1.4602
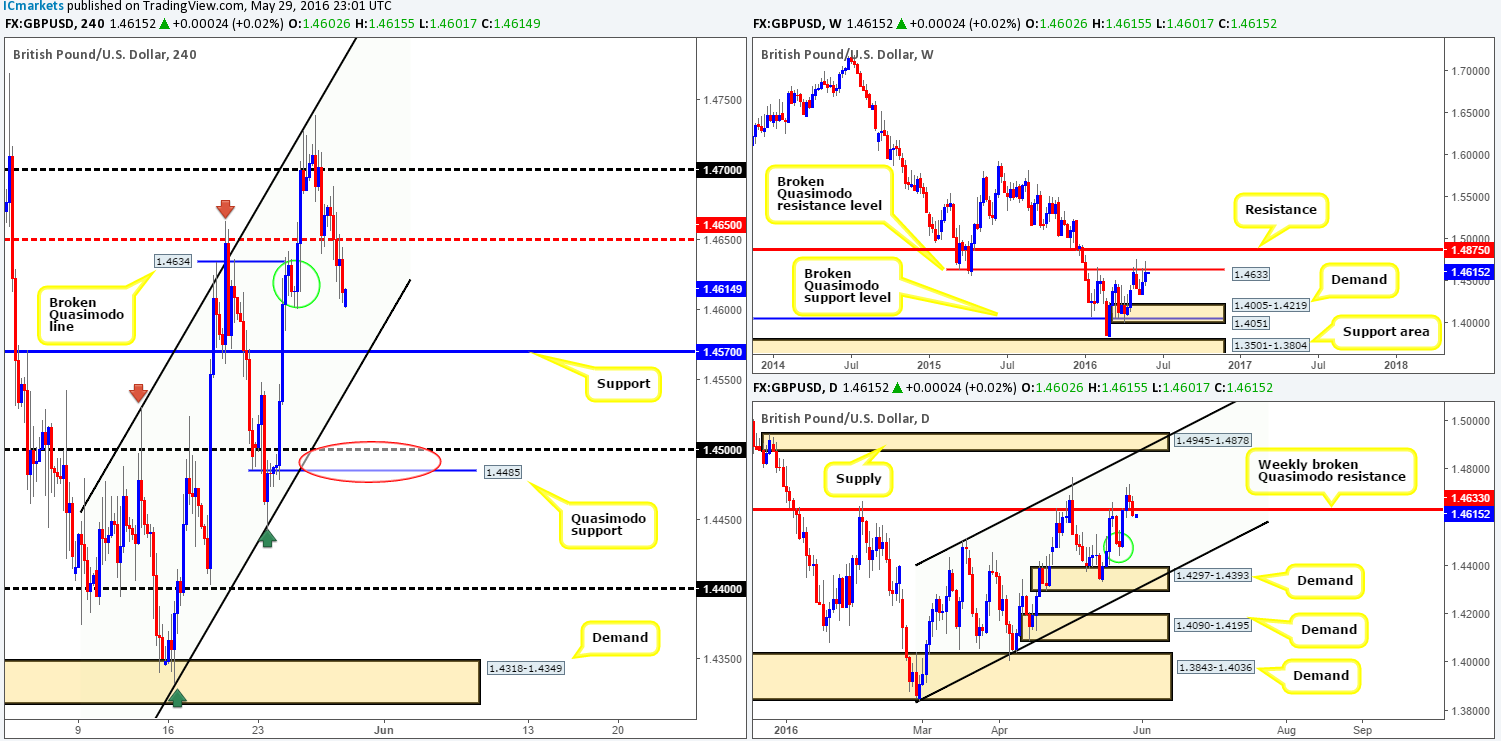
Weekly view: As we can all see from the weekly chart this morning the GBP/USD posted its second consecutive gain last week, netting around 120 pips by the close. Nevertheless, with price sporting a small end-of-week correction from the broken Quasimodo barrier (BQM) seen at 1.4633, this could indicate that the sellers may take over this market this week.
Daily view: With daily action closing beneath the above said weekly BQM level last week, we may see price head for demand seen marked with a green circle at 1.4442-1.4503 this week. However, do take note of the more prominent demand base seen just below at 1.4297-1.4393, which converges with a channel support extended from the low 1.3835.
H4 view: Following Thursday’s rebound from the channel resistance taken from the high 1.4530, Friday’s action burst through bids at the mid-way support 1.4650 and closed deep within a H4 demand seen marked with a green circle at 1.4601-1.4631 (important area as it formed from the break of the Quasimodo line at 1.4634). Consequent to a small gap south this morning of around ten pips, price appears to have taken out the majority of bids within the aforementioned H4 demand, and quite possibly opened the trapdoor for a move down to support at 1.4570.
Our suggestions: Given the higher-timeframe picture (see above), entering long from the H4 support at 1.4570 is a risky play in our book despite it fusing with H4 channel support extended from the low 1.4332. As such, our team will be looking to short the break and retest of this level rather than looking to buy from it as support. In addition to this, another area to keep an eyeball on this week is the H4 Quasimodo support at 1.4485 (red circle). This not only has a converging round number at 1.45, but also sits within daily demand at 1.4442-1.4503, thus making a nice area to look for a bounce north from!
Levels to watch/live orders:
- Buys: 1.4485 region [Tentative – confirmation required] (Stop loss: dependent on where one confirms this area).
- Sells: Watch for price to consume 1.4570 and then look to trade any retest seen thereafter (lower timeframe confirmation required).
AUD/USD:
Weekly gain/loss: – 38 pips
Weekly closing price: 0.7179
Weekly opening price: 0.7175
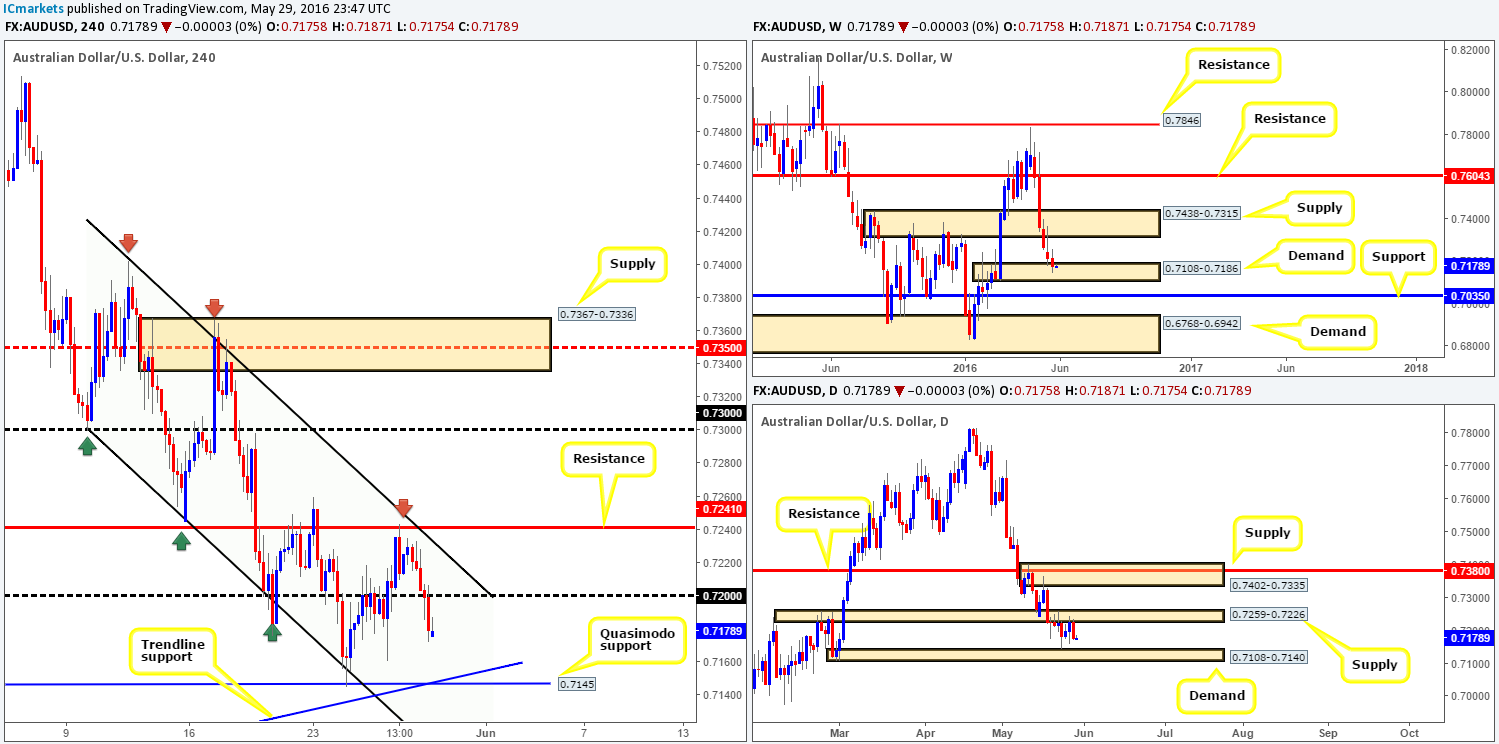
Weekly view: The AUD/USD was once again hit where it hurts, suffering its sixth consecutive weekly loss last week! From this point, it is difficult to judge whether this selling will continue this week since the bulls have yet to register any noteworthy move from the current demand zone seen at 0.7108-0.7186. In the event that the bulls get their act together this week, the next upside target falls in at 0.7438-0.7315. Meanwhile, a continuation move south could open the gates for price to connect with support at 0.7035.
Daily view: The reason (technically) weekly buyers are likely struggling can be seen from the daily chart. A strong ceiling of offers have formed around a small area of supply drawn from 0.7259-0.7226, which if continues to hold firm, it’s very possible we may see price test demand at 0.7108-0.7140. So do keep a tab on these two barriers this week.
H4 view: For those who follow our reports on a regular basis you may recall that we mentioned to watch for price to sell-off from resistance at 0.7241 on Friday. As we can all see, the market did drop lower and also took out a pocket of bids around the 0.72 handle before closing the week around the 0.7180 mark. Well done to any of our readers who managed to jump aboard before price fell lower.
Our suggestions: Taking into consideration the higher-timeframe structure (see above), this week’s spotlight is firmly focused on 0.7145 – a H4 Quasimodo support for long entries. This support not only blends nicely with a H4 trendline support taken from the low 0.6827, it also sits deep within the current weekly demand and also just above the aforementioned daily demand base. In light of this confluence, our team has placed a pending order to buy at 0.7146, with a stop set just below daily demand at 0.7105. Our first take-profit target will depend on how price approaches 0.7145 but usually we’ll look to aim for the most logical H4 supply formed on approach.
Levels to watch/live orders:
- Buys: 0.7146 [Pending order] (Stop loss: 0.7105).
- Sells: Flat (Stop loss: N/A).
USD/JPY:
Weekly gain/loss: + 9 pips
Weekly closing price: 110.18
Weekly opening price: 110.41
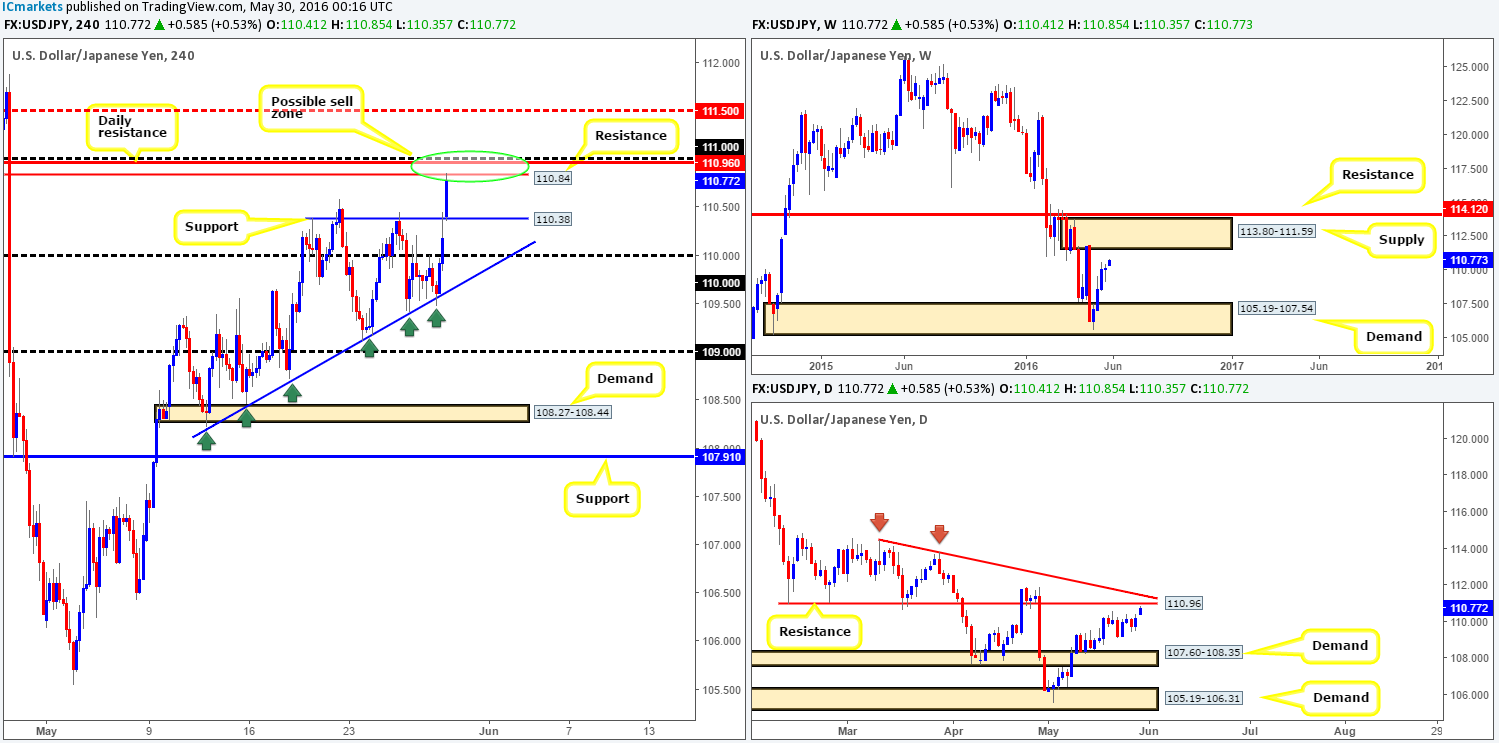
Weekly view: Although the USD/JPY posted a mediocre gain of around ten pips last week, we believe price is still on track to push higher up to supply drawn from 113.80-111.59.
Daily view: Looking at the daily chart, this pair is now trading within shouting distance of a major-league resistance line at 110.96 that merges nicely with trendline resistance taken from the high 114.44.
H4 view: Over on the H4 chart, price started the week gapping around 23 pips north, which came after the buyers bounced this market from a trendline support extended from the low 108.22 on Friday.
Our suggestions: As can be seen from the H4 chart, price is now touching gloves with a H4 resistance line carved from 110.84. Bolstering this level is a round-number at 111.00 and also a daily resistance drawn from 110.96. As mentioned in previous reports, the 111.00/110.84 H4 zone (green circle) looks fantastic for sell opportunities. Despite the collection of resistances seen here, however, we would still require lower timeframe confirmation to form before risking capital (see the top of this report for ideas on how to find confirmation). The reason being is, as we mentioned above, weekly activity could very well continue north up to the underside of the above said weekly supply – essentially the H4 mid-way resistance 111.50, fifty pips above our sell zone!
Levels to watch/live orders:
- Buys: Flat (Stop loss: N/A).
- Sells: 111.00/110.84 region [Tentative – confirmation required] (Stop loss: dependent on where one confirms this area).
USD/CAD:
Weekly gain/loss: – 85 pips
Weekly closing price: 1.3022
Weekly opening price: 1.3021
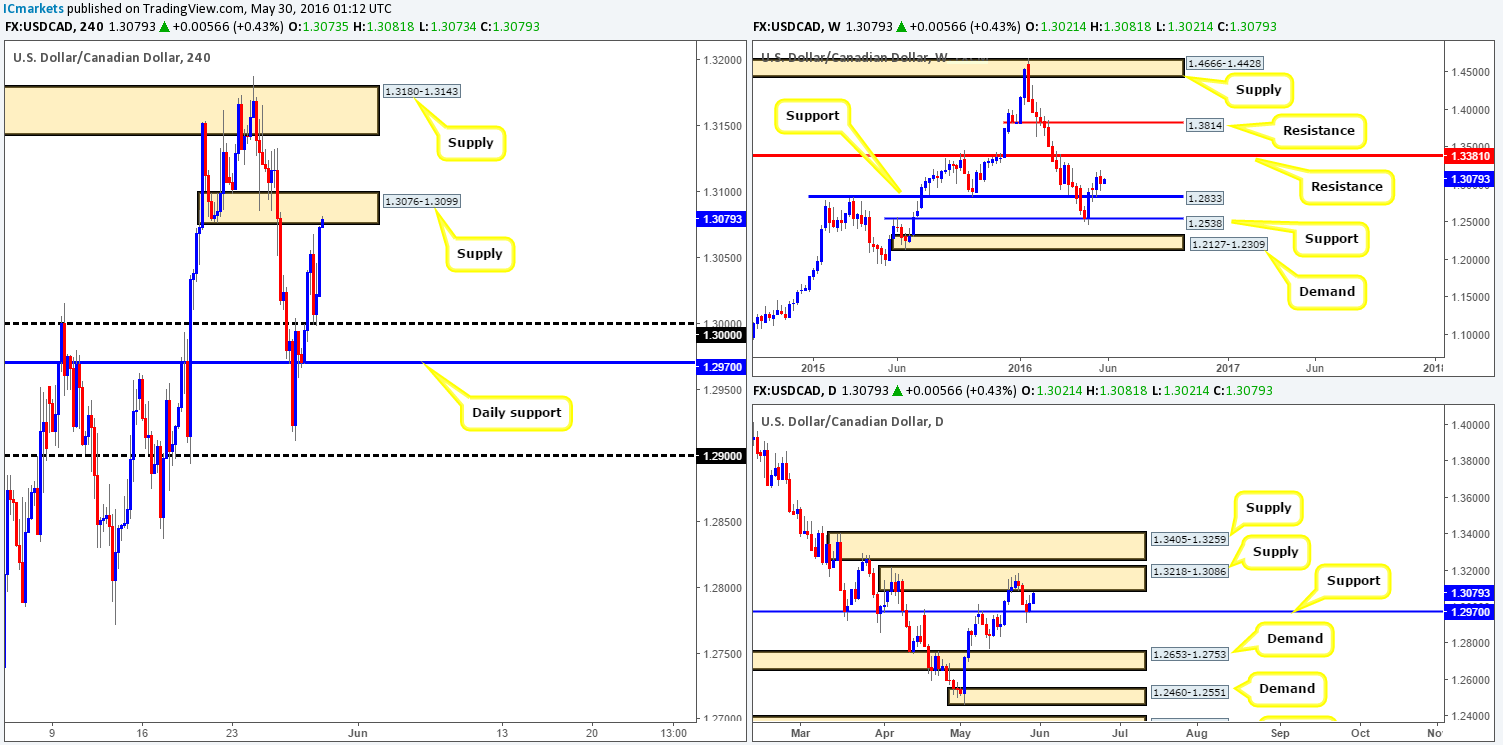
Weekly view: Based on last week’s trading, the Loonie is now seen loitering just above support at 1.2833. Should the buyers manage to hold this market above this hurdle, we feel there’s a good chance that price will eventually shake hands with resistance seen at 1.3381.
Daily view: From the other side of the field, daily action is currently capped by a nice-looking support at 1.2970 and a strong supply carved from 1.3218-1.3086. A break above this supply would land one immediately within the jaws of yet another supply zone seen at 1.3405-1.3259, whereas a sustained move below the current support would likely expose demand at 1.2653-1.2753.
H4 view: Following Friday’s rebound from the large 1.30 handle, this morning’s open has seen a strong wave of bids come into this market, pushing price up to supply drawn from 1.3076-1.3099. Now, given that this supply area sits just below the daily supply zone mentioned above at 1.3218-1.3086, is it worth selling here knowing that there’s a possibility weekly buyers may make an appearance soon (see above)?
Our suggestions: Watch for lower timeframe confirmation around the current H4 supply zone to sell this market back down to 1.30 (for confirming techniques see the top of this report). The reasoning behind waiting for confirmation is this will likely save one from a loss should weekly action decide to rally north and shake hands with the weekly resistance at 1.3381.
Levels to watch/live orders:
- Buys: Flat (Stop loss: N/A).
- Sells: 1.3076-1.3099 [Tentative – confirmation required] (Stop loss: dependent on where one confirms this area).
USD/CHF:
Weekly gain/loss: + 40 pips
Weekly closing price: 0.9937
Weekly opening price: 0.9943
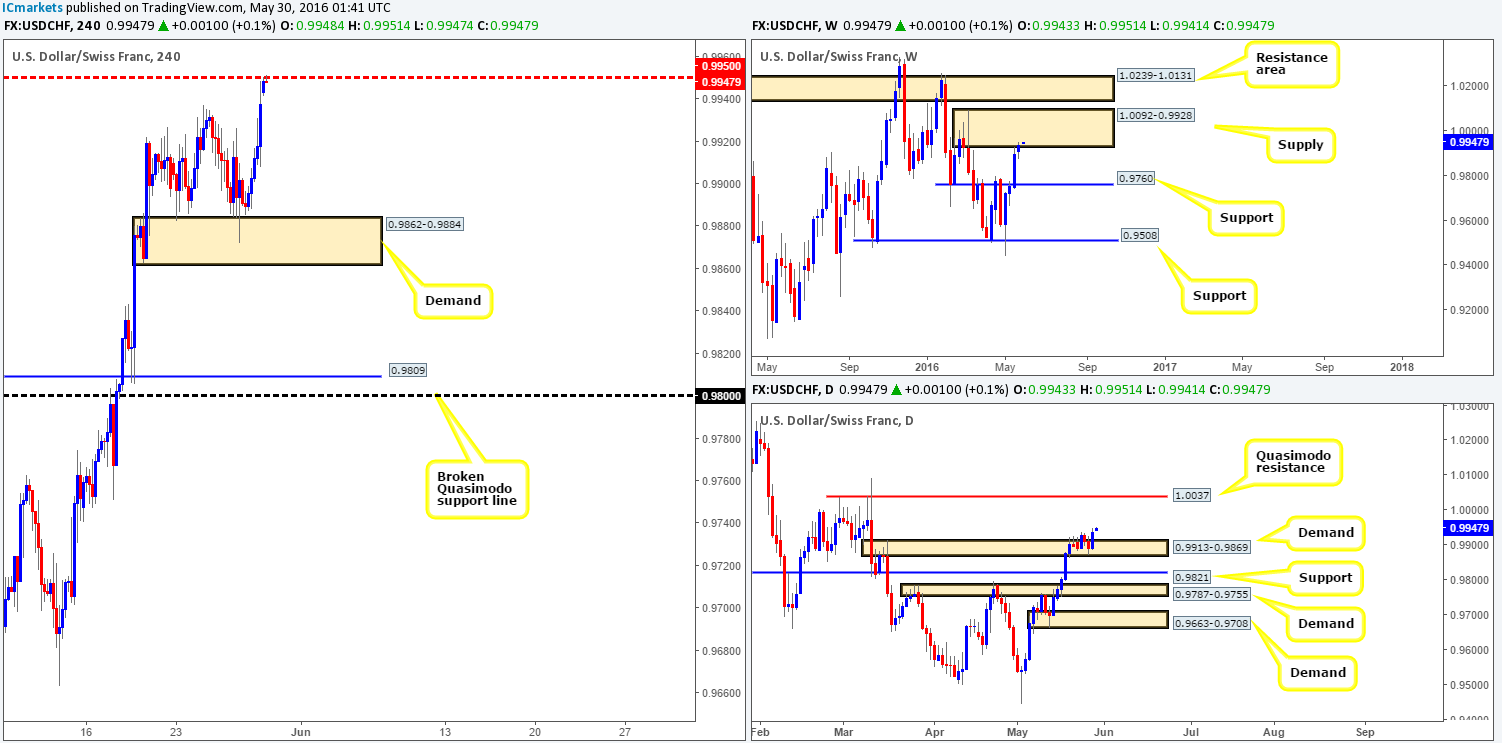
Weekly view: From the weekly chart this morning, one can see that the Swissy pair posted its fourth consecutive win last week. This, as you can see, brought the action into the jaws of a supply zone coming in at 1.0092-0.9928. Assuming that the bears hold ground here, it is possible to see this market drive lower to shake hands with support chalked up at 0.9760. However, as we mentioned in previous reports, given the size of this barrier, we may see further buying into this area before weakness comes into the market.
Daily view: Moving down to the daily chart, demand at 0.9913-0.9869 continues to bolster this market for the time being. In the event that this barrier holds firm, this pair has the potential to rally north and connect with a daily Quasimodo resistance line formed at 1.0037 (lurks deep within the current weekly supply area).
H4 view: Consequent to Friday’s aggressive push higher and this morning’s small 6-pip gap north, the USD/CHF is now seen plugging into offers around mid-way resistance drawn from 0.9950.
Our suggestions: In view of the above points, here are the options as we see it this week:
- Look for lower timeframe sell setups at 0.9950. From here you’d be selling from weekly supply but against daily flow into demand (see above).
- Should 0.9950 fail, we’ll then focus on the daily Quasimodo resistance at 1.0037 coupled with 1.0000 (parity) to form a sell zone. Selling from here, you’d have both the weekly and daily structure alongside you!
In regards to the first option, our team highly recommends waiting for lower timeframe price action to form before risking capital (for ways of confirming price action, please see the top of this report). The second option, however, may be somewhere traders could consider shorting at market.
Levels to watch/live orders:
- Buys: Flat (Stop loss: N/A).
- Sells: 0.9950 region [Tentative – confirmation required] (Stop loss: dependent on where one confirms this area).1.0037/1.0000 [Could possibly enter at market from this region – will depend on how the H4 price approach the sell zone] (Stop loss: dependent on how we decide to sell here but the safest stop placement, as we see it, would be above the apex of the daily Quasimodo formation).
DOW 30:
Weekly gain/loss: + 357 points
Weekly closing price: 17868
Weekly opening price: 17896
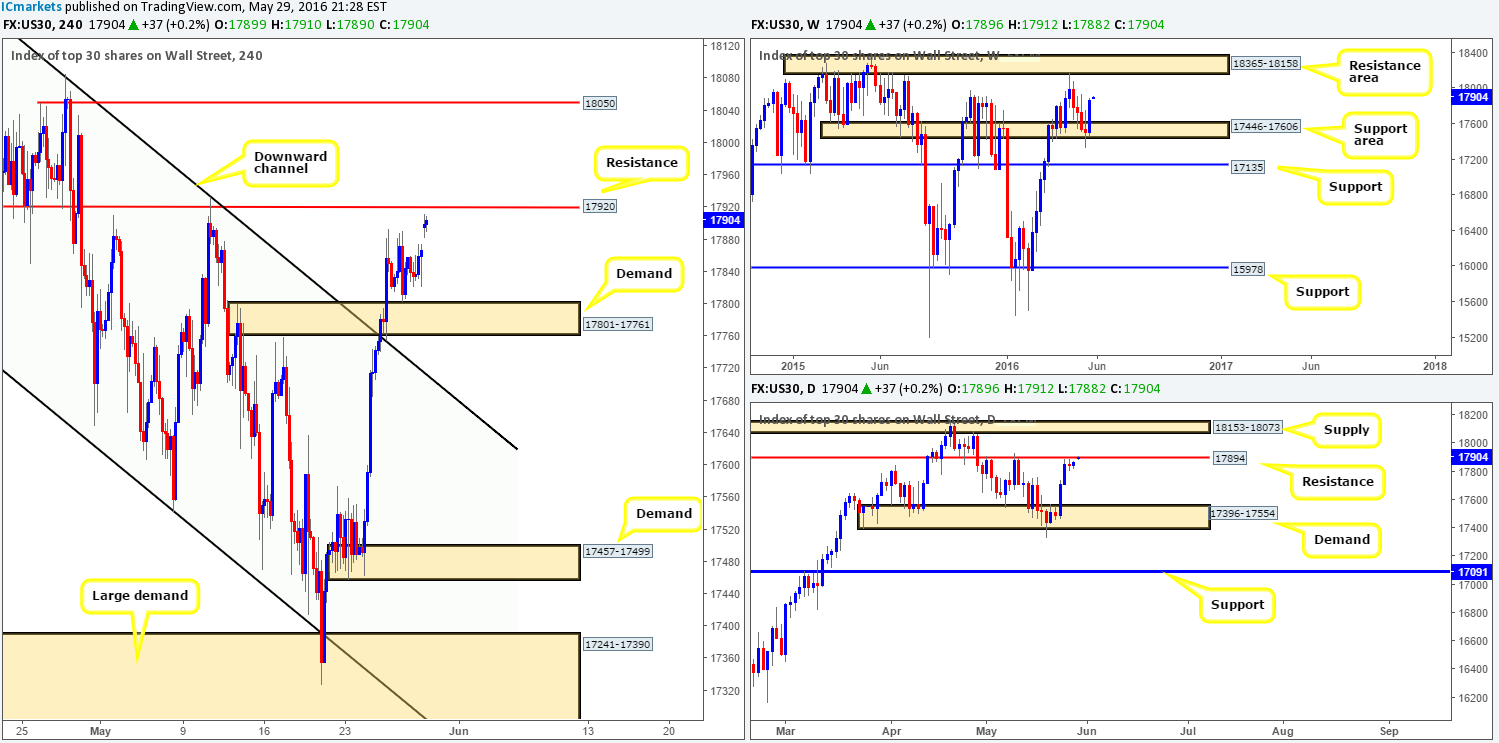
Weekly view: The previous week’s action saw the bulls take on more of a livelier stance, as price rallied from a weekly support area at 17446-17606. This recent advance higher took out three prior weekly candle bearish bodies and closed very near the week’s high! Supposing the bulls continue to bid this market north this week, the next upside target to be aware of is the resistance area at 18365-18158.
Daily view: Despite the very clear bullish picture being seen on the weekly chart right now, daily is action is currently flirting with a resistance line carved from 17894. A break beyond this hurdle would likely clear the path north for price to touch base with a supply zone chalked up at 18153-18073, which sits a few points below the above said weekly resistance area.
H4 view: With this morning’s 28-point gap north bringing price up to within shouting distance of a resistance line seen at 17920, one could potentially look to short from this region today considering the DOW is also connecting with a daily resistance barrier right now (see above). However, given weekly price is relatively bullish, some traders may want to consider waiting to see if the H4 resistance line fails to hold as this will potentially provide an opportunity to trade long on any retest seen at this boundary, targeting the H4 Quasimodo resistance level at 18050 (located just below the daily supply zone at 18153-18073).
Levels to watch/live orders:
- Buys: Watch for price to consume 17920 and then look to trade any retest seen thereafter (lower timeframe confirmation required).
- Sells: 17920 region [Tentative – confirmation required] (Stop loss: dependent on where one confirms this area).
Gold:
Weekly gain/loss: – $39
Weekly closing price: 1212.6
Weekly opening price: 1212.5
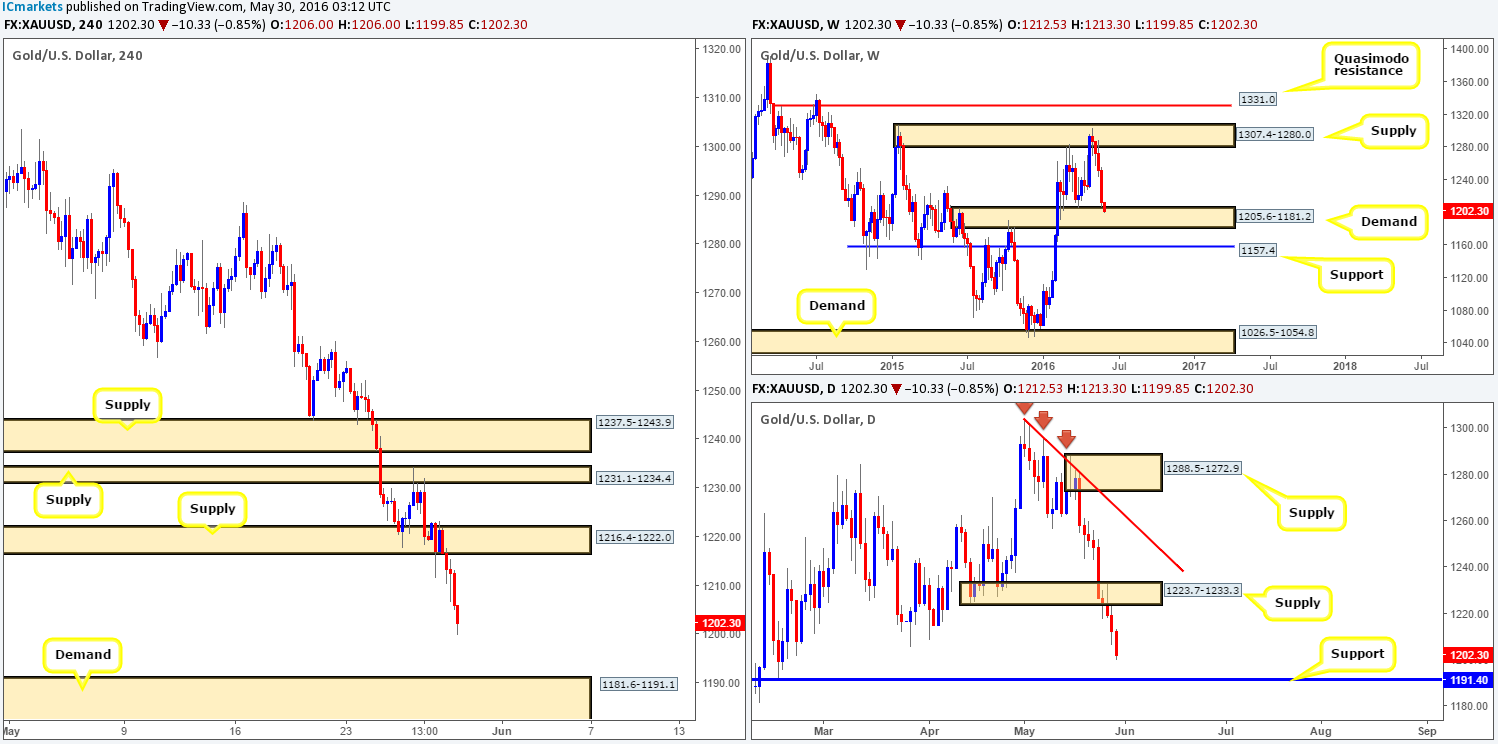
Weekly view: The yellow metal lost just under $40 during last week’s trading, consequently bringing price into the jaws of a major area of demand seen at 1205.6-1181.2 by the week’s end, marking gold’s fourth consecutive losing week to date! Assuming that the market respects this demand zone, price could be in for a substantial rally north. Conversely, should price cut through this demand base and continue driving lower; it is very likely we’ll see price strike support at 1157.4.
Daily view: Looking at the daily chart, we can see that demand at 1223.7-1233.3 stood little chance of holding last week as bullion continued to pound lower following a retest of this area as supply. From this angle, we see absolutely no reason (little active demand to the left of current price) for price not to continue dropping lower this week until price comes into contact with support seen at 1191.4.
H4 view: Along with Friday’s bearish descent on the back of a stronger dollar, gold has wasted little time in continuing from where it left off on Friday this morning, bringing price to lows of 1199.8 at the time of writing!
Our suggestions: In light of the points made above our attention will mostly be driven towards looking for price to connect with H4 demand at 1181.6-1191.1. Reason being is this area sits just below the aforementioned daily support, and also placed within the depths of the above said weekly demand. As we currently have a pending buy order placed on the AUD/USD, we’re not going to look at placing another pending order on gold due to the high correlation seen between the two. For anyone interested in buying here, however, we would advise placing stops a few pips beyond the H4 demand around the 1180.3 region.
Levels to watch/live orders:
- Buys: 1181.6-1191.1 [Entering from here at market is a possibility] (Stop loss: 1180.3).
- Sells: Flat (Stop loss: N/A).


