
A note on lower timeframe confirming price action…
Waiting for lower timeframe confirmation is our main tool to confirm strength within higher timeframe zones, and has really been the key to our trading success. It takes a little time to understand the subtle nuances, however, as each trade is never the same, but once you master the rhythm so to speak, you will be saved from countless unnecessary losing trades. The following is a list of what we look for:
- A break/retest of supply or demand dependent on which way you’re trading.
- A trendline break/retest.
- Buying/selling tails/wicks – essentially we look for a cluster of very obvious spikes off of lower timeframe support and resistance levels within the higher timeframe zone.
- Candlestick patterns. We tend to only stick with pin bars and engulfing bars as these have proven to be the most effective.
For us, lower timeframe confirmation starts on the M15 and finishes up on the H1, since most of our higher timeframe areas begin with the H4. Stops usually placed 5-10 pips beyond your confirming structures.
EUR/USD:
Weekly Gain/Loss: 227 +
Weekly closing price: 1.1445
Weekly opening price: 1.1457
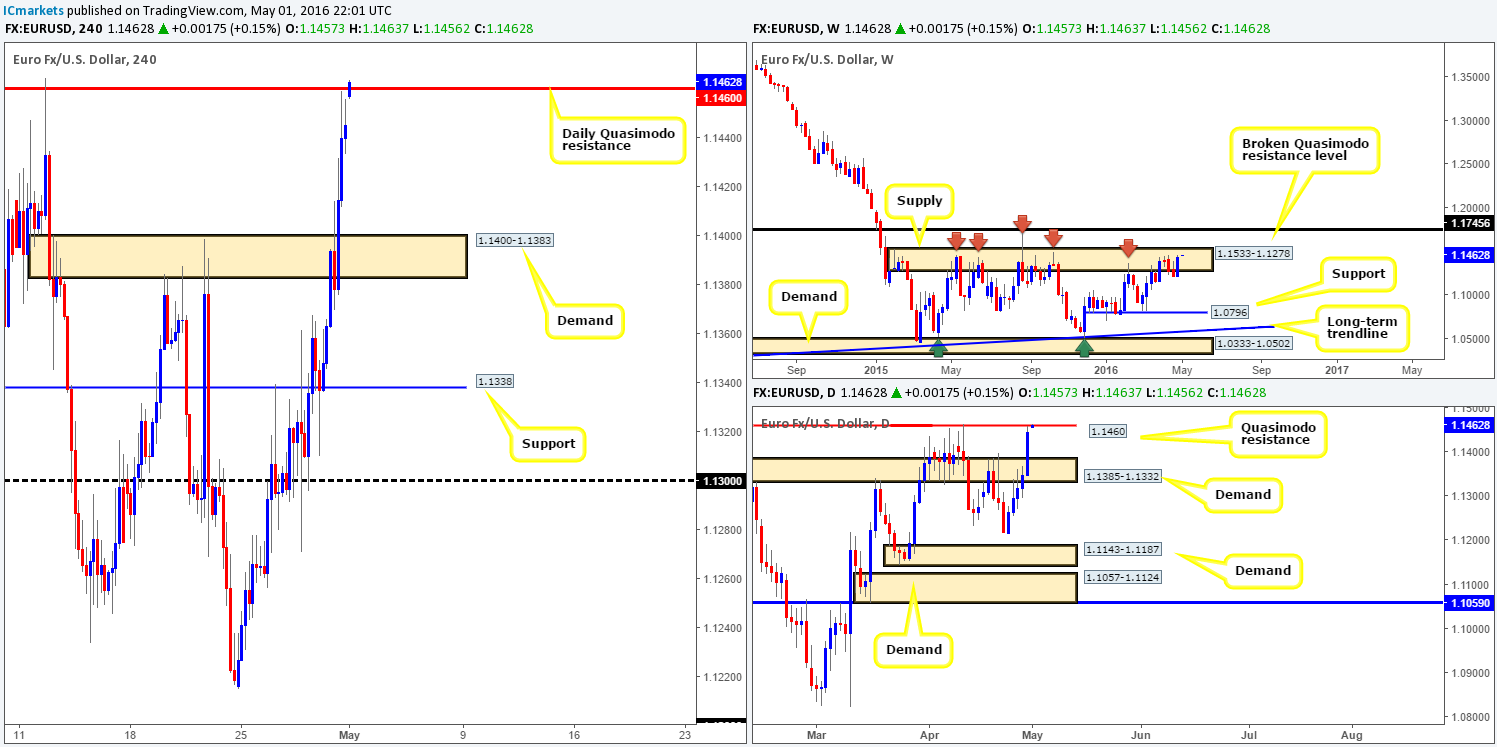
As can be seen from the weekly chart the EUR bulls were on fire last week, managing to reach highs of 1.1459. This saw the pair push deeper into a major area of supply coming in at 1.1533-1.1278. Be that as it may, the bulls will still likely have their work cut out for them if they wish to continue driving this market higher, as this area of supply has held price lower since May 2015! Nevertheless, we should be prepared for all outcomes! So the next target above this zone falls in at a broken Quasimodo resistance line drawn from 1.1745, whilst to the downside, the next target can be seen around support at 1.0796.
Moving down to the daily action, we can see that this recent surge in buying cleanly took out supply at 1.1385-1.1332 (now acting demand), and came within a pip of hitting a Quasimodo resistance line at 1.1460. Taking into account that this daily line sits firmly within the above said weekly supply, this is certainly a number to keep a close watch on today/this week.
A quick recap of Friday’s trade on the H4 shows supply at 1.1400-1.1383 was taken out, and as we just mentioned, came within a pip of connecting with the daily Quasimodo resistance line at 1.1460. However, this morning’s open (1.1457) saw the single currency gap 12 pips north, resulting in price hitting the above said daily Quasimodo barrier!
In light of these points, today’s spotlight will firmly be focused on shorting from the 1.1460 line. Considering how violent price reacted from this level back on the 12th April, we’re confident some sort of bounce lower will be seen. Nevertheless, as one can never tell how deep price will whipsaw through fixed levels such as this one, we will not be selling this market until we’ve pinned down a suitable lower-timeframe sell entry. This could be an engulf of demand and subsequent retest as supply, a break/retest of a trendline or simply a collection of selling wicks around a lower-timeframe resistance. In the event that the above analysis is correct, the first take-profit target will be the H4 demand coming in at 1.1400-1.1383 as this sits on top of daily demand at 1.1385-1.1332 – the next downside target on this timeframe.
Levels to watch/live orders:
- Buys: Flat (Stop loss: N/A).
- Sells: 1.1460 region [Tentative – confirmation required] (Stop loss: dependent on where one confirms this area).
GBP/USD:
Weekly Gain/Loss: 208 +
Weekly closing price: 1.4607
Weekly opening price: 1.4581
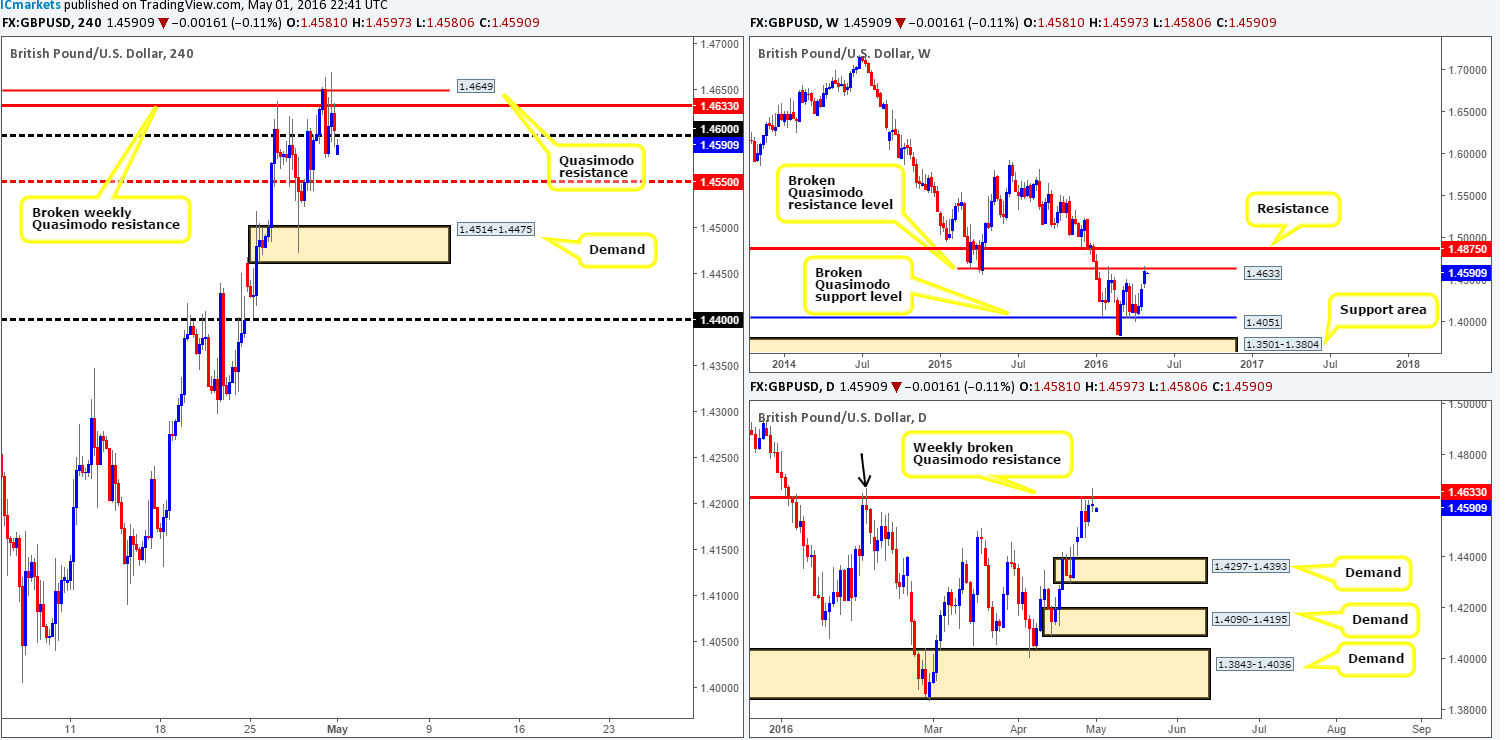
Similar to the EUR/USD, GBP/USD bulls also went on the offensive last week, propelling this market towards a weekly broken Quasimodo resistance level (BQRL) at 1.4633. With this level already managing to hold price lower once before back in early February, there’s a good chance we may see a re-run of this scenario in the coming weeks. Should this come to fruition, the weekly broken Quasimodo support line at 1.4051 will likely be the next area on the hit list. Zooming in and looking at the daily picture, however, it is clear to see that the buyers attempted to break above the weekly (BQRL) on Friday, but failed around the 1.4670 mark before closing lower. Traders may have also noticed that this fakeout reached the same high point as the prior fakeout of this weekly level (black arrow) back on the 4th Feb! Could this be history repeating itself here!?!? Let’s take a look lower down the scale to see what we can find…
Looking to Friday’s action on the H4 chart reveals that price found a clear pocket of offers around a H4 Quasimodo resistance line chalked up at 1.4649. As you can probably see, this hurdle conveniently sits a few pips above the aforementioned weekly (BQRL).
Consequent to this morning’s 26-pip gap south, price is now trading below the 1.4600 handle which could potentially provide resistance when/if the market attempts to fill the gap. Should this be the case, we would, dependent on how the lower timeframe price responds (for confirmation techniques, please see the top of this report), look to short this market down to the H4 mid-way resistance 1.4550, followed by H4 demand at 1.4514-1.4475 and then the 1.4400 psychological barrier (positioned just above daily demand at 1.4297-1.4393 – the next downside target on the daily timeframe from the aforementioned weekly [BQRL]).
Levels to watch/live orders:
- Buys: Flat (Stop loss: N/A).
- Sells: 1.4600 region [Tentative – confirmation required] (Stop loss: dependent on where one confirms this area).
AUD/USD:
Weekly Gain/Loss: 107 –
Weekly closing price: 0.7597
Weekly opening price: 0.7596
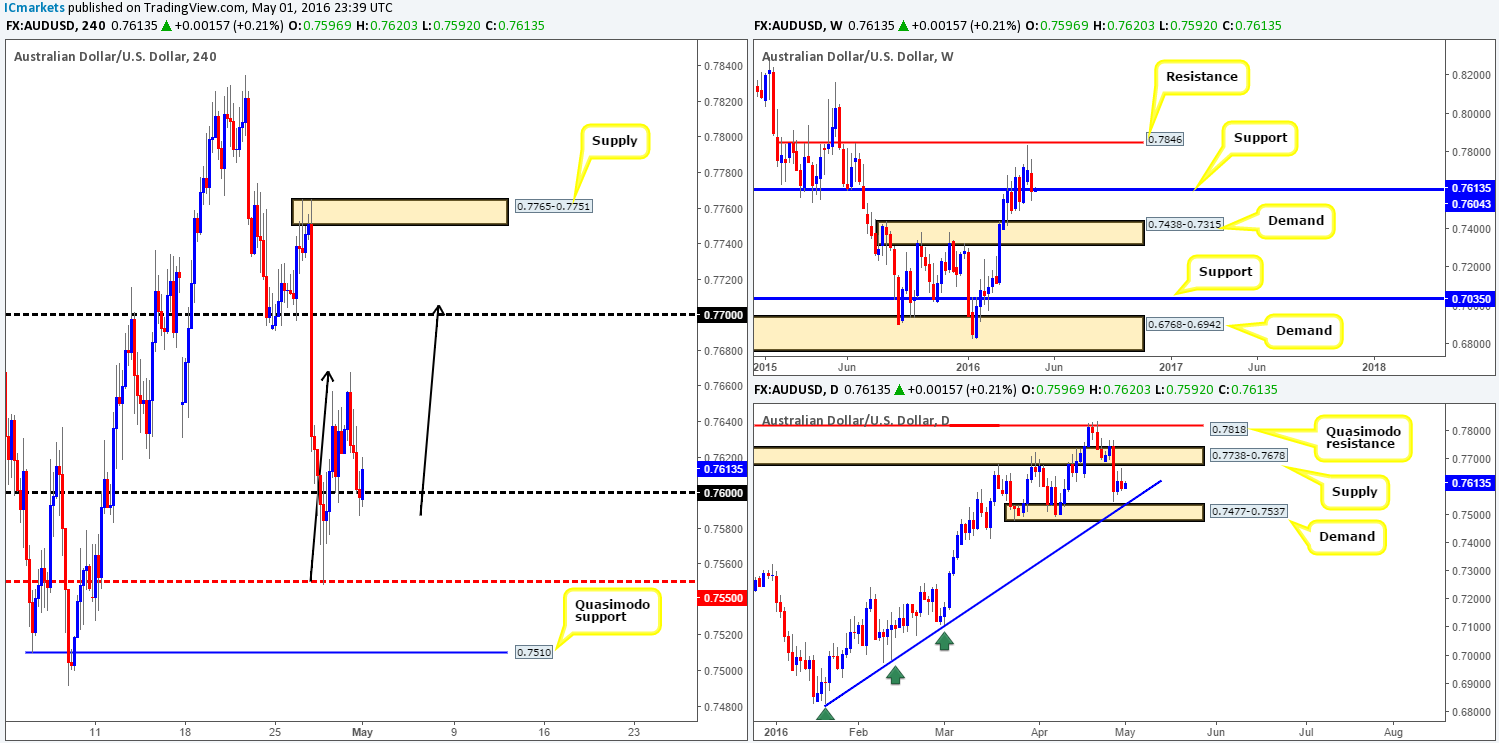
Kicking-off the week with a look at the weekly chart this morning, price ended last week on a loss. This forced the commodity currency to cross paths with weekly support drawn from 0.7604 which for now seems to be holding steady. Although this line has suffered some chop in recent weeks, this does not invalidate its significance in our opinion. Check out the period between January and June back in 2015 – the support seen from this level is unquestionable!
Casting our lines down into the daily chart, the Aussie has been seen loitering mid-range between daily supply at 0.7738-0.7678 and daily demand coming in at 0.7477-0.7537 (converges with a daily trendline support extended from the low 0.6827) since Thursday last week. More weight of course is being placed on the demand this week considering where price is currently positioned on the weekly chart (see above).
Consequent to a stable open (0.7596) seen on the H4 this morning, and Friday’s sell-off from highs of 0.7668 price is, at the time of writing, bid from the 0.7600 handle. Now, in view of the weekly chart showing price trading from support (see above), buying this market from around the 0.7600 area could be an option today. In addition to this, we can see that a rally from current price would in fact complete the D-leg of an AB=CD bearish formation (black arrows) around the 0.7700 line (seen within daily supply mentioned above at 0.7738-0.7678). Of course, Should weekly support kick into action this week, price could potentially rally much further than 0.7700. It could advance as high as the weekly resistance seen at 0.7846 – essentially the next upside target on this timeframe.
Seeing as how there is little resistance being seen in this market at the moment, the upside looks to be the more favorable direction right now. As such, our prime focus today will be on looking for lower timeframe buy entries around the 0.7600 region (for confirmation techniques, please see the top of this report). Should all go to plan, we’ll look to take partial profits around Friday’s high 0.7668 and also look to reduce risk. The second take-profit target will be the 0.7700 hurdle. If and only if price closes above here, will we then begin trailing our stop behind support structures on the M30/M60, as let’s not forget how much upside potential is being seen on the weekly chart (see above).
Levels to watch/live orders:
- Buys: 0.7600 region [Tentative – confirmation required] (Stop loss: dependent on where one confirms this area).
- Sells: Flat (Stop loss: N/A).
USD/JPY:
Weekly Gain/Loss: 550 –
Weekly closing price: 106.28
Weekly opening price: 106.22
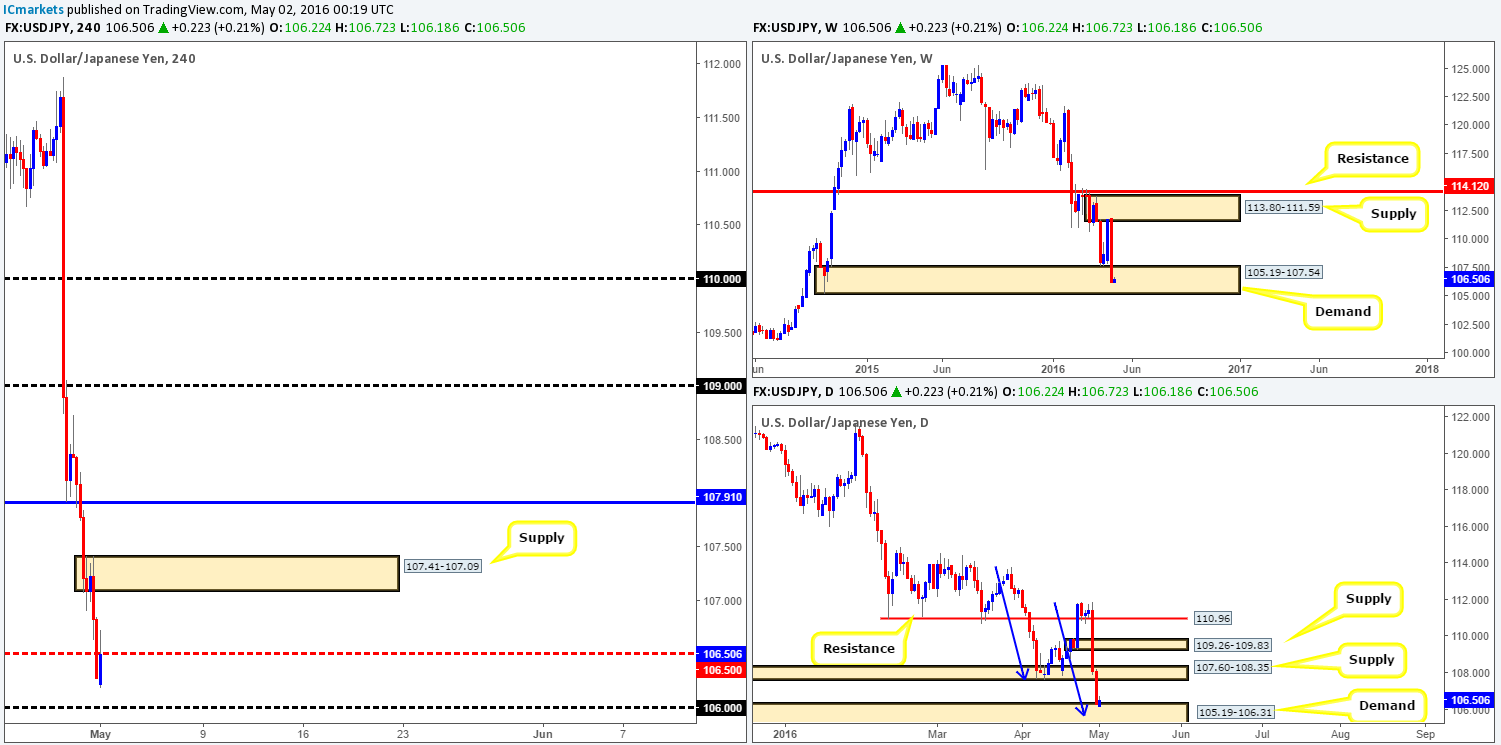
The USD/JPY had a rather eventful week last week! The pair collectively erased 550 pips after price aggressively plummeted from the underside of weekly supply drawn from 113.80-111.59. In consequence, the buyers and sellers are now seen battling for position within the confines of a major weekly demand zone given at 105.19-107.54. Therefore, one has to be prepared for the possibility that the buyers may bite back this week!
In-line with the weekly timeframe, daily flow is, after Thursday and Friday’s round of aggressive selling, now seen teasing the top-side of daily demand coming in at 105.19-106.31 (sits within the extremes of the aforementioned weekly demand). On the assumption that the bulls do indeed fight back this week, the next upside target seen from this scale falls in around a recently broken daily demand-turned supply at 107.60-108.35. What is more, notice that the recent sell-off has potentially formed the D-leg of an AB=CD bullish approach completing around the 105.60 mark (see blue arrows), thus possibly adding more weight to a reversal taking place.
Over on the H4 chart this morning started around 106.22, slightly lower than Friday’s close and has since then retested the H4 mid-way resistance at 106.50, following Friday’s sharp sell-off. To our way of seeing things right now, our analysis is relatively straight forward. With both the weekly and daily charts seen trading around demand zones (see above), and the 106.00 handle lurking just below current price on the H4 with ‘trade me’ written all over it, we’re going to be looking to buy from this number today. One could, if they so wished simply place a pending buy order at this level and a stop below the higher-timeframe demands. However, this would equate to a hefty 80-pip stop and when price could potentially half around the H4 mid-way resistance 106.50, the risk/reward is not exactly favorable. Our plan, therefore, is to simply watch the lower timeframe action around 106.00 today – if we manage to pin down a lower timeframe buy setup (for confirmation techniques, please see the top of this report), we’ll enter long, targeting 106.50 first and foremost, followed by H4 supply at 107.41-107.09 and then perhaps H4 resistance seen at 107.91 (sits within daily supply at 107.60-108.35).
Levels to watch/live orders:
- Buys: 106.00 region [Tentative – confirmation required] (Stop loss: dependent on where one confirms this area).
- Sells: Flat (Stop loss: N/A).
USD/CAD:
Weekly Gain/Loss: 116 –
Weekly closing price: 1.2550
Weekly opening price: 1.2551
As we can all see from the weekly chart this morning, the USD/CAD posted its fifth consecutive loss last week erasing around 120 pips going into the close. As we’ve mentioned in previous reports, there’s still room seen for a possible continuation move south down towards demand at 1.2537-1.2567 which could potentially come into view this week!
Both Thursday and Friday’s sessions on the daily chart reveal daily demand at 1.2537-1.2567 looks to be bleeding profusely at the moment, struggling to remain conscious. The two daily spikes seen through this zone could have potentially cleared the road south (consumed stops below) to demand seen at 1.2309-1.2397, which sits on top of the aforementioned weekly demand.
Analyzing Friday’s sessions over on the H4 chart shows that the bid-side of this market found support around the 1.2500 handle. This forced to Loonie to highs of 1.2587 before collapsing to lows of 1.2530 by the day’s end. Owing to both the weekly and daily charts suggesting that we may see the CAD continue to gain this week, we have absolutely no interest in buying from the 1.2500 line. Instead, what we’re interested in is a break below this number! That way, traders can position themselves to take advantage of any (confirmed) retest that may be seen to the underside of this line (for confirmation techniques, please see the top of this report), targeting the 1.2400 level which, as you can probably see, sits three pips above the daily demand at 1.2309-1.2397 – the next downside target on the daily scale.
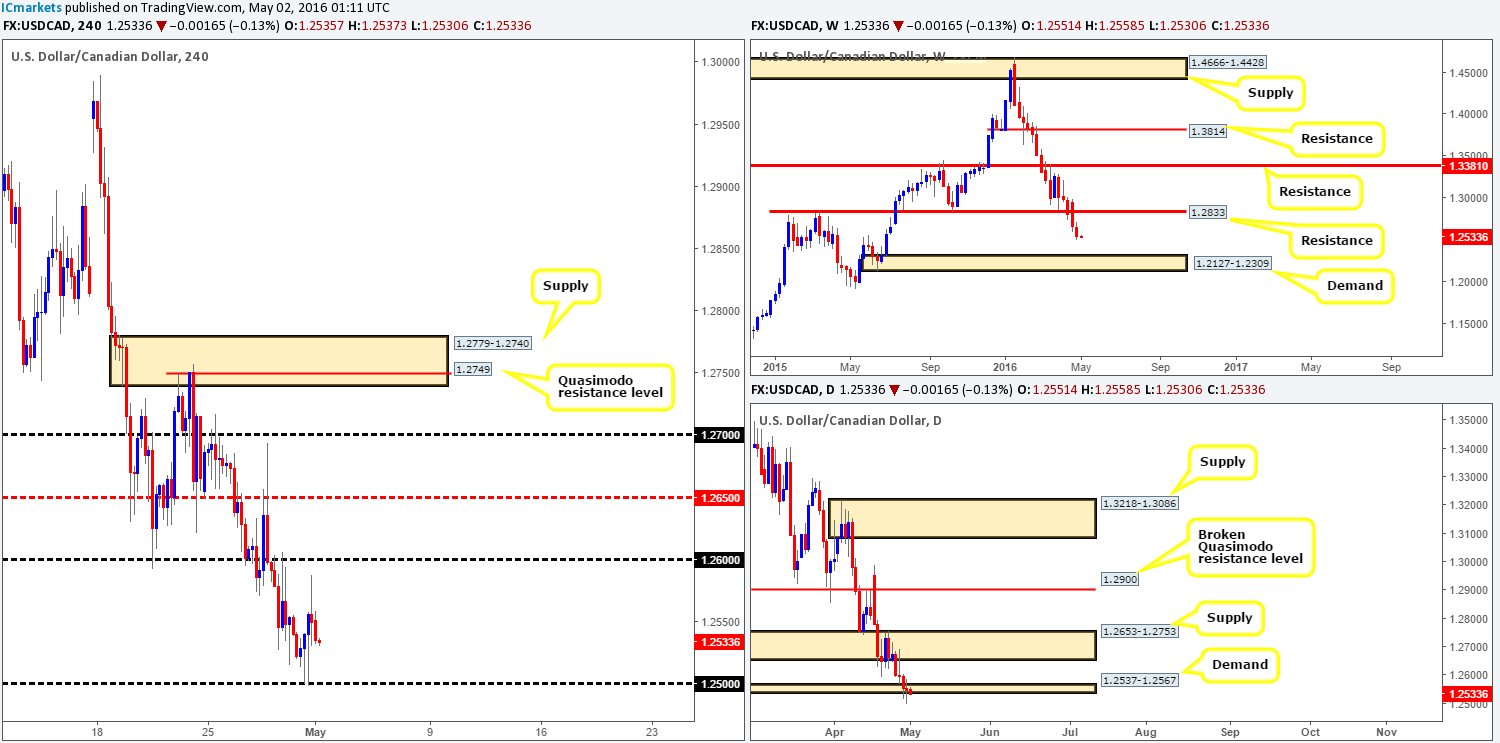
Levels to watch/live orders:
- Buys: Flat (Stop loss: N/A).
- Sells: Watch for price to close below the 1.2600 and look to trade any retest seen thereafter (lower timeframe confirmation required).
USD/CHF:
Weekly Gain/Loss: 190 –
Weekly closing price: 0.9584
Weekly opening price: 0.9583
The past week saw the Swissy claw back most of the recent gains recorded from the previous two weeks. As a result, this has placed price back above the weekly Quasimodo support line coming in at 0.9526. Since late November, this pair has been trending lower forming lower lows and lower highs, and with the recent weekly close chalking up a bearish engulfing candle, a lot of traders will be looking to sell! However, the response seen from the above said weekly Quasimodo support three weeks ago was strong in our opinion. Therefore, it is unlikely that we will be seeing the next lower low form just yet!
Turning our attention to the daily timeframe, one can see just how one-sided last week’s trading was – not one bullish close! In addition to this, daily demand at 0.9584-0.9640 was spiked on Friday, likely stopping out a truckload of buyers and potentially opening up the path south this week for price to retest the aforementioned weekly Quasimodo support.
After a rather heavy round of selling on Friday, the H4 crew closed and, as of this morning, opened (see above in bold) around the extremes of H4 demand at 0.9584-0.9600, which we now deem to be supply. This – coupled with the higher-timeframe picture indicating that this market may continue to sell-off, may have opened a small window of opportunity to join in here with the higher-timeframe flow. Assuming price remains below the current H4 supply, it is likely that this pair will visit the weekly Quasimodo support mentioned above. The H4 demand seen marked with a blue arrow at 0.9544-0.9558 is, we agree, a nice-looking zone. However, with the weekly Quasimodo support lurking just below it, it is likely the market will ignore this zone and gobble up the liquidity (sell stops) from here to buy into from the higher-timeframe support.
With the above in mind, our job today is simple: watch for selling strength to form on the lower timeframes around the current H4 supply to sell (for confirmation techniques, please see the top of this report), targeting the aforementioned weekly Quasimodo support. This will be our only take-profit level since at that point our team would be looking to buy into this market!
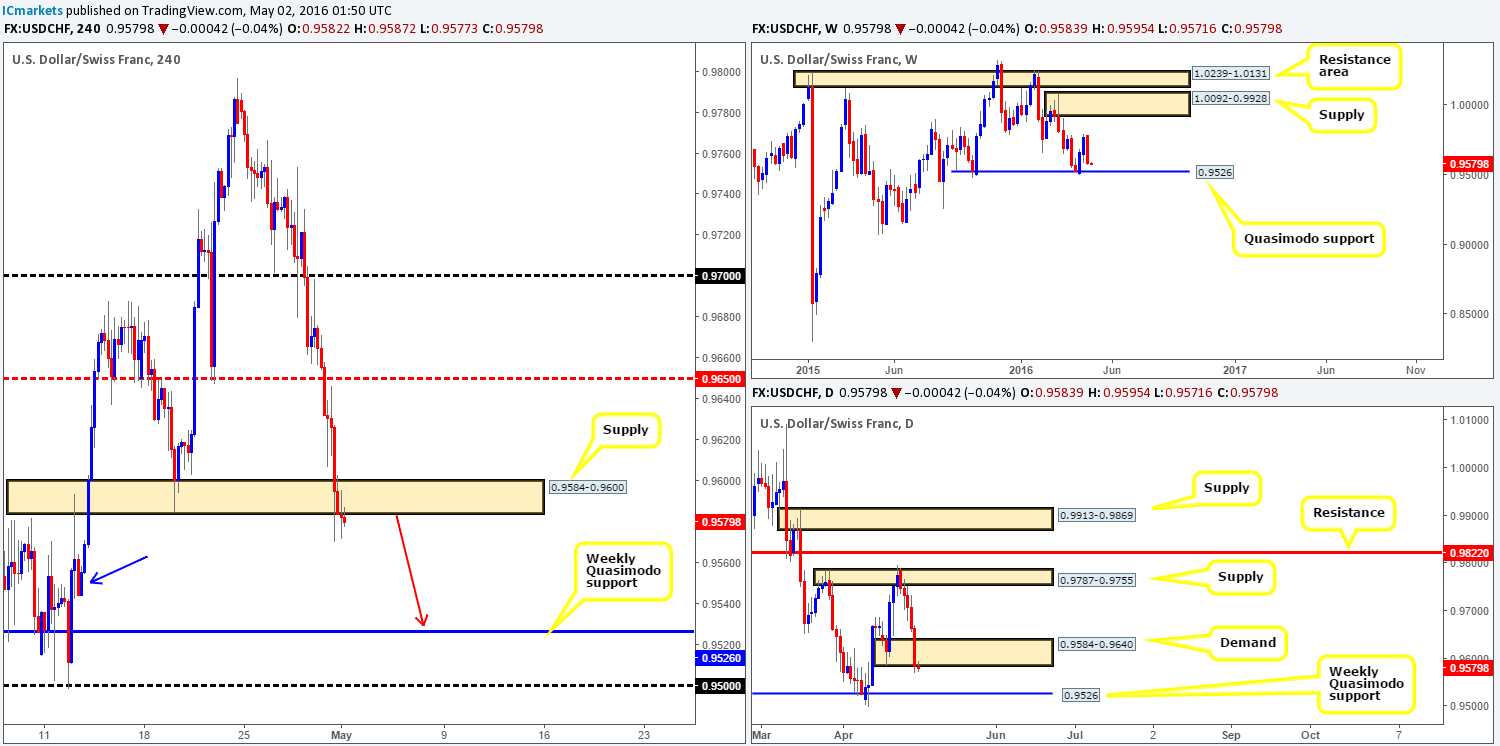
Levels to watch/live orders:
- Buys: 0.9526 region [Tentative – confirmation required] (Stop loss: dependent on where one confirms this area).
- Sells: 0.9584-0.9600 [Tentative – confirmation required] (Stop loss: dependent on where one confirms this area).
DOW 30:
Weekly Gain/Loss: 204 –
Weekly closing price: 17791
Weekly opening price: 17792
U.S. stocks fell last week following a rather nasty whipsaw through a weekly resistance area chalked up at 17977-17811. Whether or not the bears will continue to run with this during upcoming trade this week is very difficult to judge from this timeframe, so let’s scoot down to the lower timeframes and see what’s cooking! The daily chart shows price recently took out a daily support area at 17844-17811 (now acting resistance), which could have cleared the rubble for the DOW to challenge daily demand coming in at 17396-17554.
Looking at the H4 chart, however, it is clear to see active bids were in wait around H4 support drawn from 17671 on Friday, consequently allowing this market to close the week out around H4 resistance at 17790. Now, in consideration of what the higher-timeframe picture is telling us (see above) at the moment and with the market opening steady this morning, we could see the index sell-off from the current H4 resistance hurdle. With that being the case, we are going to be keeping a close eye on the lower-timeframe price action around this barrier today. If we manage to locate a suitable lower-timeframe setup (for confirmation techniques, please see the top of this report) a short position will be taken, targeting H4 support at 17671, followed closely by the H4 demand line at 17575 which sits directly above daily demand at 17396-17554.
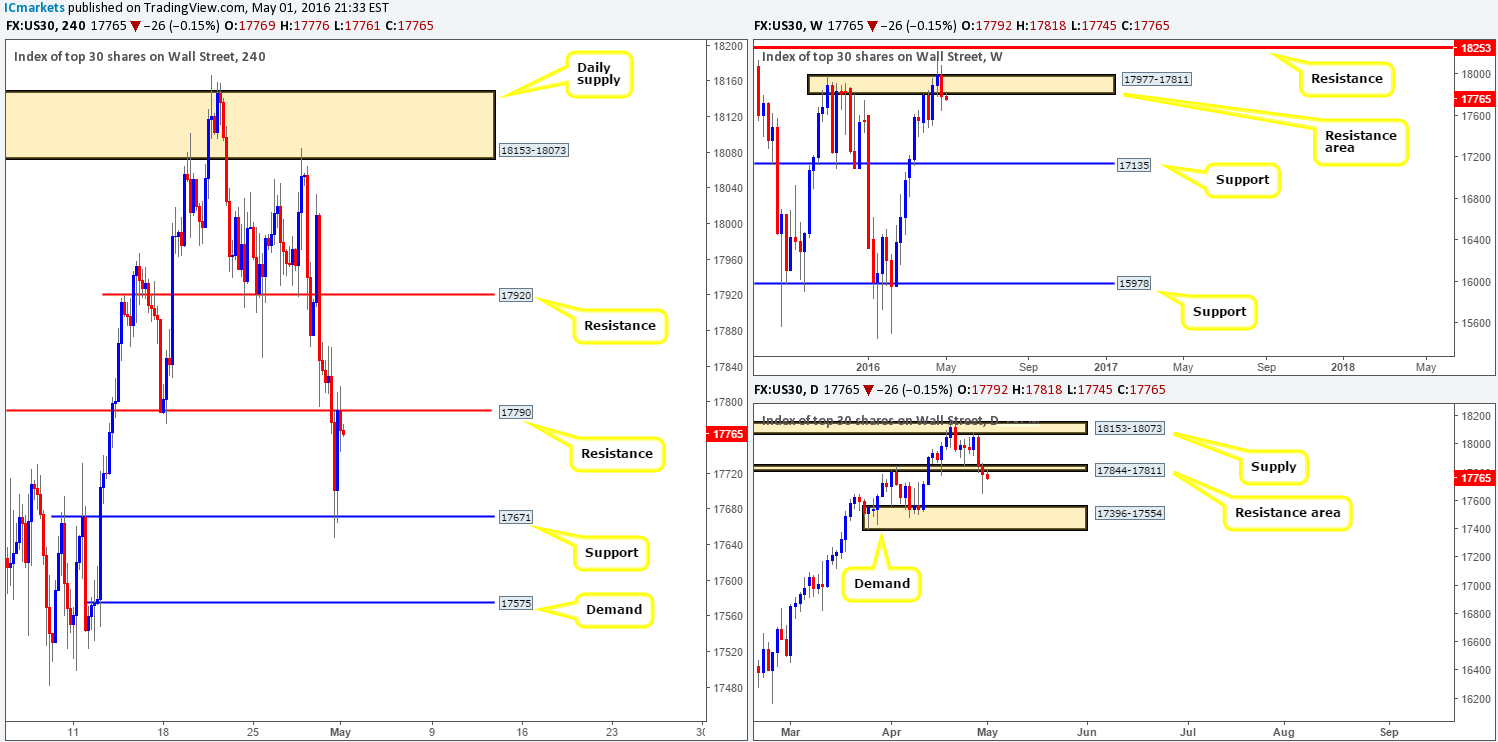
Levels to watch/live orders:
- Buys: Flat (Stop loss: N/A).
- Sells: 17790 region [Tentative – confirmation required] (Stop loss: dependent on where one confirms this area).
GOLD:
(Trade update: Live trade taken from 1278.93 was stopped out at breakeven following a small profit taken at 1271.0)
Weekly Gain/Loss: $61 +
Weekly closing price: 1293.3
Weekly opening price: 1293.3
The bid-side of this market was certainly on top form last week! Weekly traders pushed the yellow metal to fresh highs of 1296.5, forcing price to drive deeper into weekly supply carved from 1307.4-1280.0 by the week’s end. On the assumption that the bulls continue to bolster this market this week, we could see the current supply taken out and price go on to connect with a weekly Quasimodo resistance line positioned at 1331.0.
On the other side of the ledger, daily price recently took out daily resistance at 1283.4 (now acting support), which allowed price to trade into the current weekly supply. Beyond the weekly area, however, the next upside target on the daily timeframe falls in at 1333.4 – a daily Quasimodo resistance line planted just above the aforementioned weekly Quasimodo resistance hurdle.
Stepping down to the H4 chart, after a small but relatively profitable bounce from the H4 Quasimodo resistance level at 1297.7 on Friday, Gold shot north and collided with H4 resistance chalked in at 1296.3. As can be seen from the H4 angle, the pair’s open this morning was steady, leaving price hovering beneath the current H4 resistance.
Overall, we feel this market is overbought and will likely pullback this week. Under these circumstances, our team is going to be hunting for lower timeframe selling opportunities around the current H4 resistance hurdle today (for confirmation techniques, please see the top of this report). Now, traders may want to bear in mind that this sell-off could only stretch down to as far as daily support at 1283.4 – a little above the first downside target on the H4 coming in at 1279.7 (a broken Quasimodo support level). So be prepared to close out your position around this area! In the event that the precious metal continues to decline from here, the next take-profit target will be H4 support at 1269.0 which sits just within daily demand at 1270.8-1257.5 (seen below daily support at 1283.4)..
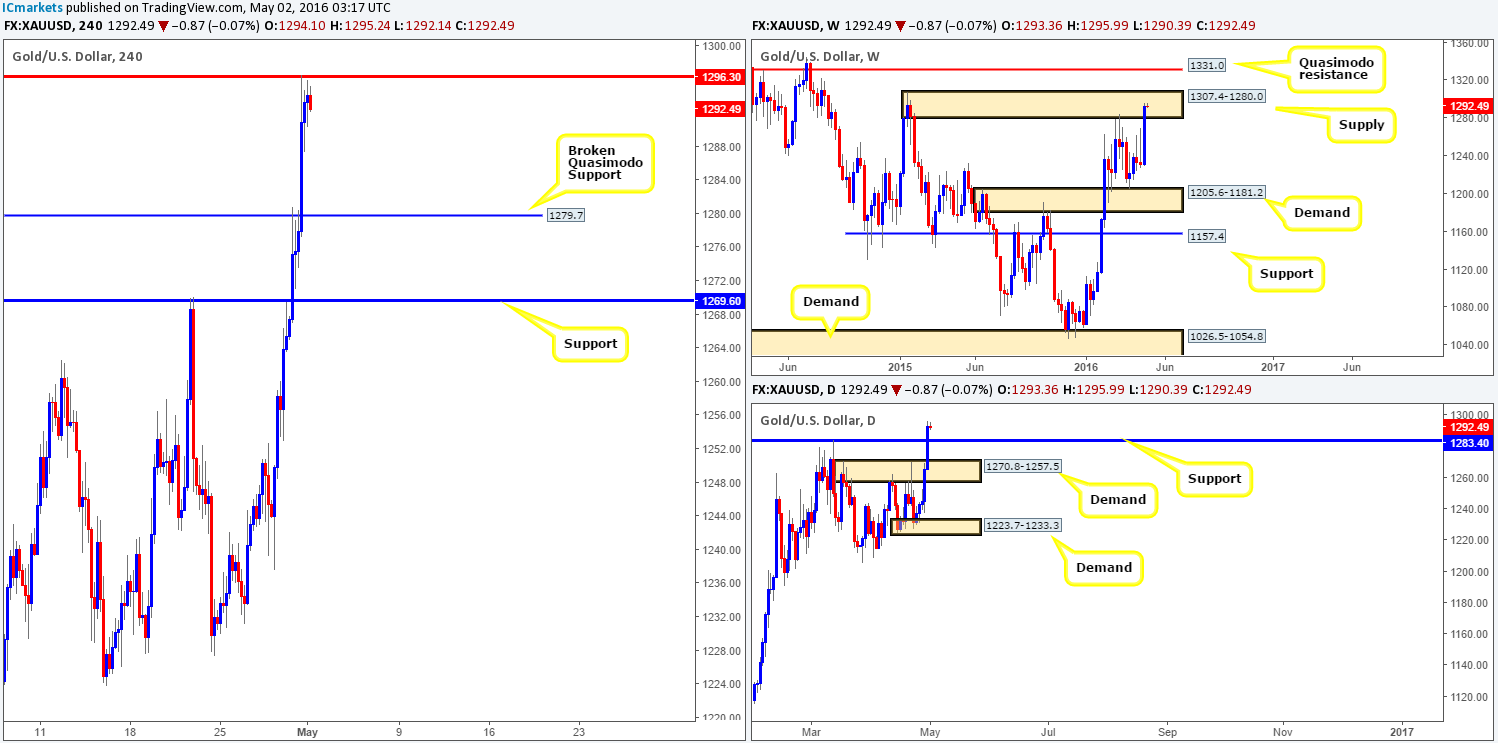
Levels to watch/live orders:
- Buys: Flat (Stop loss: N/A).
- Sells: 1296.3 region [Tentative – confirmation required] (Stop loss: dependent on where one confirms this area).


