
Key risk events today:
Australia Company Operating Profits q/q; China Caixin Manufacturing PMI; UK Final Manufacturing PMI; US ISM Manufacturing PMI.
(Previous analysis as well as outside sources – italics).
EUR/USD:
Weekly gain/loss: +1.63%
Weekly close: 1.1025
Weekly perspective:
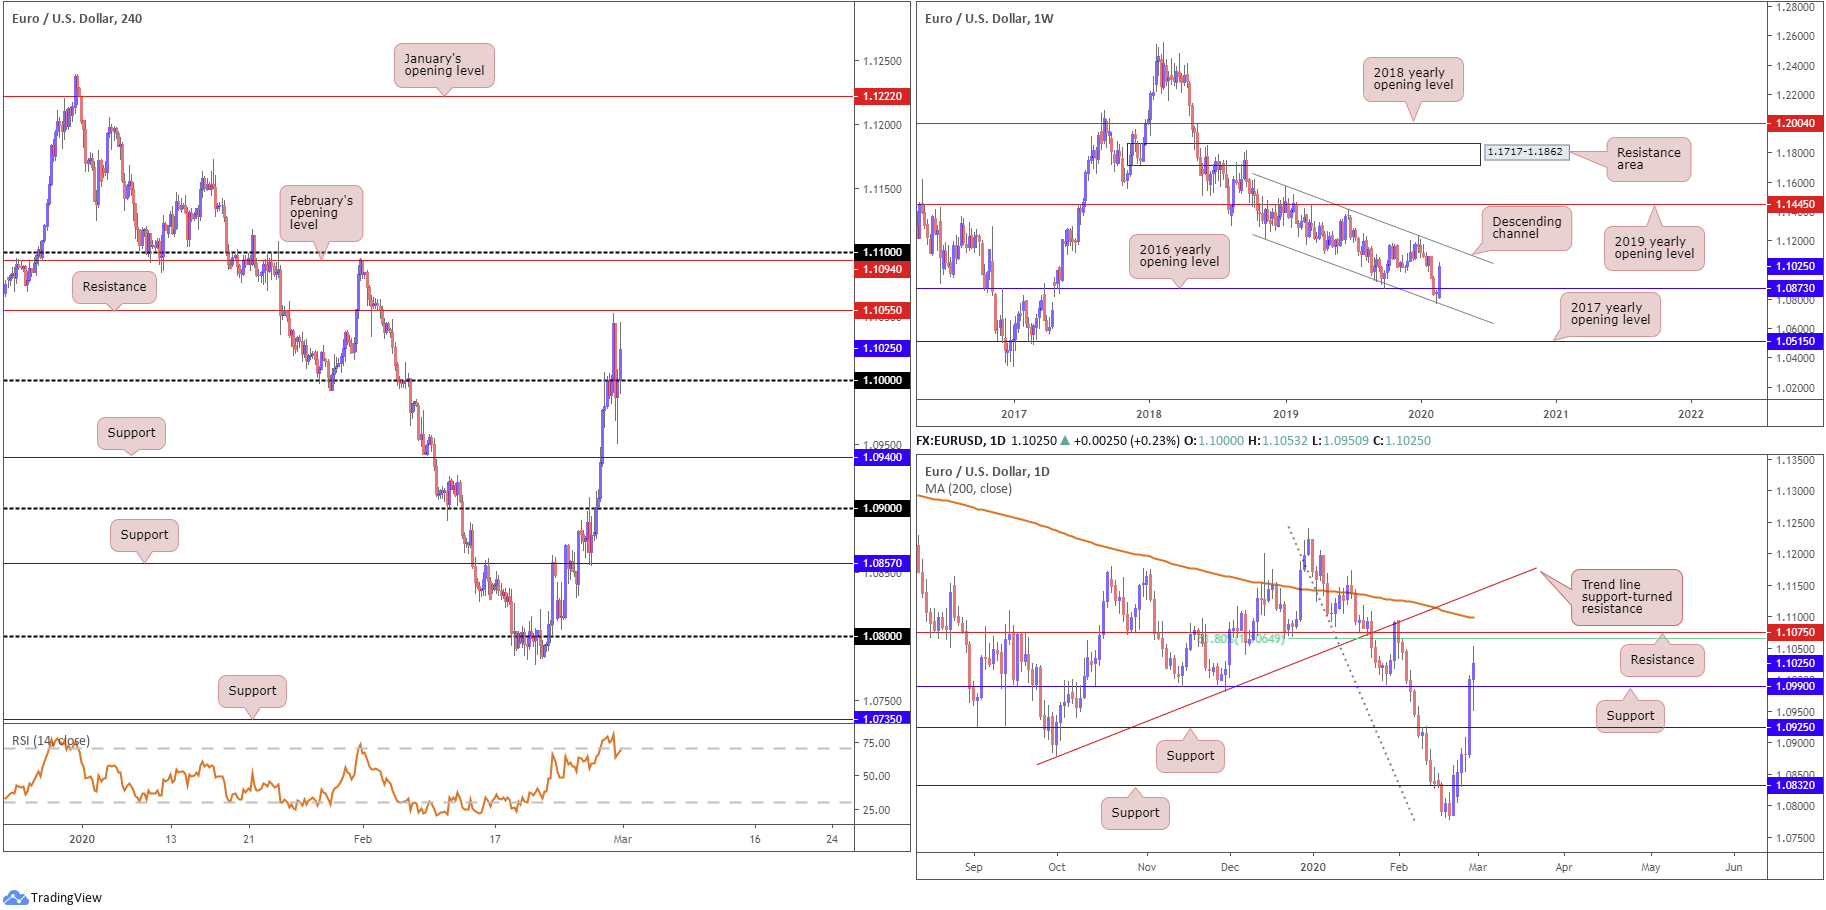
EUR/USD bulls went on the offensive last week, adding more than 170 points into the close. The chart directed focus to the recent break of resistance at 1.0873, the 2016 yearly opening level, after bottoming off channel support, taken from the low 1.1109. Sustained upside this week could lead to channel resistance, extended from the high 1.1569, entering the fight.
In terms of the primary trend, price has traded south since topping in early 2018, at 1.2555.
Daily perspective:
Thanks to recent bidding, price action is seen closing in on a 61.8% Fibonacci resistance at 1.1064, positioned close by resistance drawn from 1.1075, the 200-day SMA (orange – 1.1098) and trend line support-turned resistance, taken from the low 1.0879.
Support on this timeframe can be found around the 1.0990 neighbourhood, with a break exposing 1.0925 as a possible platform.
H4 perspective:
Led by continued underperformance in the US dollar index, Friday established firm footing above the key figure 1.10, though not before dipping to session lows of 1.0950. Modest resistance forms around 1.1055, with headspace north of this figure seen to February’s opening level at 1.1094 and the round number 1.11. Indicator-based traders may also want to note the relative strength index (RSI) is flirting with overbought territory.
On the data front, German prelim CPI ticked higher than expected, though price action remained around pre-announcement levels. Out of the US, personal consumption expenditure reported mildly lower-than-expected numbers, as did the US consumer spending metric, consequently triggering modest selling.
Areas of consideration:
Weekly price shows potential for more EUR/USD upside this week until crossing swords with channel resistance. Elsewhere, daily flow invites an approach to resistance coming in at 1.1075, a level that could hamper upside this week, having seen 61.8% Fibonacci confluence nearby.
Resistance on the H4 timeframe at 1.1055 may be problematic for longs this week, though with daily price suggesting a run to 1.1075, H4 resistance may suffer with price pushing for a test at 1.11. Given the close connection with the 200-day SMA on the daily timeframe, a pullback from 1.11 (and February’s opening level at 1.1094) is certainly a possibility this week and may be something sellers want to investigate.
A break through 1.11, on the other hand, offers a strong cue we’re heading for the weekly channel resistance.
GBP/USD:
Weekly gain/loss: -1.11%
Weekly close: 1.2813
Weekly perspective:
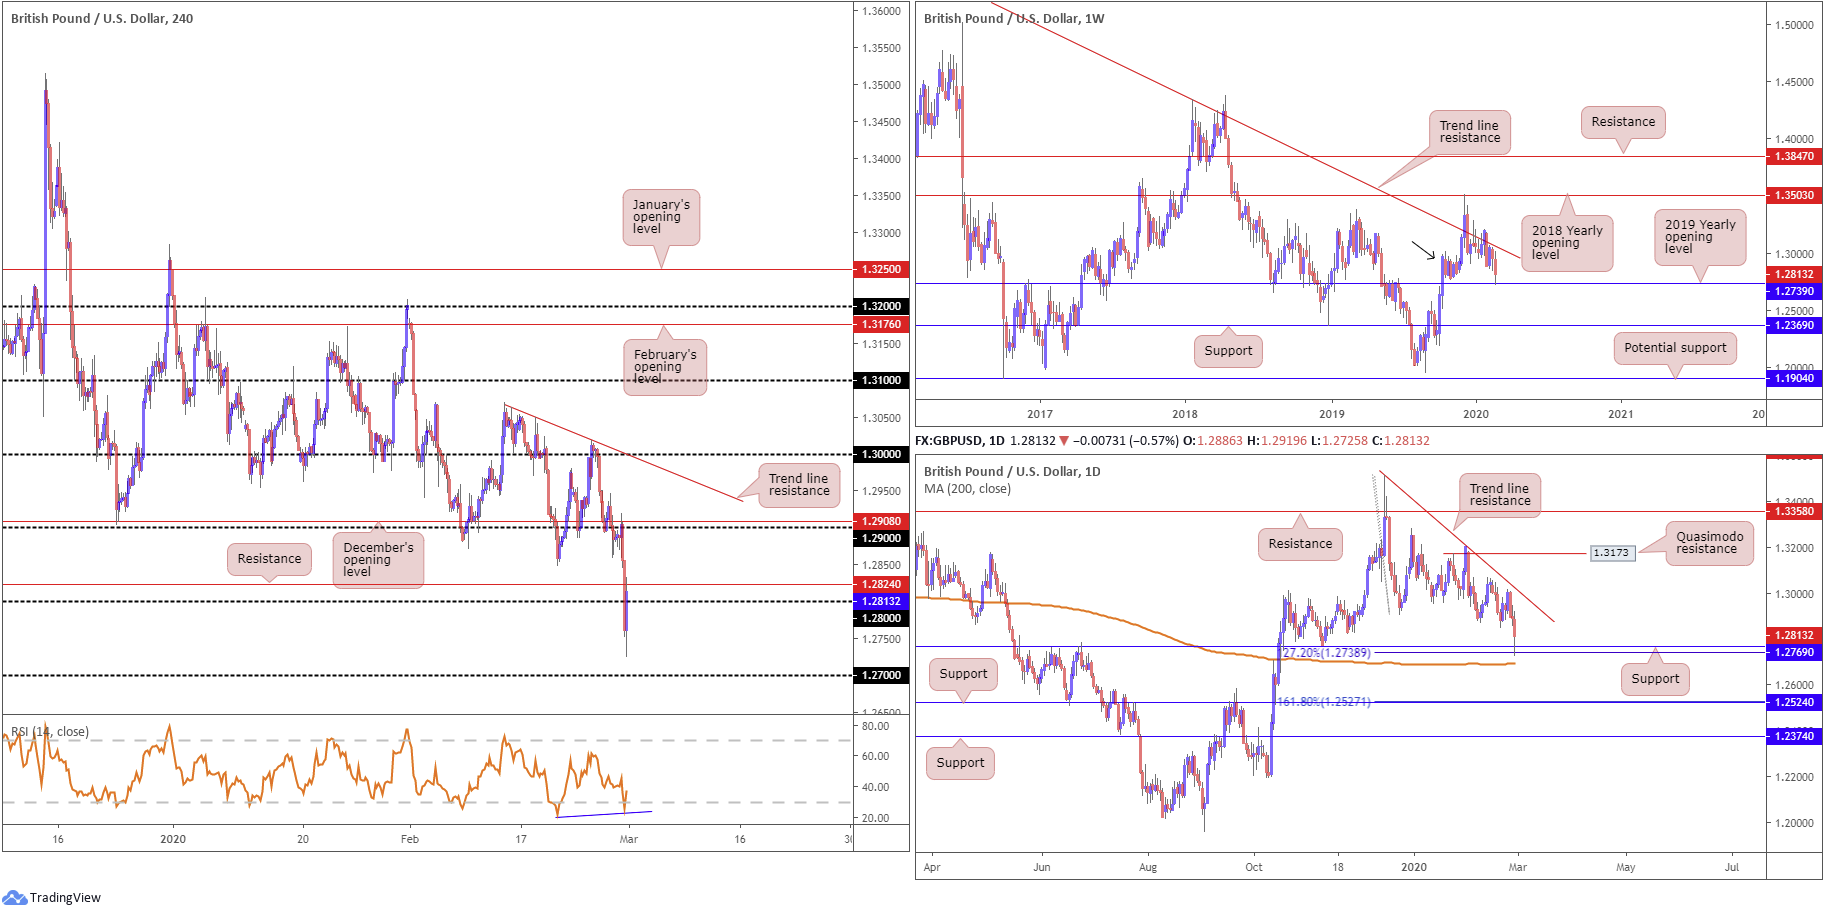
Since the beginning of the year, the unit has been languishing beneath long-standing trend line resistance, pencilled in from the high 1.5930. Last week, however, witnessed sellers strengthen their grip and shake hands with the 2019 yearly opening level at 1.2739, whipsawing through demand around the 1.2939 region (black arrow) and registering fresh YTD lows.
The week concluded chalking up a mild end-of-week correction off 1.2739. A breach of the said support would side-line hopes of recovery and shine the spotlight on support from 1.2369.
Daily perspective:
In conjunction with the weekly timeframe, we can see price action on the daily timeframe ran into a particularly interesting area of support at 1.2769, a 127.2% Fibonacci extension at 1.2738 and the 200-day SMA. Note the said SMA has been flattening since mid-October 2019.
Trend line resistance, extended from the high 1.3514, is next in line should we advance this week. Failure to hold at 1.2769, nonetheless, has support at 1.2524 to target, which happens to merge closely with a 161.8% Fibonacci extension at 1.2527.
H4 perspective:
Uncertainty regarding the future UK-EU trade relationship weighed on sentiment Friday, with price running through support at 1.2824 and the round number 1.28. Price movement bottomed 25 points north of 1.27, pulling back and revisiting 1.28 and 1.2824 as resistance. Technically, the pullback is likely due to higher-timeframe support making an appearance.
Areas of consideration:
Regardless of the unit clocking YTD lows last week, the combined weekly and daily supports between 1.2739 and 1.2769 is likely enough to encourage further upside this week. The close back above 1.28, albeit holding beneath H4 resistance at 1.2824, may be considered a bullish signal by some. Of course, a break of the current H4 resistance, followed up with a strong retest off 1.28, is likely a preferred scenario, targeting 1.29 as the initial base.
AUD/USD:
Weekly gain/loss: -1.82%
Weekly close: 0.6506
Weekly perspective:
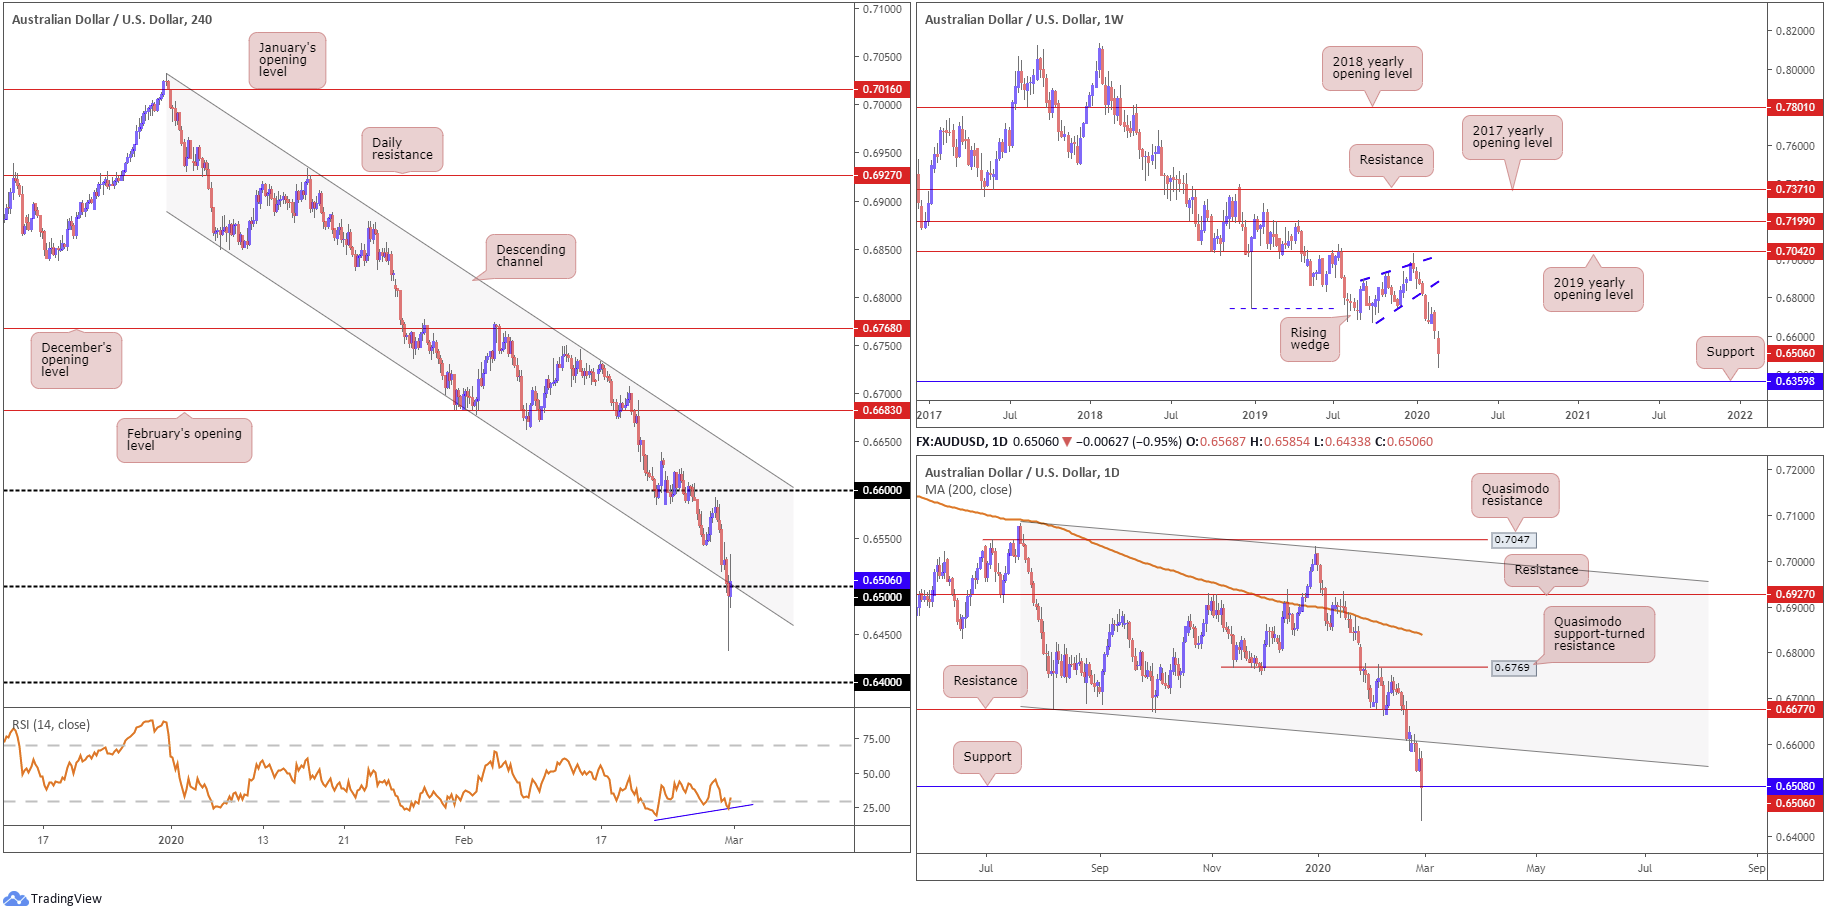
Erasing more than 115 points on the week, AUD/USD is now tilting towards support coming in at 0.6359 this week. Eight out of nine weeks has seen the pair register losses, since topping a touch south of the 2019 yearly opening level at 0.7042, and completing a five-month rising wedge pattern.
Note the primary trend has faced south since 2018, and we’re now testing decade lows in this market.
Daily perspective:
After violating channel support, taken from the low 0.6677, and later retesting the lower boundary as resistance, renewed selling emerged, with Friday aggressively grasping support at 0.6508.
0.6301 remains in view as the next support target, in the event we press for lower ground over the coming weeks.
H4 perspective:
Friday had the H4 candles swing to multi-year lows at 0.6433, breaching the 0.65 handle and channel support, taken from the low 0.6850. Due to the pair staging a reasonably strong recovery in US hours, however, the week ended with price marginally reclaiming 0.65+ status.
In terms of resistance on this scale, the 0.6542 February 26th low could hinder upside this week. Headspace above this barrier, nonetheless, could swerve towards the 0.66 handle and channel resistance, etched from the high 0.7031.
The relative strength index (RSI) is attempting to recover from oversold waters, producing bullish divergence.
Areas of consideration:
While a rebound higher could form on the H4 and daily timeframes this week, the threat of further downside materialising on the weekly timeframe may deter buyers in this market. The long-term primary trend should also not be overlooked.
As such, buyers may want to approach with caution, while sellers likely have eyes on a H4 close back beneath 0.65 for a run to 0.64 on the H4 scale, followed by weekly support at 0.6359.
USD/JPY:
Weekly gain/loss: -3.16%
Weekly close: 108.07
Weekly perspective:
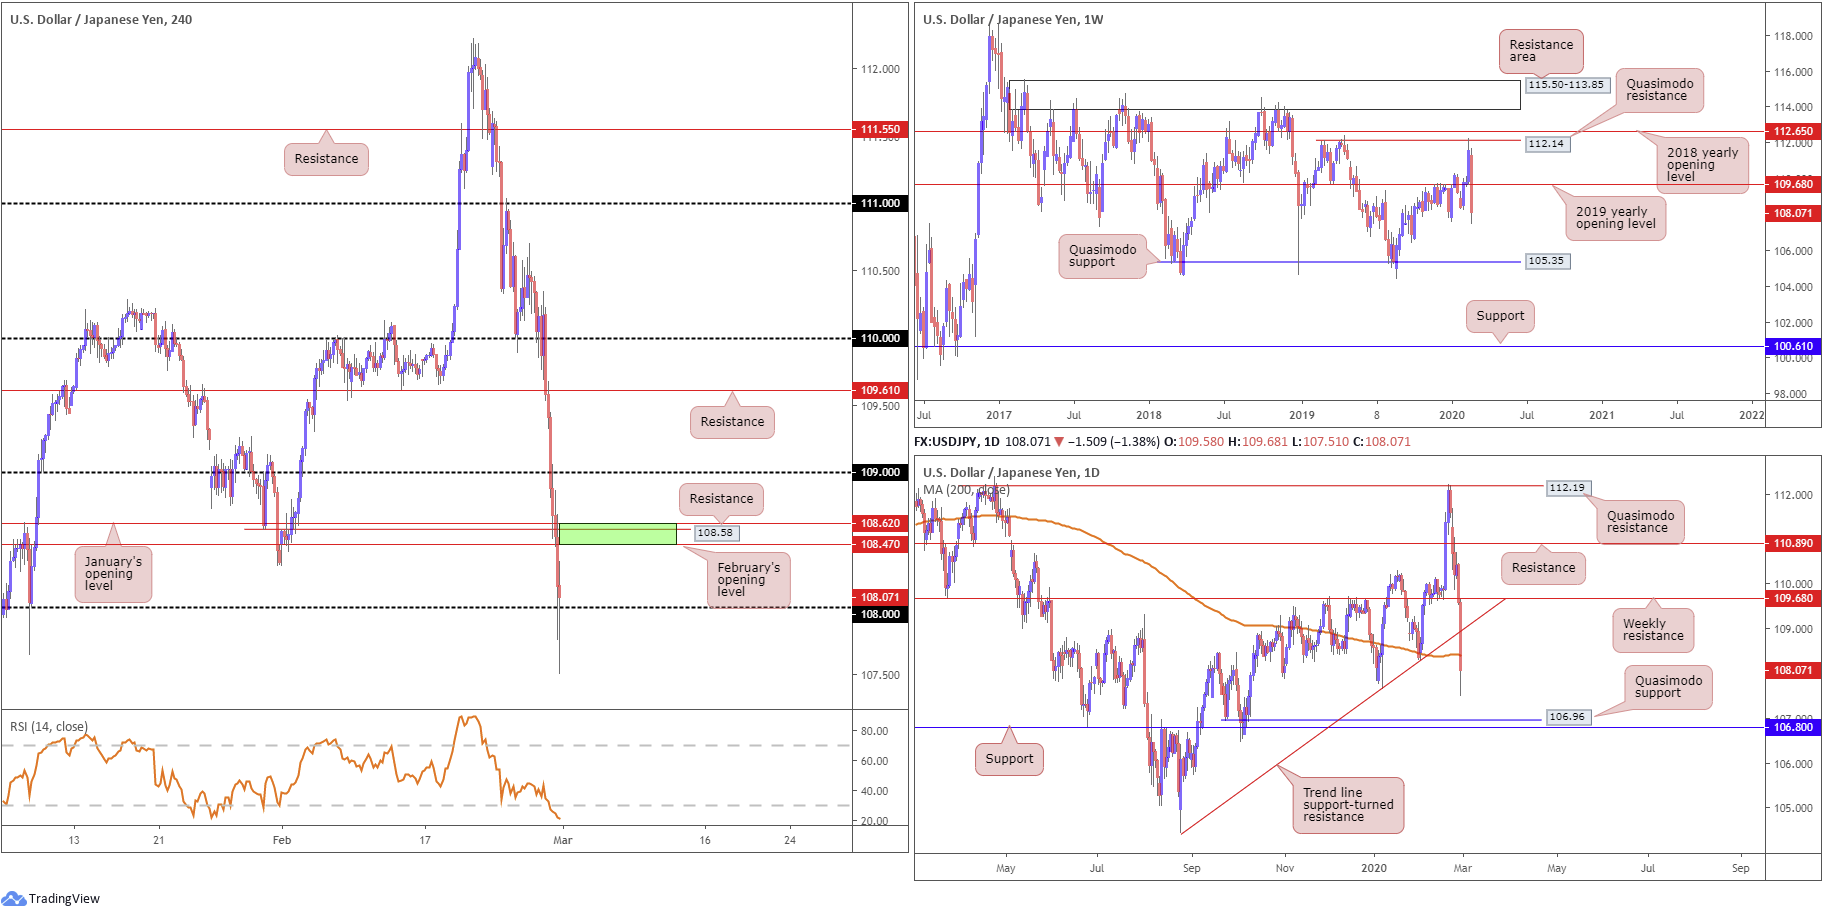
Shedding more than 350 points on the week, recording its largest weekly drop since July 2016, USD/JPY extended the prior week’s rejection off Quasimodo resistance at 112.14 and toppled the 2019 yearly opening level at 109.68. Aside from support possibly developing off the 107.65 January 8th low or the 106.48 September (2019) 30th low, the next support target can be seen around Quasimodo support off 105.35.
Daily perspective:
In one fell swoop, Friday’s daily candle, registering a daily loss of 150 points, engulfed trend line support, drawn from the low 104.44, split the 200-day SMA and pierced the 107.65 January 8th low.
Support falls in relatively close by at 106.96, a Quasimodo support, followed by support coming in at 106.80. The 200-day SMA may offer resistance on this timeframe, as might the recently broken trend line support.
H4 perspective:
Friday’s precipitous decline, along with waning US Treasury yields, observed the pair jumped through a number of key technical support levels. The unit wrapped up the day aggressively whipsawing through 108, driving the relative strength index (RSI) deep into oversold territory, while mildly paring losses into the close.
To the upside, a reasonably nice-looking area of resistance exists between 108.62/108.47 (green), comprised of January’s opening level at 108.62, resistance at 108.58 and February’s opening level at 108.47.
Areas of consideration:
Seeing the 200-day SMA currently circulate around the 108.40 region, a response from the H4 resistance area at 108.62/108.47 is likely in store this week, therefore sellers may want to make a note of this zone. The fact we also pierced 108 and the 107.65 January 8th low, likely tripping sell stops, adds weight to further selling this week, targeting the 107 handle on the H4 (the next downside target on that timeframe), shadowed by daily Quasimodo support at 106.96.
USD/CAD:
Weekly gain/loss: +1.30%
Weekly close: 1.3390
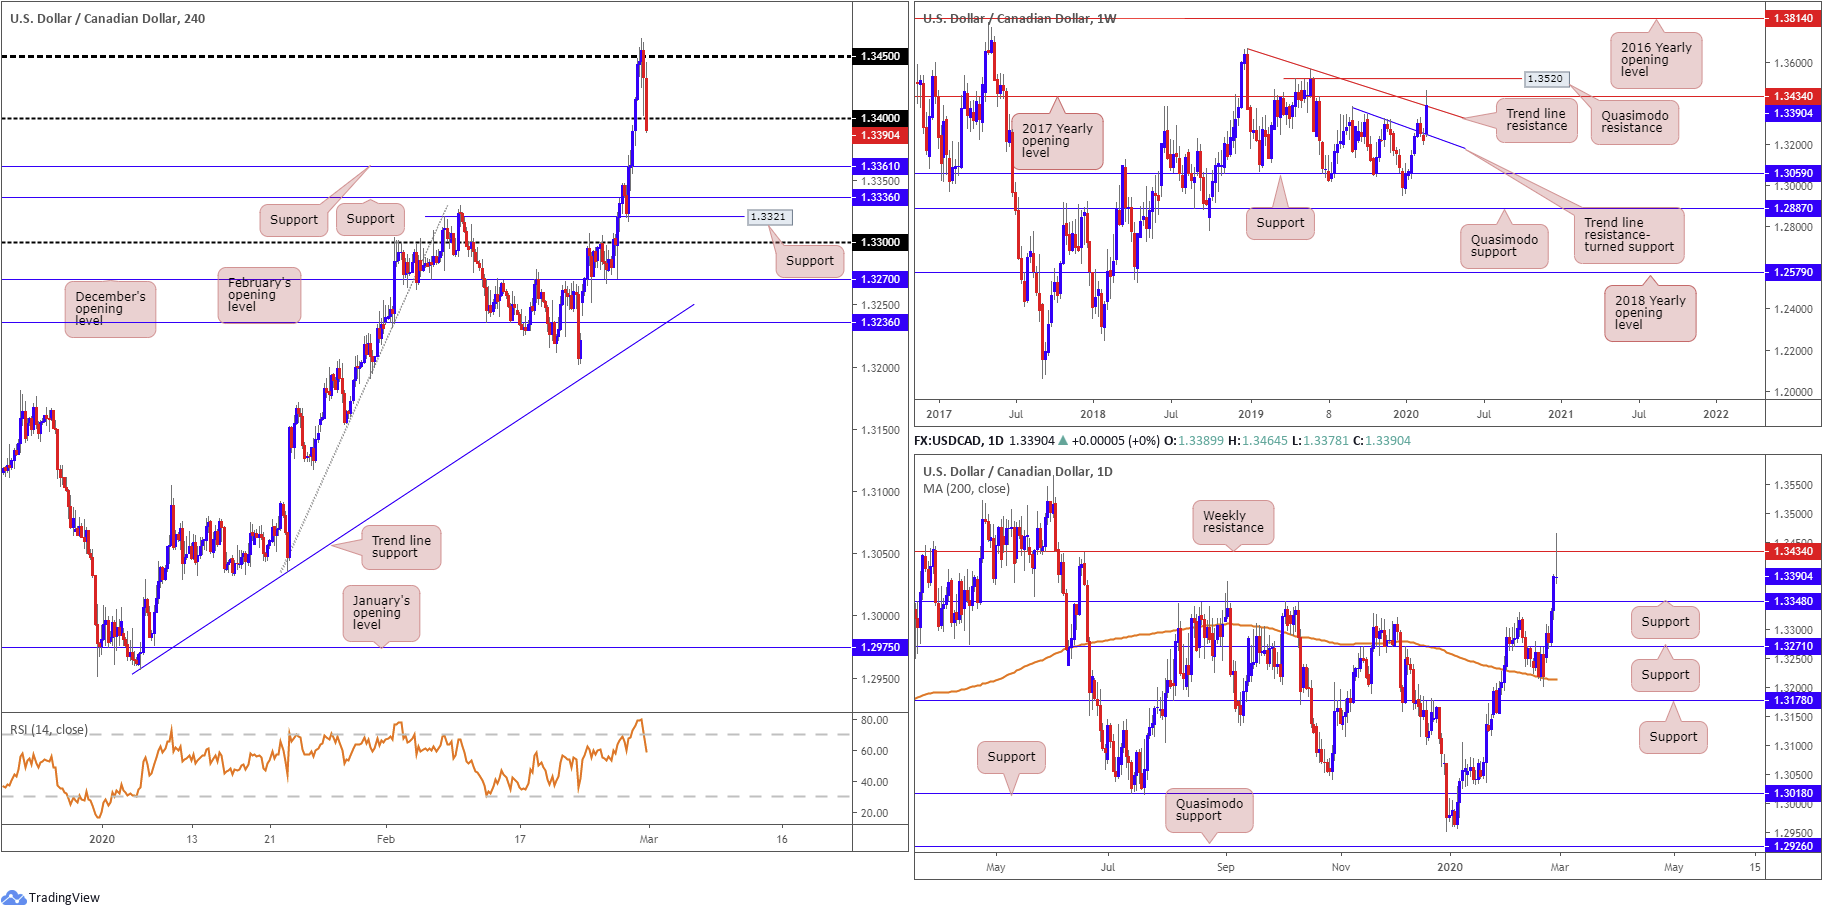
Weekly perspective:
Coming off a two-week modest correction from 1.3329, last week eclipsed the 1.3382 September 2nd high and grasped trend line resistance, from the high 1.3664, and the 2017 yearly opening level at 1.3434. Another worthy contender, in terms of resistance on this scale, is the Quasimodo formation at 1.3520.
As for support on this timeframe, a local trend line resistance-turned support, pencilled in from the high 1.3382, may enter view, with a break of here possibly clearing the runway to support at 1.3059.
Daily perspective:
After rushing resistance at 1.3348, now a serving support, Friday’s action extended upside to multi-month tops at 1.3464, forming a clear-cut shooting star pattern (considered a bearish indicator at peaks) off the 2017 yearly opening level mentioned above on the weekly timeframe at 1.3434.
H4 perspective:
Friday saw the candles test 1.3450 and pullback amid US hours, closing marginally south of 1.34 into the close, perhaps clearing downside to H4 support at 1.3361, shadowed closely by support at 1.3336. Note also the relative strength index (RSI) peaked at 80.00, before exiting overbought waters on Friday.
Last week saw WTI erase more than 15%, amid heightened concerns surrounding the coronavirus, consequently making it difficult for the Canadian dollar to find demand.
Areas of consideration:
Owing to H4 concluding modestly beneath 1.34, and weekly price testing resistances, along with daily flow chalking up a bearish candlestick configuration, downside may be on the cards today/early week. Aggressive traders may short at the open, with protective stop loss orders positioned accordingly; conservative traders, nevertheless, may wait and see if a retest at 1.34 forms before pulling the trigger. This helps identify seller intent and avoid unnecessary losses on whipsaws, which are common viewing around psychological levels.
USD/CHF:
Weekly gain/loss: -1.36%
Weekly close: 0.9650
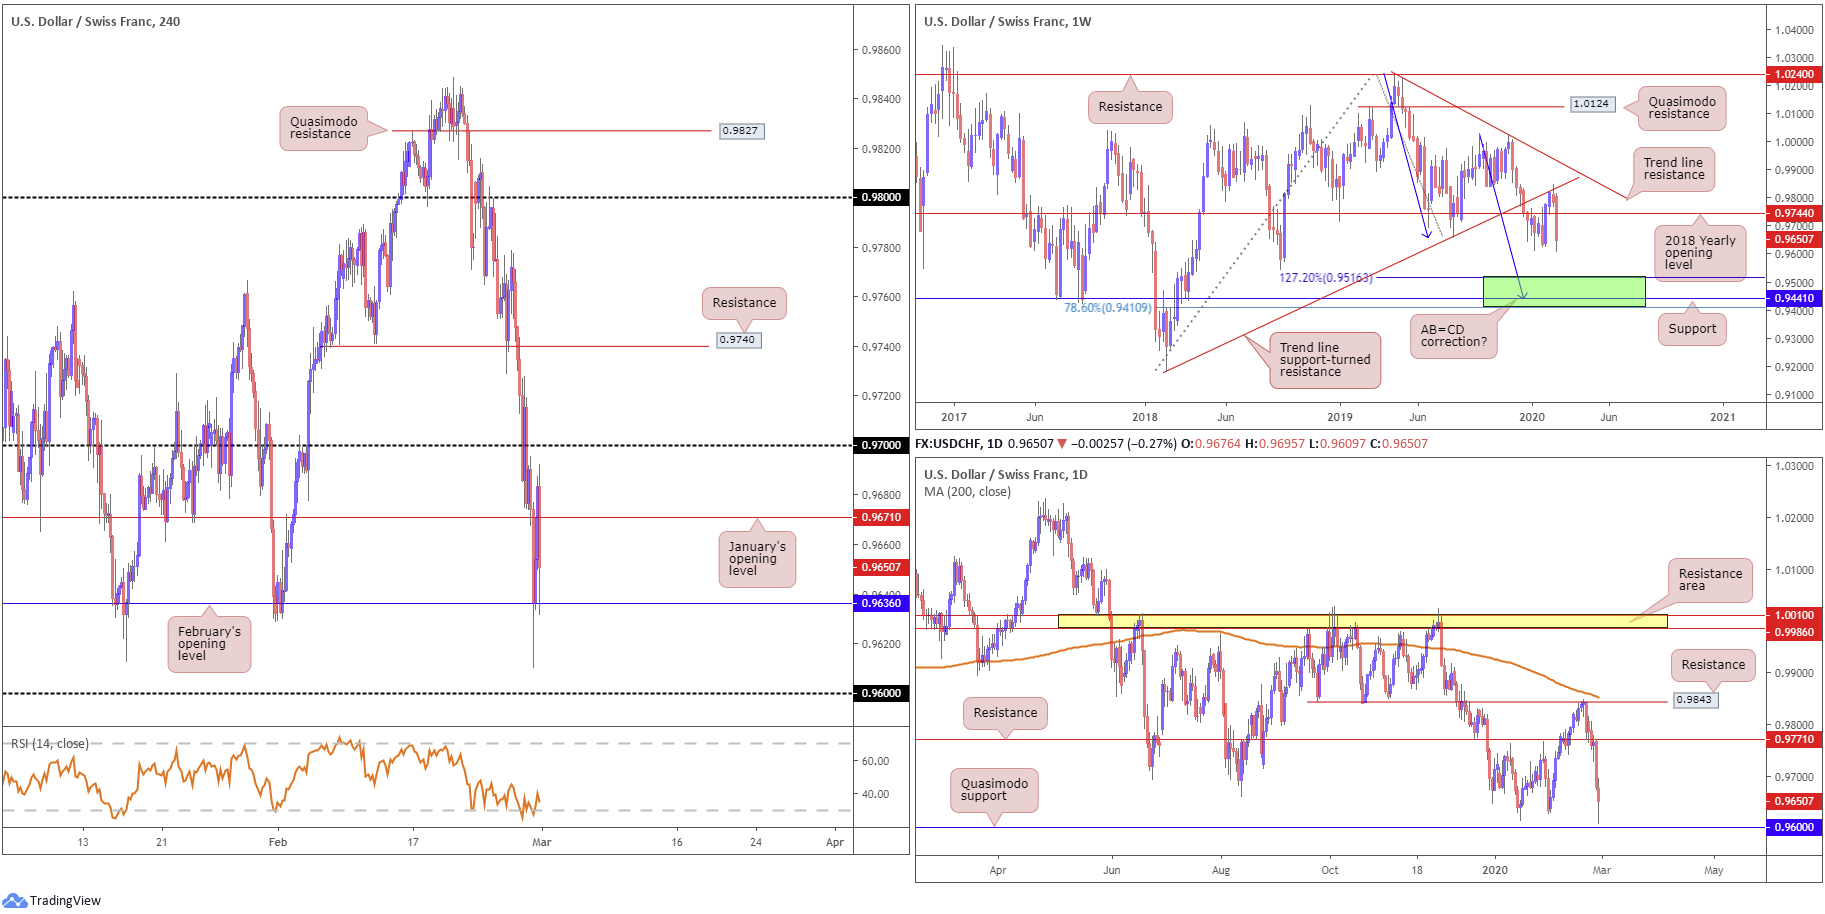
Weekly perspective:
Trend line support-turned resistance, extended from the low 0.9187, elbowed its way into the spotlight two weeks ago, with healthy follow-through selling materialising last week. The 2018 yearly opening level at 0.9744, as you can see, ceded ground, sending the unit to lows at 0.9609.
The 0.9613 January 16th low is seen as possible support this week, followed by 0.9410/0.9516 (green) – comprised of a 78.6% Fibonacci retracement at 0.9410, support at 0.9441 and a 127.2% AB=CD bullish correction (black arrows]) at 0.9516.
Daily perspective:
After thrashing support at 0.9771 last week, now a serving resistance, the pair is on course to test Quasimodo support at 0.9600, sited just south of the 0.9613 January 16th low.
H4 perspective:
A waning buck and intense flight-to-safety pulled USD/CHF to 0.9609 Friday, its lowest level since September 2018. February’s opening level at 0.9636 held as support, albeit suffering a rather aggressive whipsaw. January’s opening level at 0.9671 remains a resistance. The psychological level at 0.96 is also of interest, as is 0.97 as resistance. With respect to the relative strength index (RSI), the value fluctuated around oversold waters since the beginning of the week, and remained as such into the close.
Areas of consideration:
Quasimodo support on the daily timeframe at 0.9600 aligns with the round number 0.96 on the H4 scale, therefore offering confluent support at this region this week for a potential rebound higher. Round numbers are prone to whipsaws, so traders may still seek additional confirmation off 0.96 before committing.
Dow Jones Industrial Average:
Weekly gain/loss: -11.40%
Weekly close: 25696
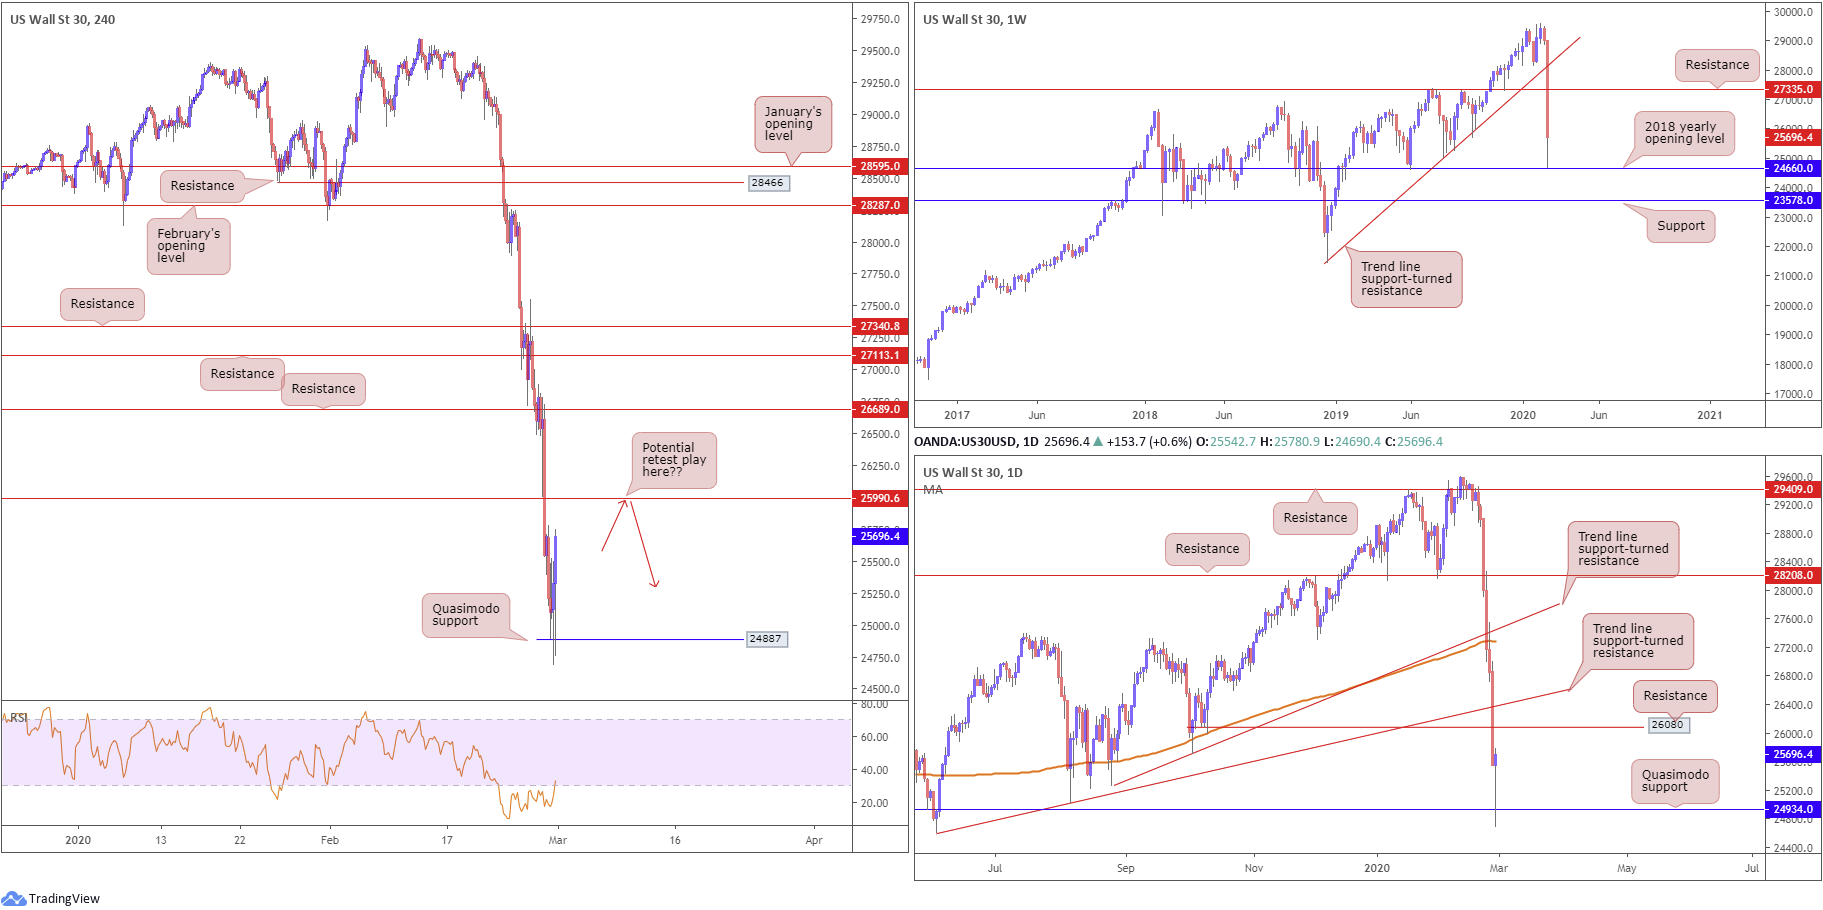
Weekly perspective:
Last week witnessed trend line support, taken from the low 21452, and support at 27335, cede ground, both now serving resistances, as the index recorded its worst weekly decline since October 2008. Technical headlines had the index marginally off session lows, a few points north of the 2018 yearly opening level at 24660, which, as you can see, provided to-the-point support in June 2019.
Daily perspective:
A closer reading of price action on the daily timeframe has the unit currently fading Quasimodo support drawn in at 24934 after overthrowing trend line support, extended from the low 24604, and support coming in at 26080, now a serving resistance.
According to CFD prices (US30), the daily timeframe printed a hammer candlestick pattern Friday; this is considered a bullish signal and could generate moves to resistance mentioned above at 26080 this week.
H4 perspective:
Amid intensifying fears over the potential degree of damage the spread of COVID-19 will inflict on the global economy, risk sentiment was battered into the close, losing more than 3000 points on the week. The Dow Jones Industrial Average lost 357.28 points, or 1.39%; the S&P 500 declined 24.54 points, or 0.82% while the tech-heavy Nasdaq 100 ended higher by 25.17 points, or 0.30%.
Friday’s modest recovery chalked up a Quasimodo support level at 24887, with price action poised to approach resistance coming in at 25990. This resistance is particularly interesting, having seen daily resistance at 26080 located just north of the barrier. The relative strength index (RSI) is seen crawling out of oversold space, with the value marginally tipping above 30.00 Friday.
Areas of consideration:
Technically, the combination of H4 resistance at 25990 and daily resistance at 26080 offer a potential reversal zone to work with this week. The problem arises when you take into account weekly price came within a few points of connecting with the 2018 yearly opening level at 24660. To overcome this, sellers might consider waiting for additional bearish confirmation off 25990 before pulling the trigger. This could be something as simple as a bearish candlestick pattern.
XAU/USD (GOLD):
Weekly gain/loss: -3.50%
Weekly close: 1585.6
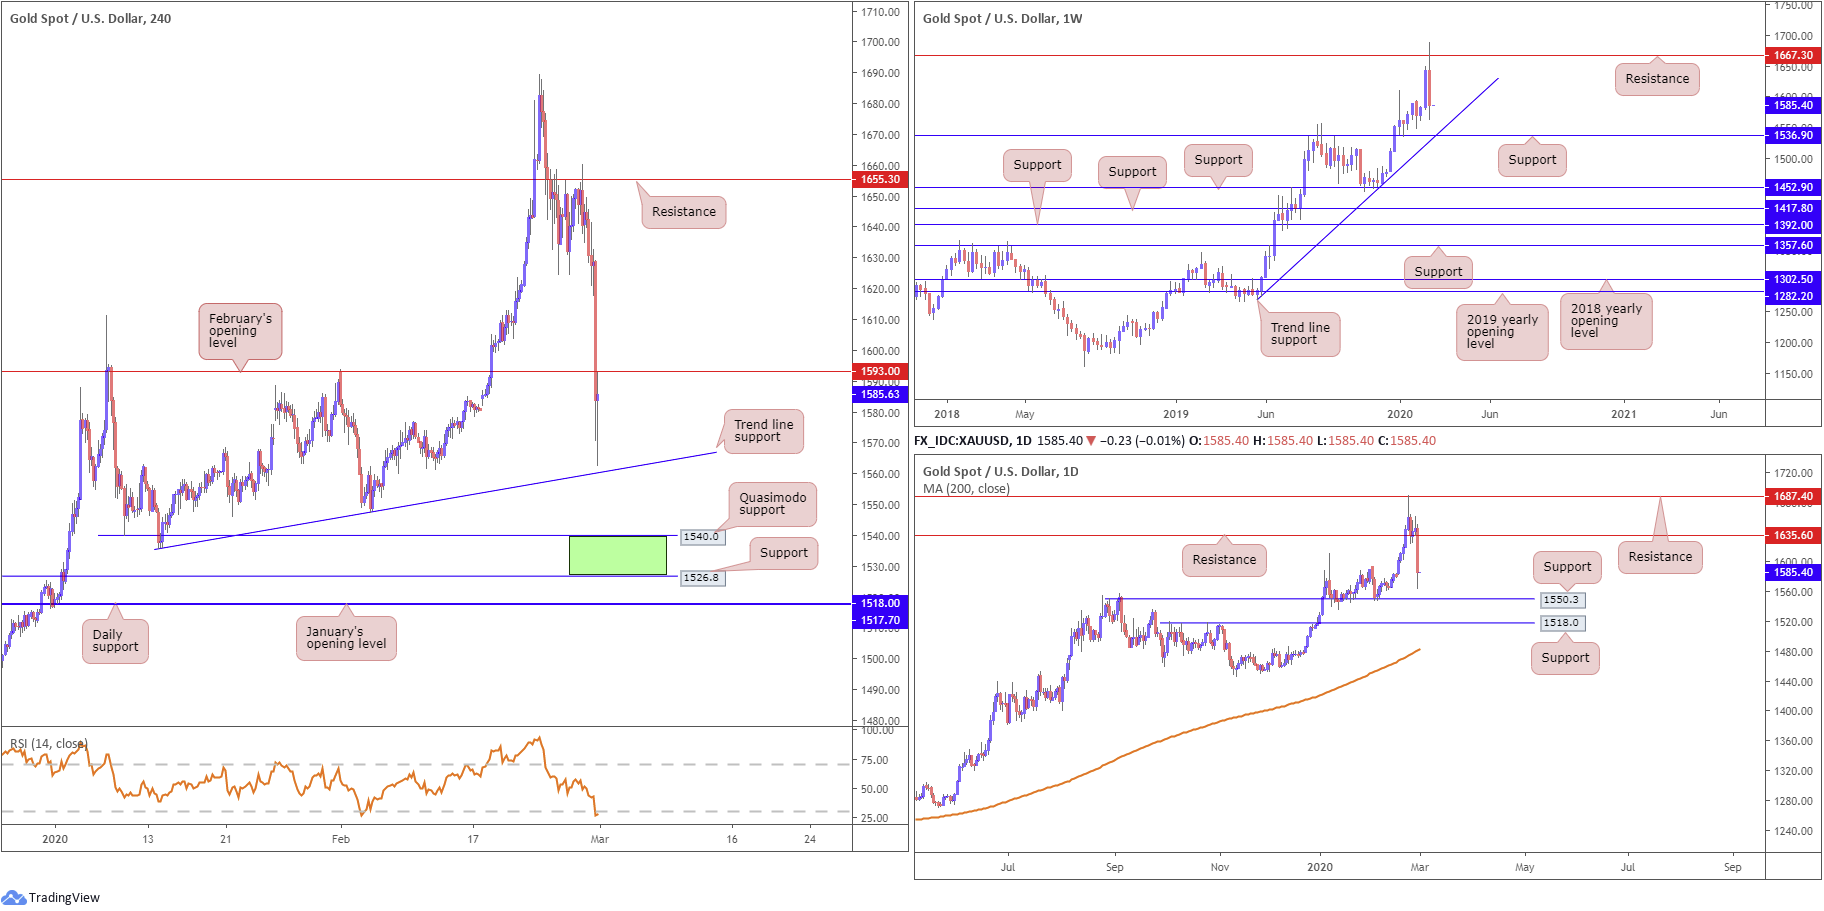
Weekly perspective:
Formed in the shape of a bearish outside candle pattern, weekly price faded multi-year peaks at 1689.3 last week, capped by resistance at 1667.3, and shed more than $55 by the close.
Trend line support, drawn from the low 1269.6, along with support plotted at 1536.9, represent potential downside targets on this timeframe this week. A break of the said levels has support at 1452.9 to target.
Daily perspective:
On the daily timeframe, resistance entered the fold at 1687.4 at the beginning of last week, with support making a show at 1635.6. Friday, however, aggressively took to the downside, rupturing the said support and ending the week a touch off session lows at 1563.1.
Support at 1550.3 is seen as a possible floor in this market this week, with a break, highlighting support nearby at 1518.0. Note the 200-day SMA has drifted north since early 2019.
H4 perspective:
The price of gold, in $ terms, underperformed Friday, despite dented risk sentiment amid coronavirus fears. Traders had varied explanations for the drop, including overbought conditions triggered a round of profit taking, and commentary from Bloomberg stating the precious metal had been hurt by margin calls as several funds needed the cash amid the stock market crash.
Regardless of the driver, the H4 candles ended the day retesting the underside of February’s opening level at 1593.0, after missing trend line support by a hair, taken from the low 1536.0. Beyond this level, though, we can see Quasimodo support at 1540.0, followed by support at 1526.8. Also of interest is the relative strength index (RSI) recently entering oversold ground.
Areas of consideration:
The green area marked on the H4 timeframe between 1526.8/1540.0 is likely of interest for potential long opportunities this week. Although the outer perimeters form by way of H4 supports, within holds the weekly support level mentioned above at 1536.9 and the converging trend line support. Despite the confluence, a fakeout through the area to daily support at 1518.0 may occur, which, as you can see, fuses with January’s opening level at 1517.7.
Traders are also urged to pencil in the possibility of daily support at 1550.3 holding price higher this week, and possible bearish scenarios occurring off February’s opening level at 1593.0.
The accuracy, completeness and timeliness of the information contained on this site cannot be guaranteed. IC Markets does not warranty, guarantee or make any representations, or assume any liability regarding financial results based on the use of the information in the site.
News, views, opinions, recommendations and other information obtained from sources outside of www.icmarkets.com.au, used in this site are believed to be reliable, but we cannot guarantee their accuracy or completeness. All such information is subject to change at any time without notice. IC Markets assumes no responsibility for the content of any linked site.
The fact that such links may exist does not indicate approval or endorsement of any material contained on any linked site. IC Markets is not liable for any harm caused by the transmission, through accessing the services or information on this site, of a computer virus, or other computer code or programming device that might be used to access, delete, damage, disable, disrupt or otherwise impede in any manner, the operation of the site or of any user’s software, hardware, data or property.


