
EUR/USD:
Weekly gain/loss: -0.27%
Weekly closing price: 1.2320
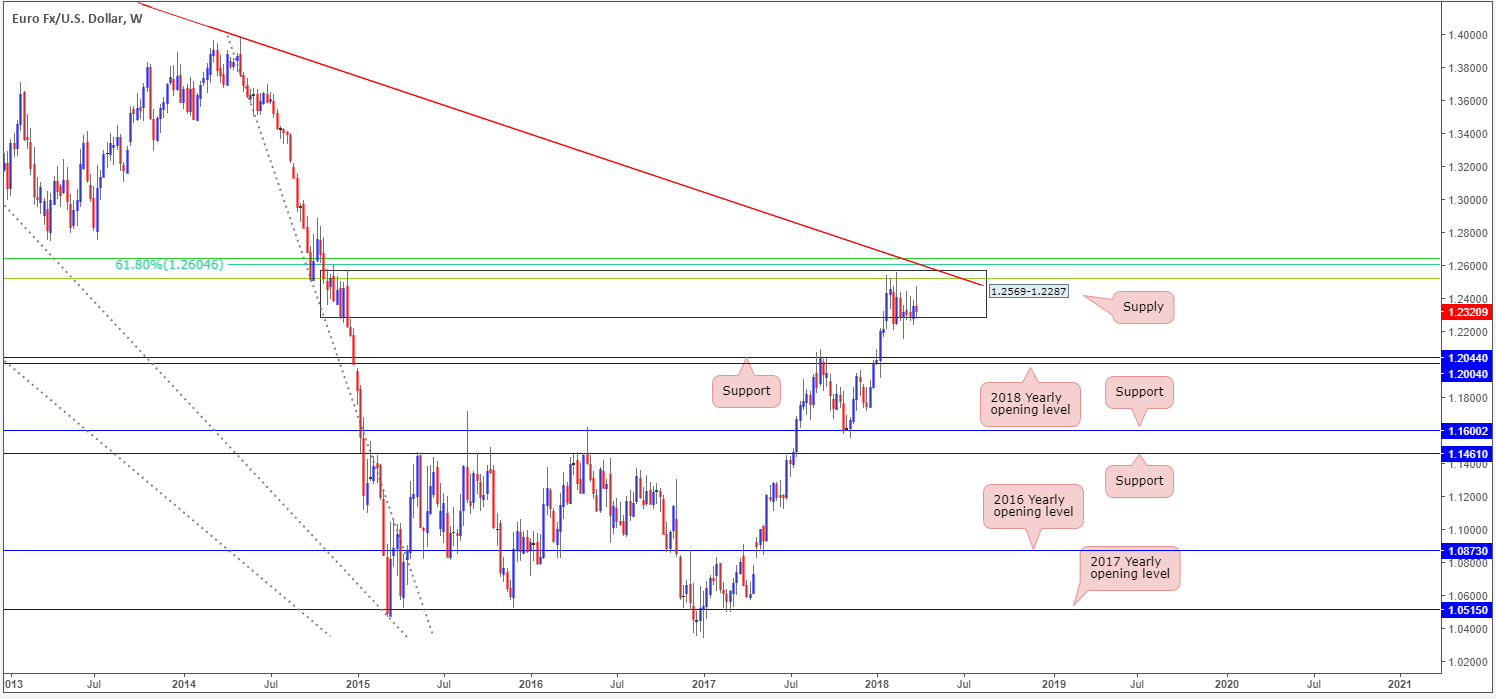
As is clearly seen on the weekly timeframe, the buyers and sellers have been battling for position within a major-league weekly supply at 1.2569-1.2287 since late January. Circling around the top edge of this zone is also a weekly Fibonacci resistance cluster (see below for the values) and long-term weekly trendline resistance extended from the high 1.6038. Should sellers crank it up a gear this week, downside targets fall in around the weekly support band at 1.2044, shadowed closely by the 2018 yearly opening level at 1.2004.
- 61.8% Fib resistance at 1.2604 taken from the high 1.3993.
- 50.0% Fib resistance at 1.2644 taken from the high 1.4940.
- 38.2% Fib resistance at 1.2519 taken from the high 1.6038.
The story on the daily timeframe, however, reveals that the major is, technically speaking, currently unable to press lower due to a daily support area seen at 1.2246-1.2164, which happens to merge beautifully with a long-term daily trendline support etched from the low 1.0569. A violation of this area this week would likely shine the spotlight on daily support plotted at 1.2070, which is positioned slightly above the aforementioned weekly supports.
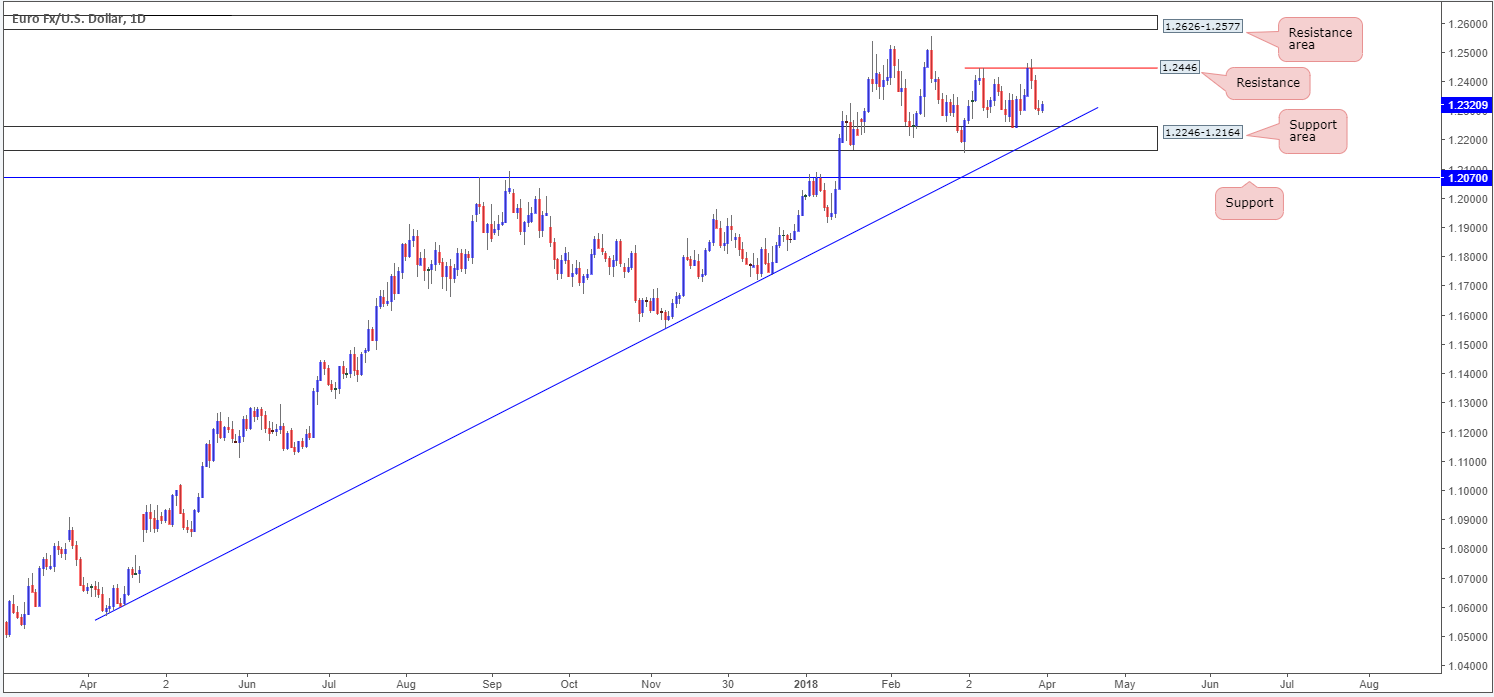
According to our technicals, higher-timeframe action is somewhat restricted for the time being. Unless a break of the current daily support area is observed, medium/long-term positions are going to be a challenge.
GBP/USD:
Weekly gain/loss: -0.83%
Weekly closing price: 1.4026
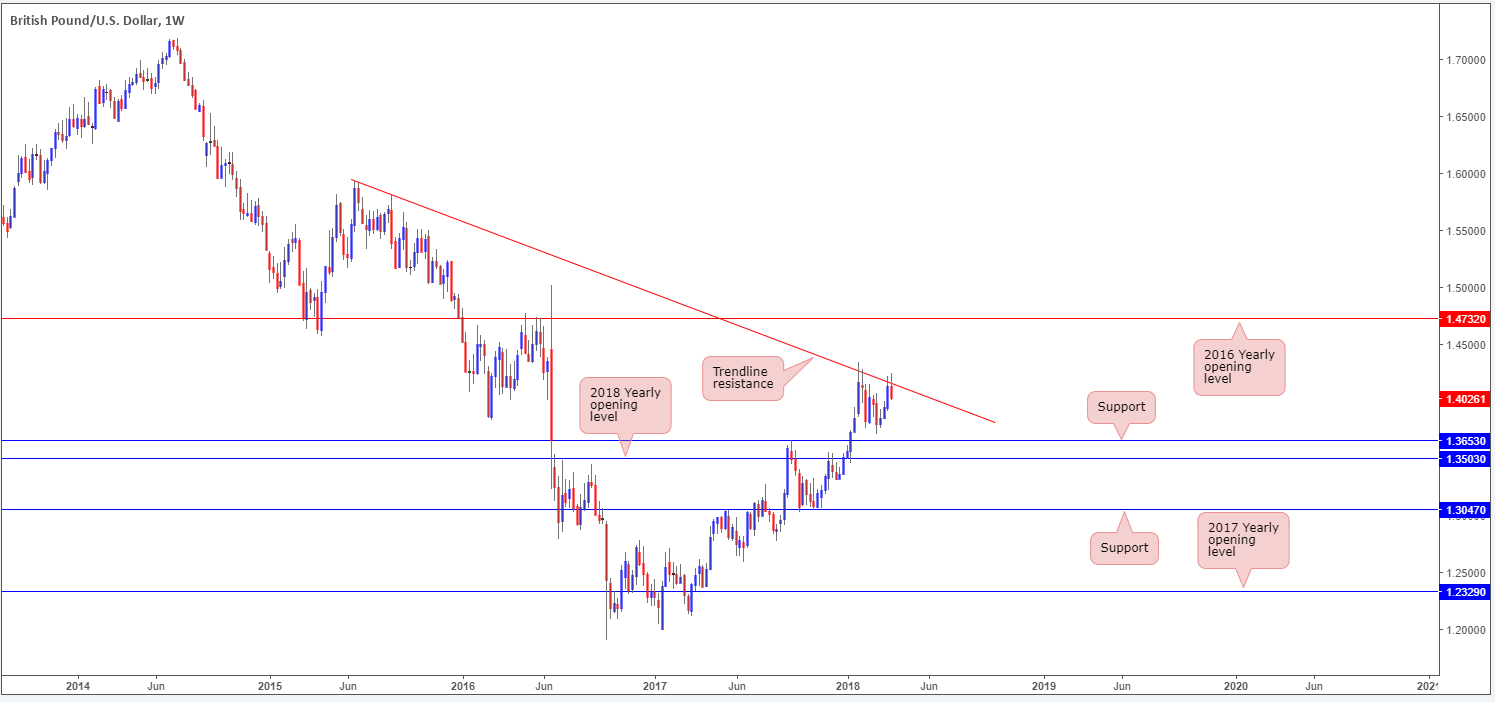
Highlighted as a possibility in our previous weekly report, the British pound did indeed firmly reject the weekly trendline resistance taken from the high 1.5930 last week. Having seen this line force price in excess of 500 pips lower in early January, we may see history repeat itself here.
Breaking a three-week bullish phase, this has placed the Feb 26 weekly low in view at 1.3711, followed closely by weekly support plugged in at 1.3653.
In conjunction with weekly structure, we can see that daily movement also recently crossed swords with a daily supply zone at 1.4278-1.4188. Regarding this scale, there’s not much seen stopping cable from reaching daily support at 1.3904 this week, and, with a little bit of oomph, quite possibly the daily support band coming in at 1.3764.
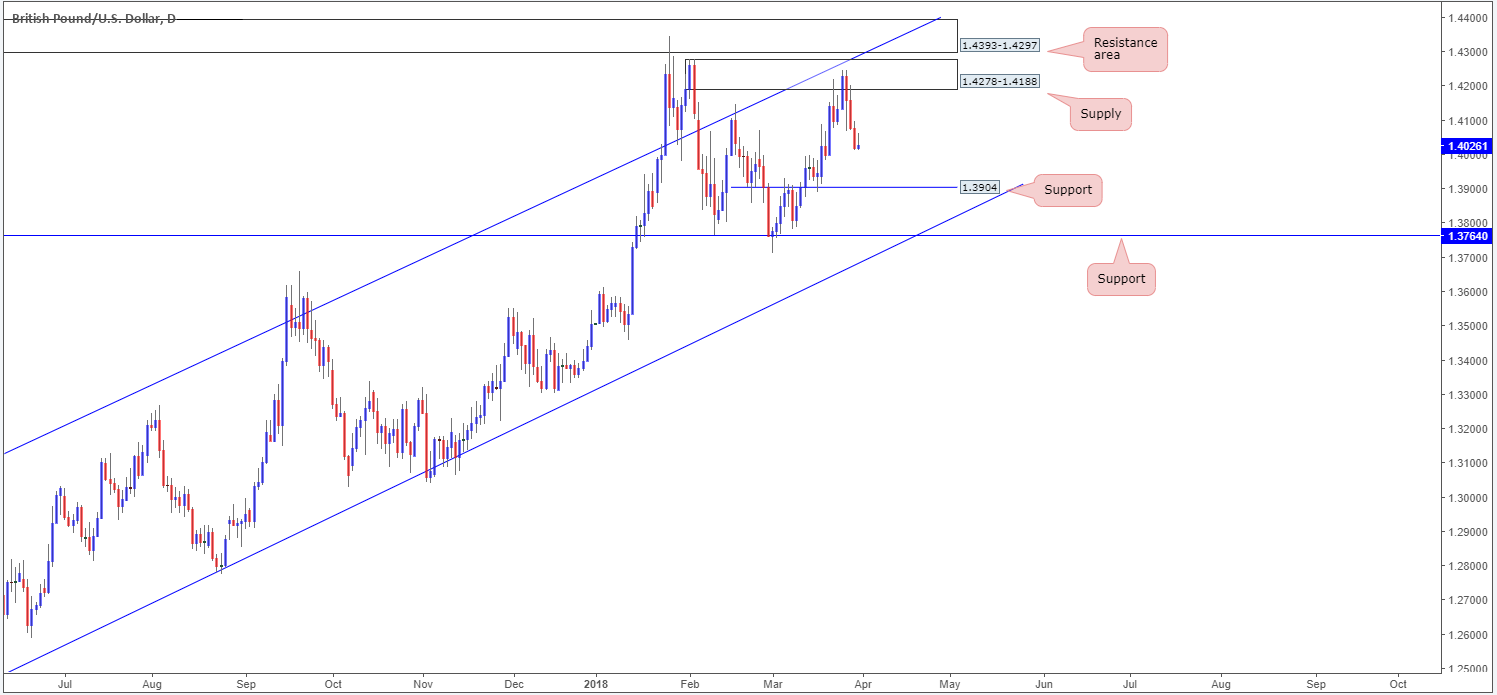
Downside is reasonably free in this market right now on both weekly and daily charts, offering traders the opportunity to possibly sell this market on the lower timeframes this week.
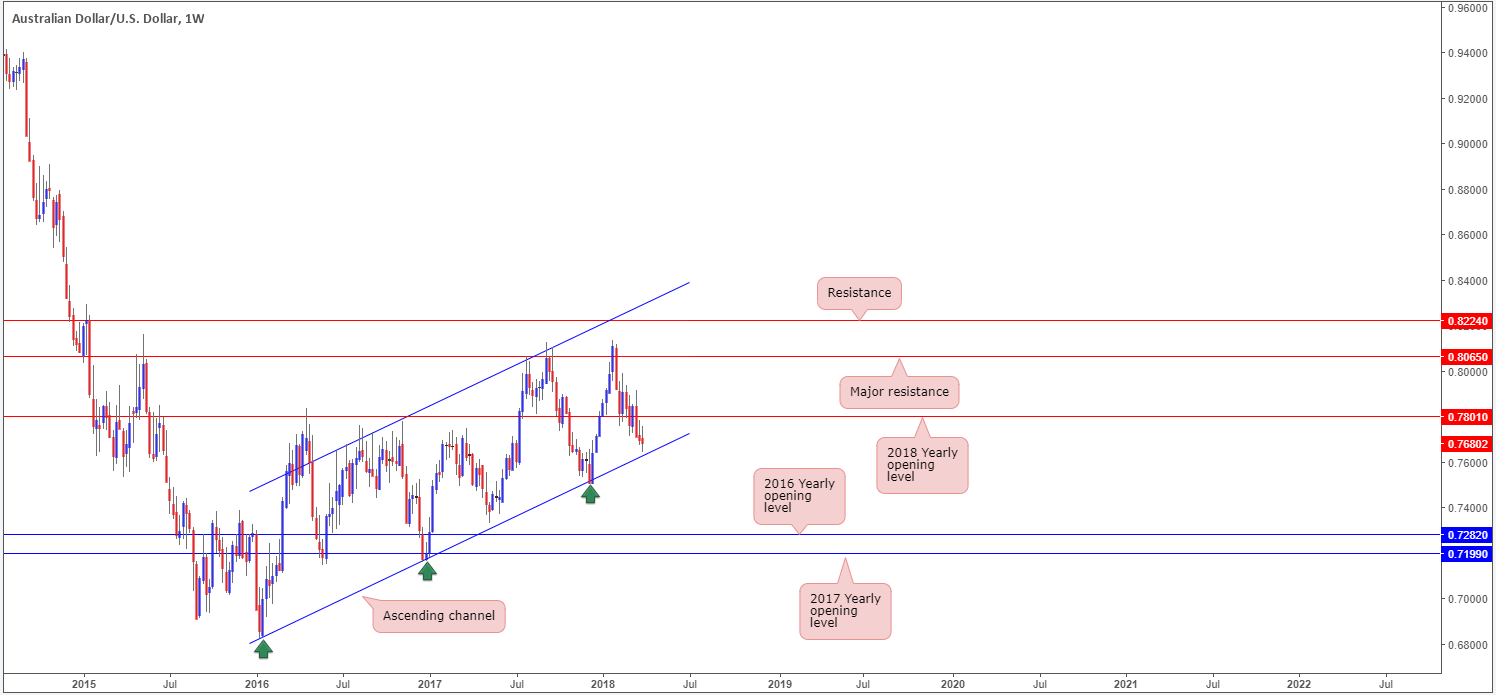
AUD/USD:
Weekly gain/loss: -0.25%
Weekly closing price: 0.7680
Over the last week, we witnessed the AUD/USD pair attempt to connect with a long-term weekly channel support taken from the low 0.6827. In the event a rotation to the upside is seen this week, traders may want to consider penciling in the 2018 yearly opening level (resistance) seen on the weekly timeframe at 0.7801.
Turning the focus over to the daily candles, the daily demand based at 0.7626-0.7665 (houses a 78.6% daily Fib support at 0.7638 and converges closely with the noted weekly channel support) firmly rejected price on Thursday last week, but, as you can see, failed to generate much follow-through on Easter Friday. The next upside objective from this angle can be seen in the form of a daily resistance level at 0.7732. A decisive move beyond the current daily demand, on the other hand, could set the wheels in motion for an approach to a daily Quasimodo support pegged at 0.7532, followed by a daily support seen at 0.7505.
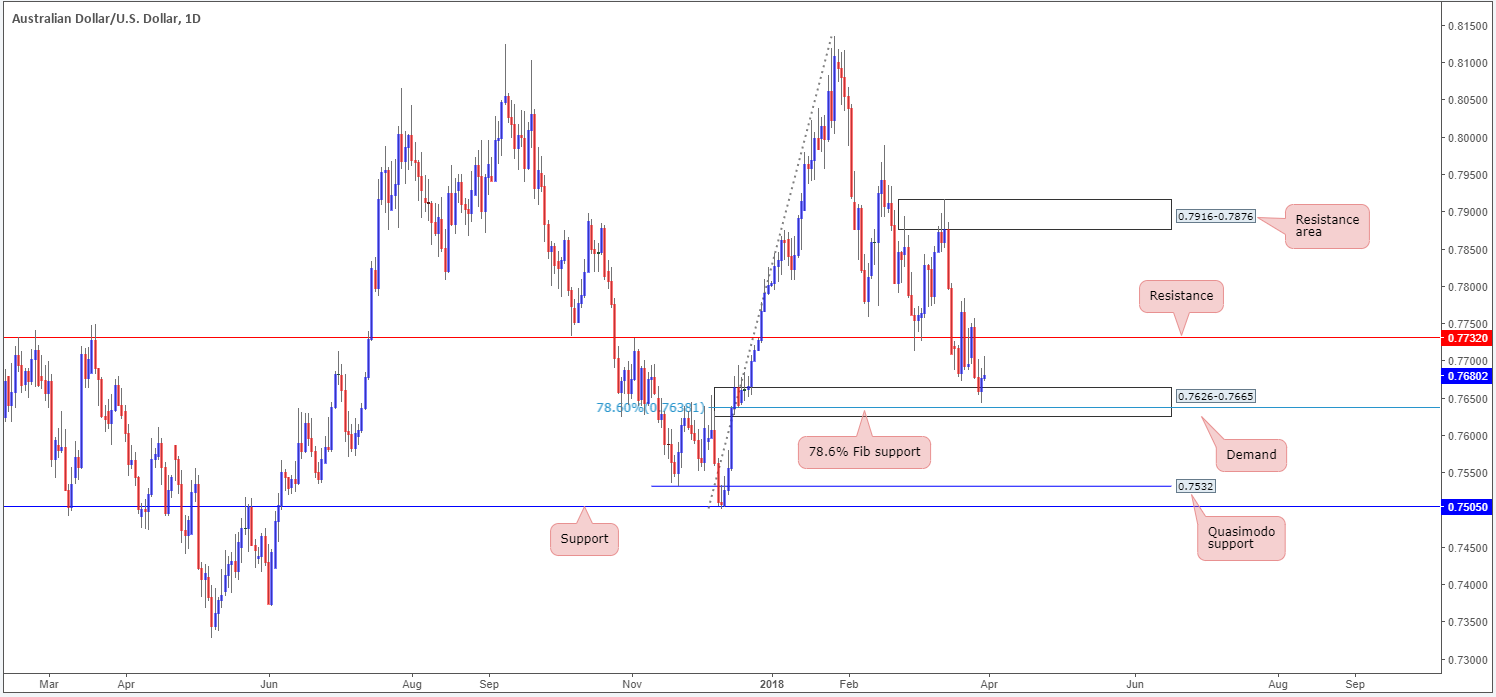
In view of the two charts pictures above, upside is favored despite Friday’s lackluster performance. The team, however, has noted that longs from the aforementioned 78.6% daily Fib support are preferable since this line is firmly located within the daily demand and also intersects beautifully with the said weekly channel support.
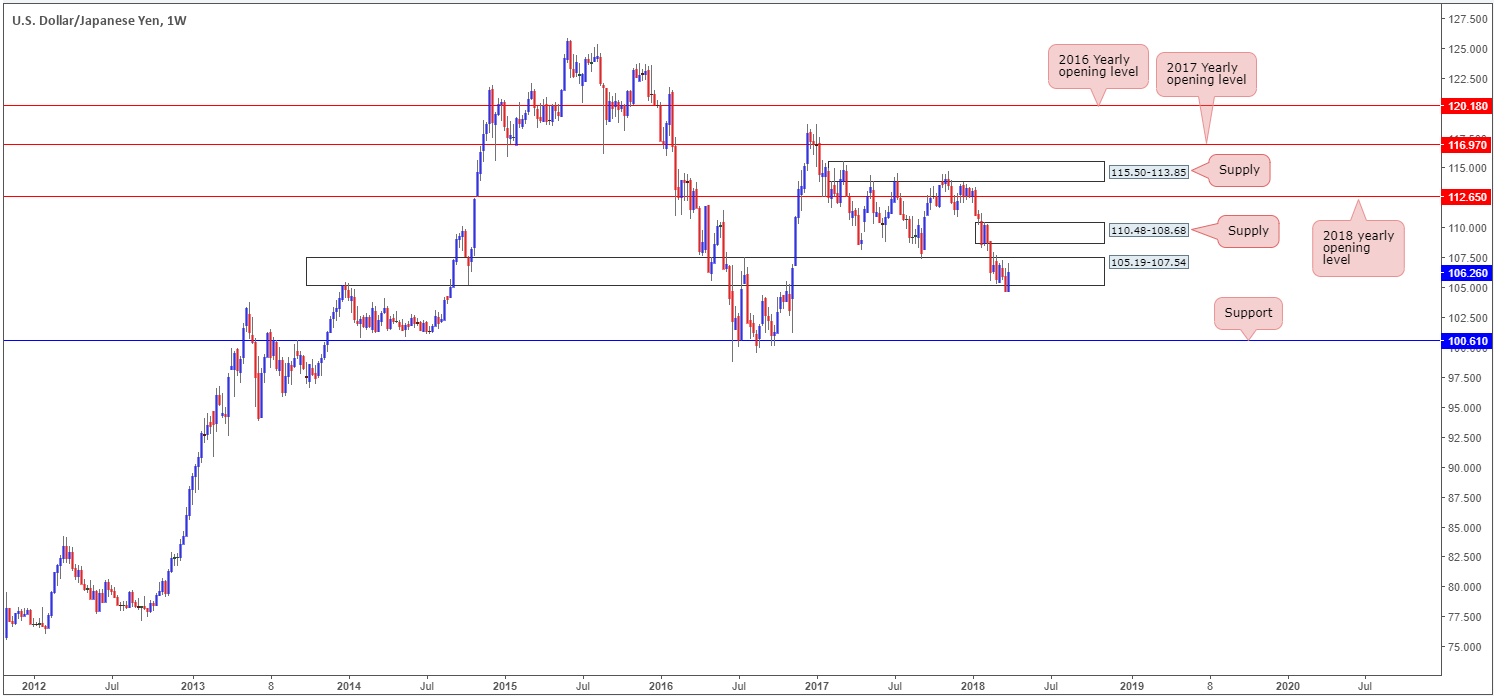
USD/JPY:
Weekly gain/loss: +1.47%
Weekly closing price: 106.26
Following a decisive close beneath 105.19-107.54 on the weekly timeframe, the USD/JPY rotated back to the upside last week in strong fashion. At this point in time, it is difficult to know what whether 105.19-107.54 is a support or resistance area!
Continued buying over the coming week could bring the unit up to a weekly supply base at 110.48-108.68, whereas a move lower may eventually place the pair within striking distance of a weekly support at 100.61.
As can be seen on the daily timeframe, the market pulled back from a high of 107.01 going into Thursday’s session last week and retested a recently broken daily channel resistance-turned support that intersects with a daily support area at 106.64-106.04. Should these areas hold ground this week, we could see price attempt to reach daily resistance coming in at 108.52, which happens to be located just beneath the aforementioned weekly supply zone.
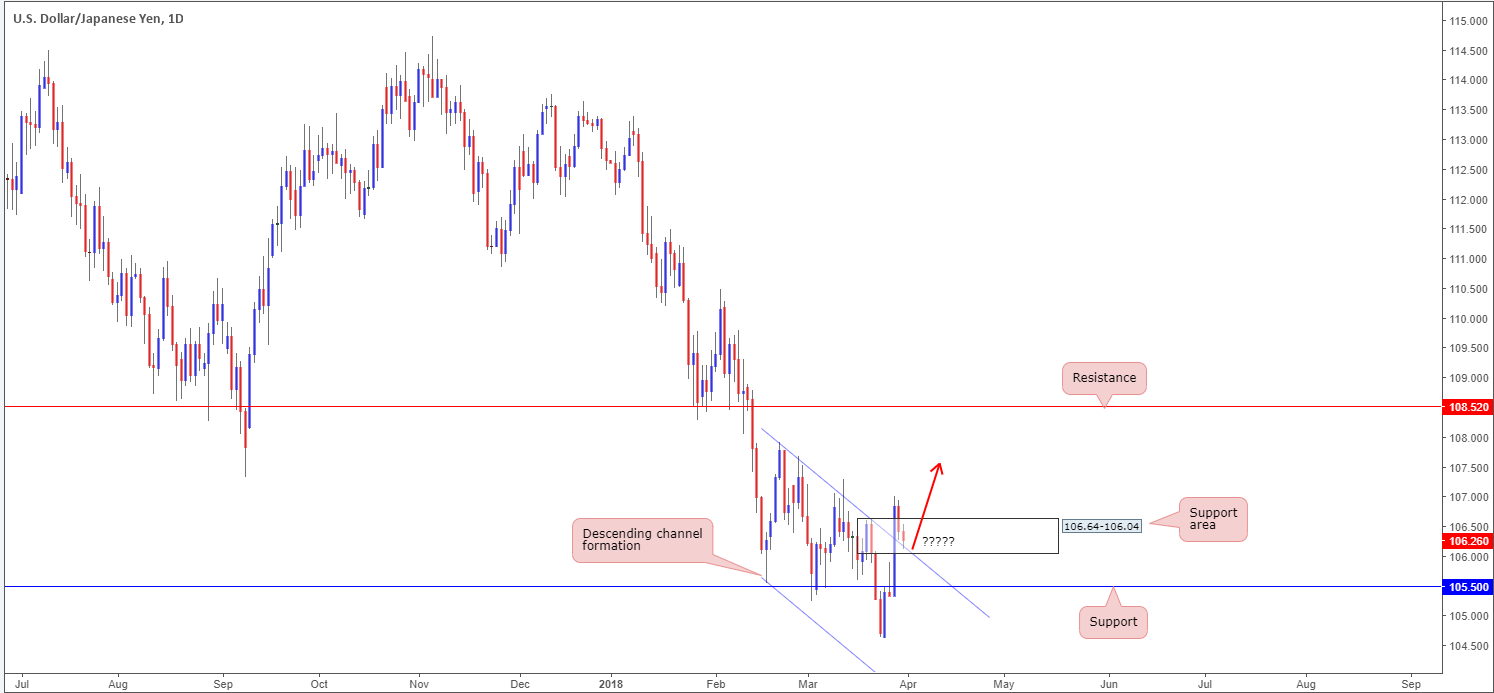
Given daily price is seen trading from support structure; upside could be the favored path this week, targeting the noted daily resistance level.
To be on the safe side, however, we would strongly recommend waiting for daily price to print a full or near-full-bodied bull candle before pulling the trigger. That way, at least you’ll know buyer intent is present!
USD/CAD:
Weekly gain/loss: +0.02%
Weekly closing price: 1.2895
In recent trade, weekly price hit the brakes and firmly turned lower after connecting with a weekly resistance area at 1.3006-1.3115. Last week’s action, however, was unable to generate much follow-through selling, despite downside on the weekly chart appearing reasonably free until we reach the 2018 yearly opening level at 1.2579.
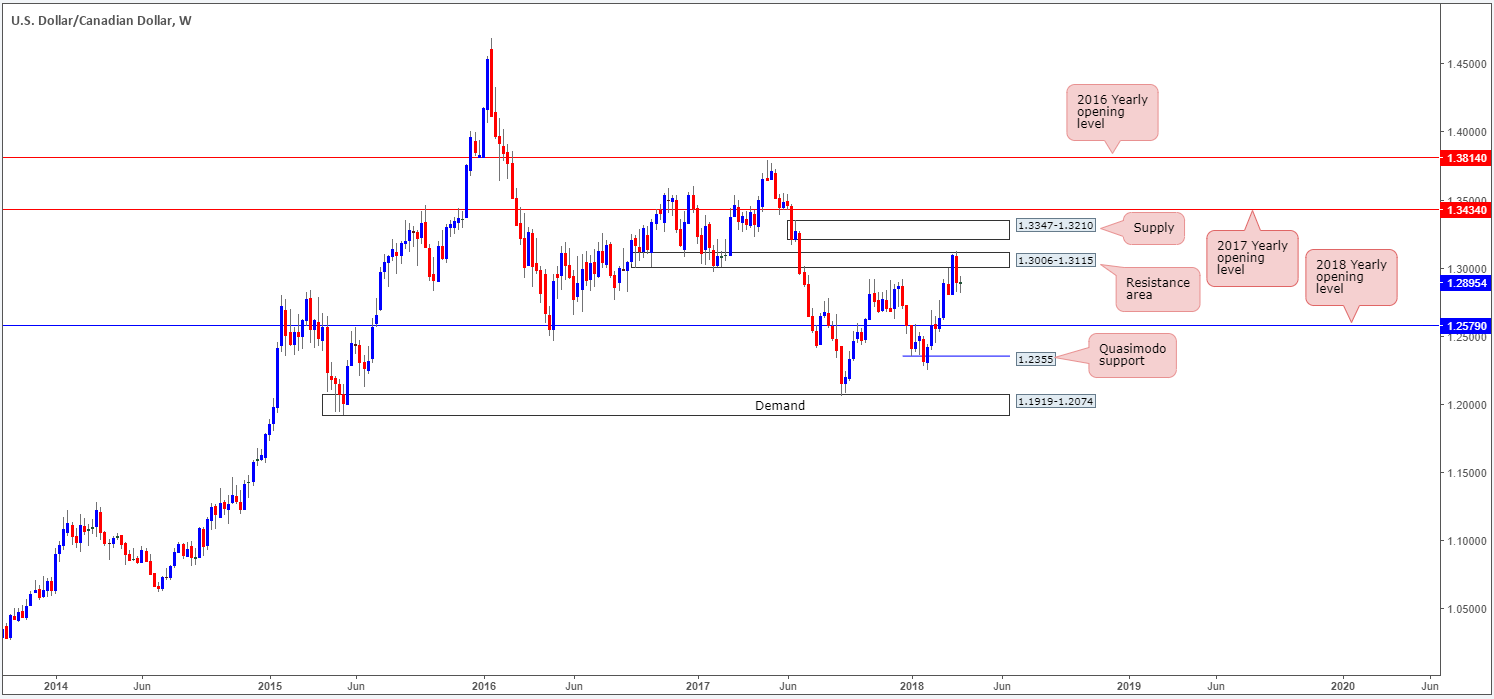
The reason downside seems to have hit a wall on the weekly timeframe can be seen on the daily scale. Note the strong-looking daily demand area located at 1.2803-1.2845. It would only be once we witness a strong break of this area will we likely see further downside on the weekly timeframe materialize. Before a break of the daily zone occurs, though, traders may want to prepare themselves for a potential retest of daily resistance seen at 1.3001.
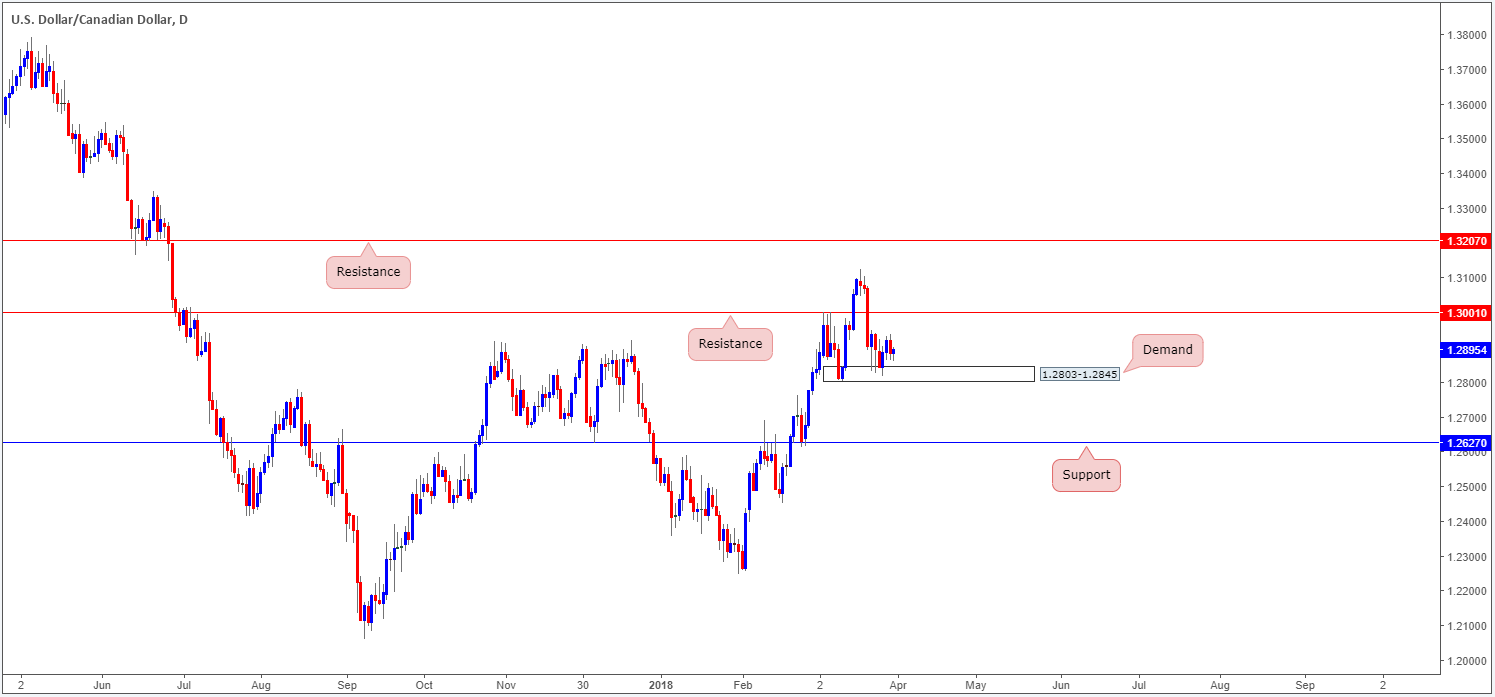
Potential for shorting opportunities exist around the daily resistance level mentioned above at 1.3001 this week.
An ideal setup, however, would be for daily price to penetrate the current daily demand base (tripping stop-loss orders), before pulling back and retesting the said daily resistance for a sell. This, as far as we can see, would firmly open the path south down to daily support at 1.2627 as an initial take-profit zone.
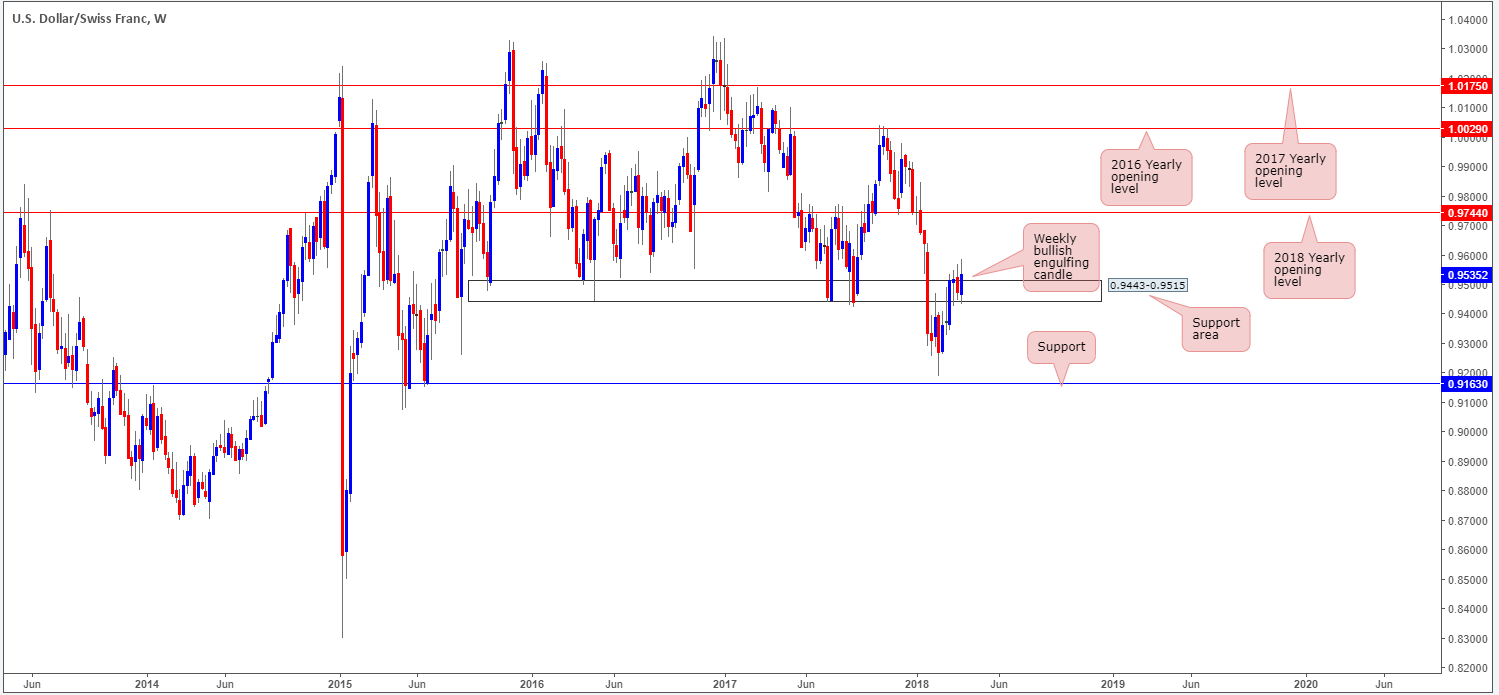
USD/CHF:
Weekly gain/loss: +0.72%
Weekly closing price: 0.9535
During the course of last week’s trading, the USD/CHF established a base of support off of a weekly area marked at 0.9443-0.9515. Also forming a strong-looking weekly bullish engulfing candle, this could encourage further buying in this market over the coming weeks and eventually lift things up to the 2018 yearly opening level positioned on the weekly timeframe at 0.9744.
Although weekly price reflects a rather strong bullish tone, the picture currently painted on the daily timeframe echoes a slightly different environment. Directly above current price, we can see a solid daily supply base coming in at 0.9666-0.9589, which is sited just south of an interesting daily resistance level at 0.9714.
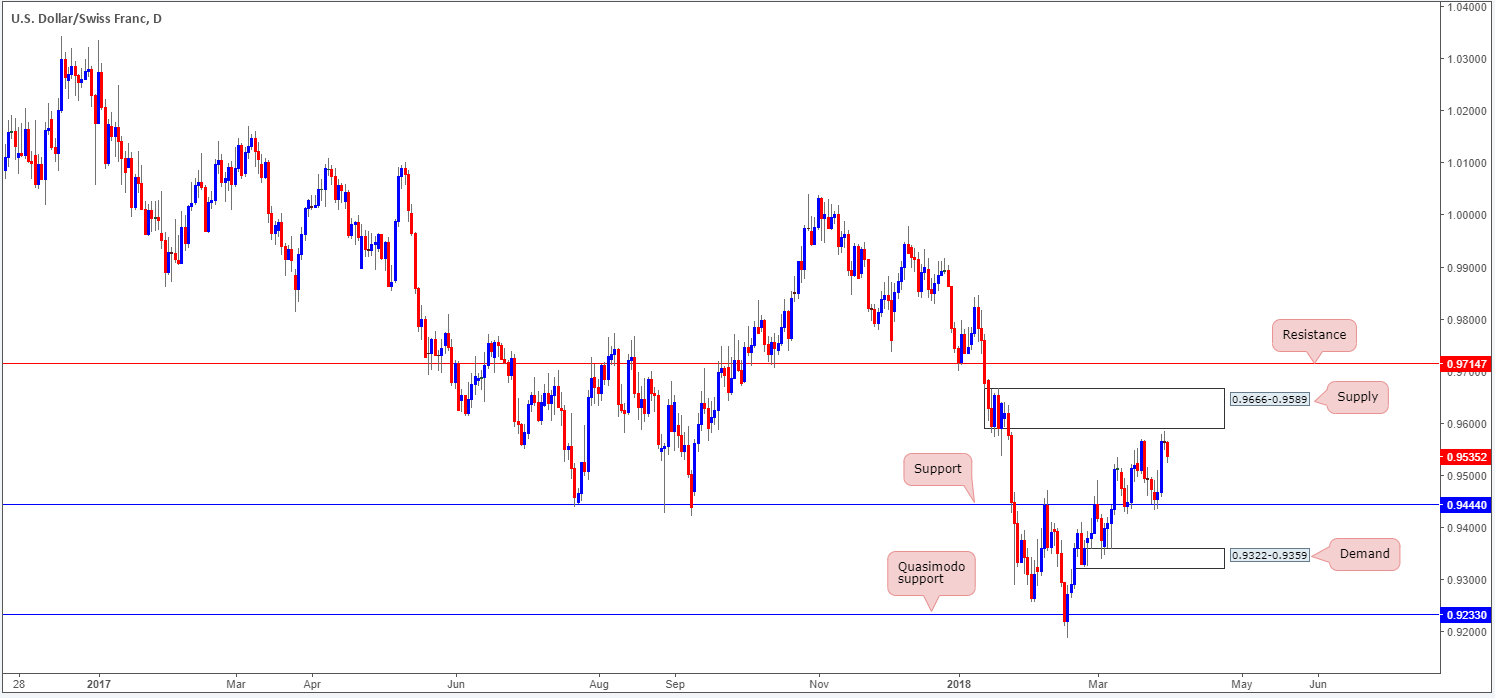
Weekly traders looking to buy the recently formed weekly bullish engulfing candle may want to hold fire! Entering long into a substantial daily supply zone is not a trade we would label high probability, no matter what the weekly timeframe is indicating!
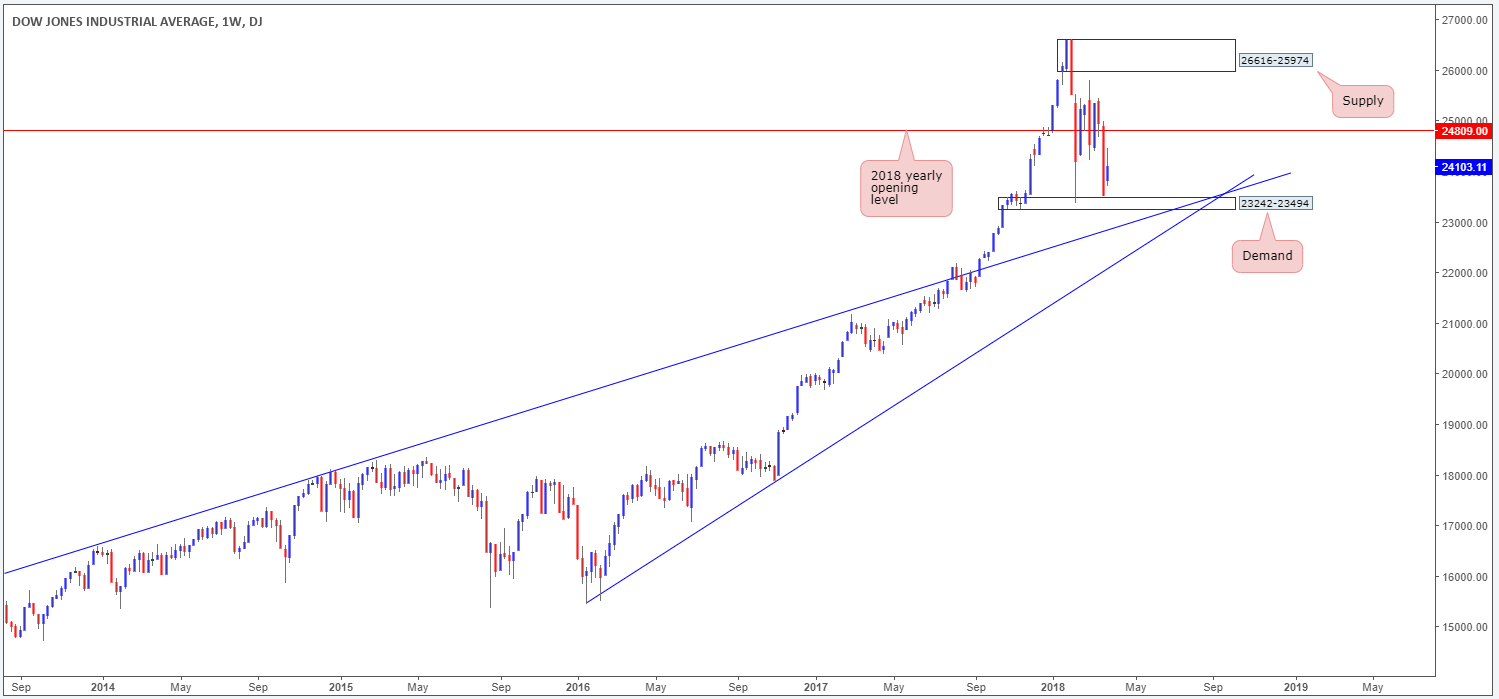
DOW 30:
Weekly gain/loss: +2.42%
Weekly closing price: 24103
A few weeks back, US indexes nose-dived lower as US-China trade war escalated. In total, the DJIA erased over 1400 points, marking it as the worst week since January 2016. As you can see, this brought the index down to just north of a small weekly demand area at 23242-23494, which saw price attempt to reclaim lost ground last week, reaching highs of 24446.
Lower on the curve, daily price is seen consolidating just ahead of the Feb 9 low 23360, which, as you can see, is shadowed closely by a 161.8% daily Fib ext. point at 23256. Given that both values are encapsulated within the walls of the aforementioned weekly demand base, a bounce higher from here could be take place.
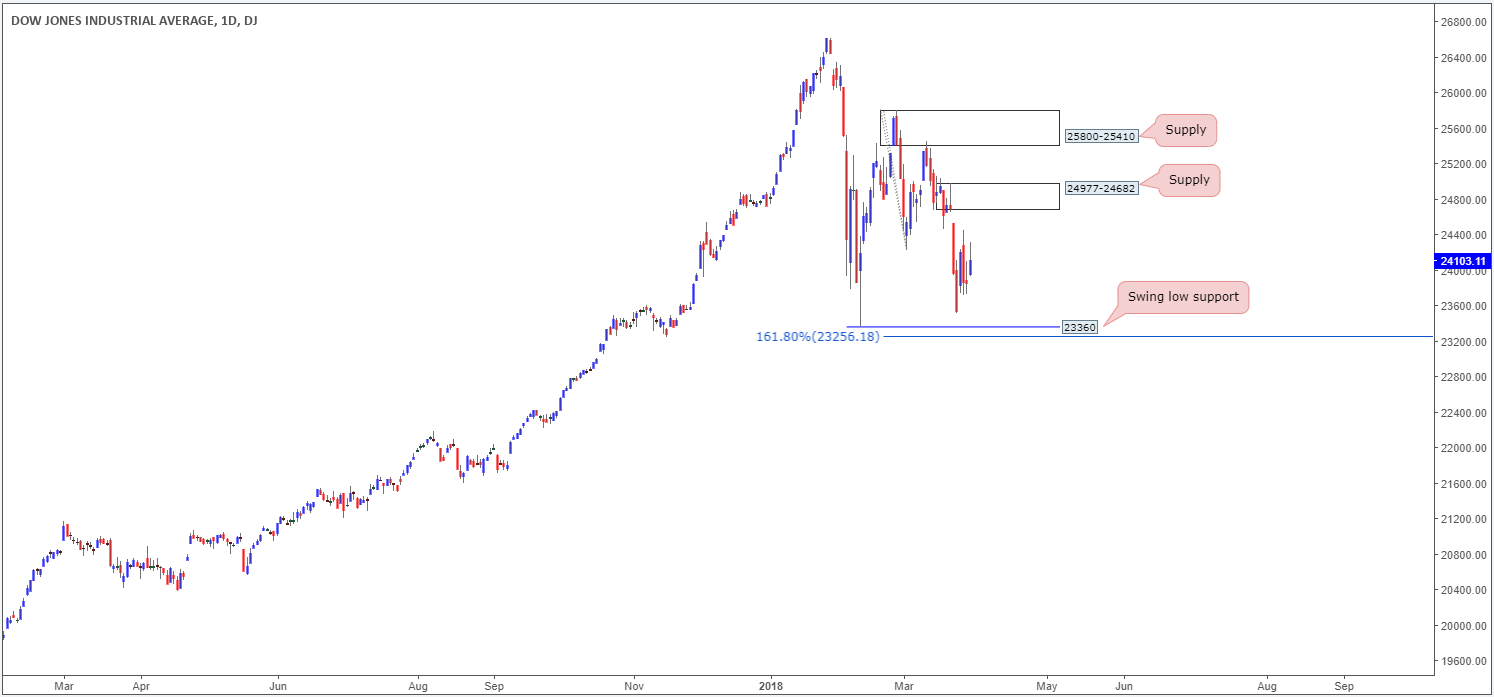
Although weekly price bounced north last week, the team has noted to keep an eyeball on the daily support levels mentioned above for longs. Stop-loss orders can be tucked beneath the said weekly demand area.
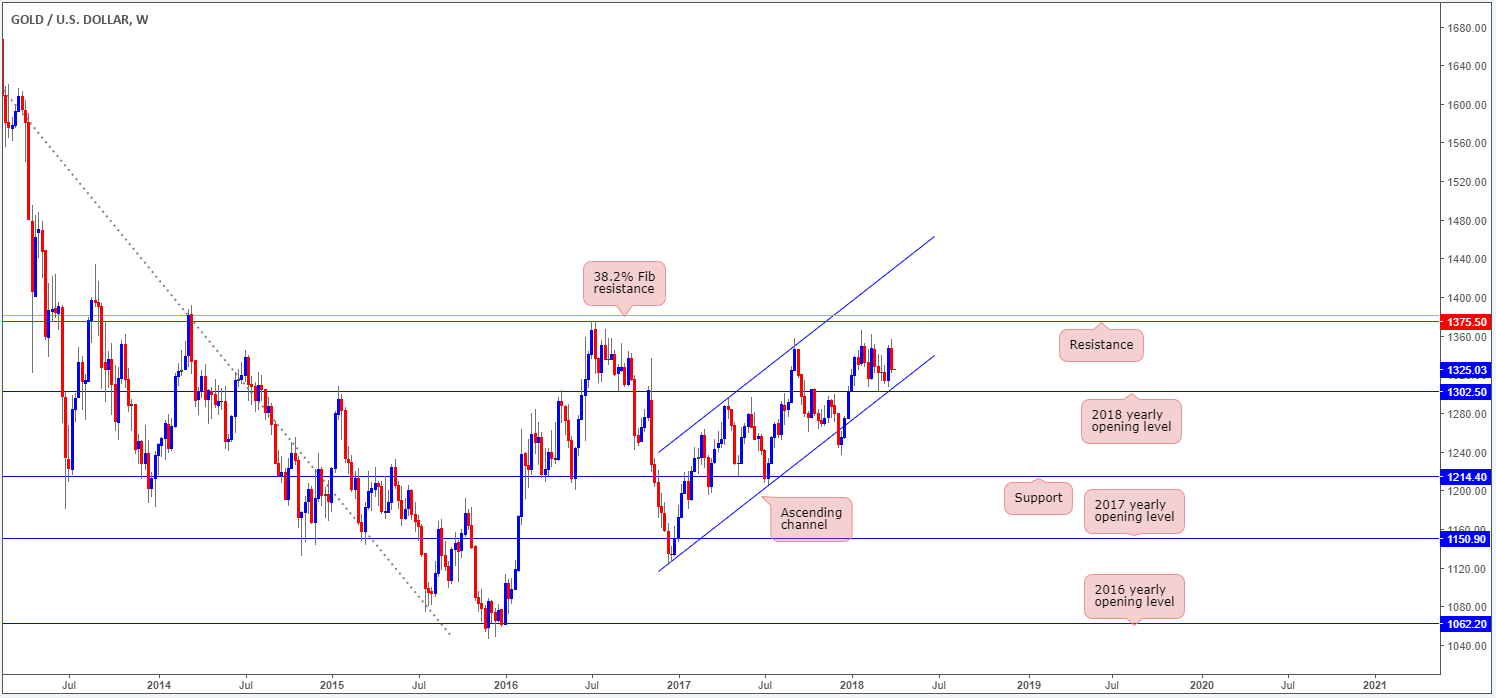
GOLD:
Weekly gain/loss: -1.63%
Weekly closing price: 1325.0
As the US dollar made a rather strong comeback last week, it shouldn’t have come as too much of a surprise to see that bullion came under pressure. Reclaiming nearly 70% of the prior week’s gains, gold’s weekly chart shows price may attempt an approach on the 2018 yearly opening level at 1302.5 (fuses closely with a long-term weekly channel support etched from the low 1122.8) in the coming week.
A little lower on the curve, we can see that the daily bearish harmonic Gartley pattern that terminates (78.6% Fib retracement) around 1349.6 (and is closely positioned to a daily channel resistance extended from the high 1366.0) was respected beautifully last week. Should further selling come about, the next port of call beneath here can be seen in the form of a daily support level plotted at 1308.4.
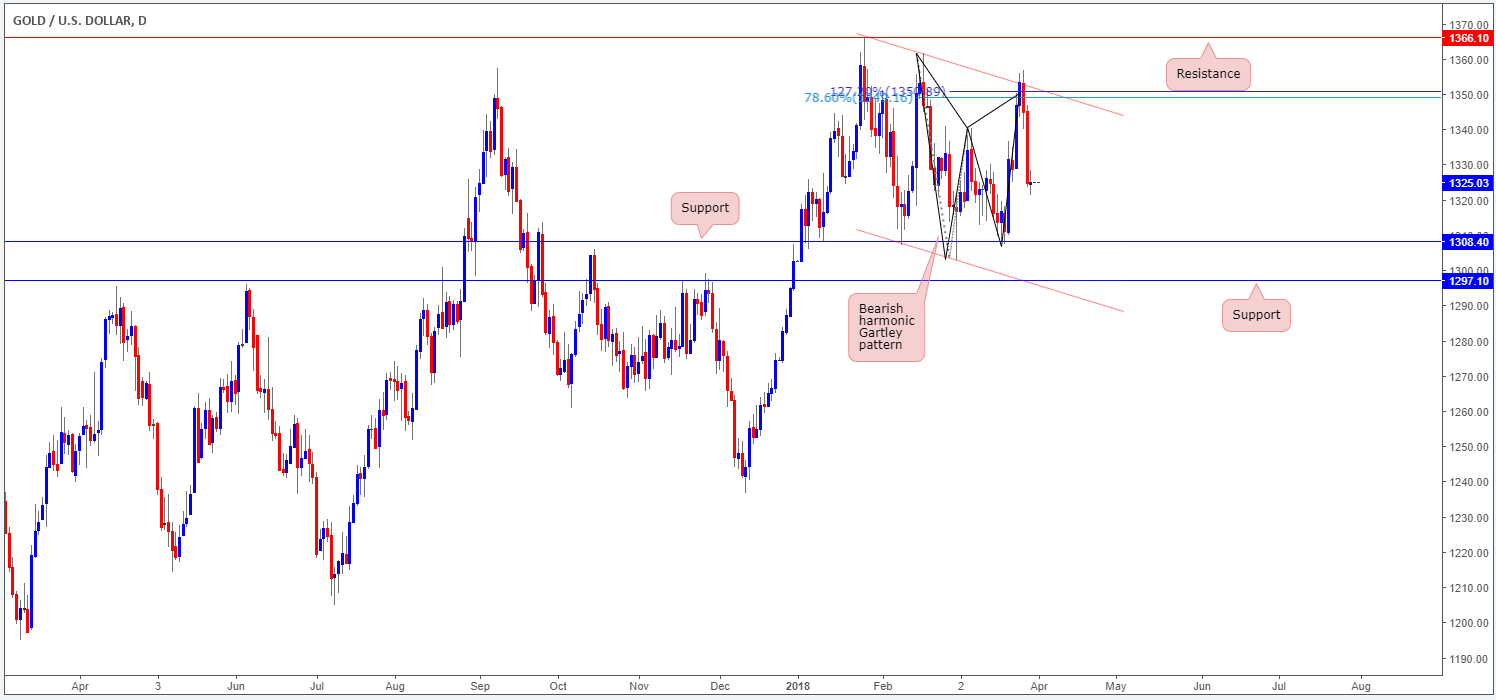
In light of recent movement, further downside could be on the cards this week, at least until we reach the daily support level mentioned above at 1308.4. As a result, looking for shorting opportunities on the lower timeframes could very well be an option.
This site has been designed for informational and educational purposes only and does not constitute an offer to sell nor a solicitation of an offer to buy any products which may be referenced upon the site. The services and information provided through this site are for personal, non-commercial, educational use and display. IC Markets does not provide personal trading advice through this site and does not represent that the products or services discussed are suitable for any trader. Traders are advised not to rely on any information contained in the site in the process of making a fully informed decision.
This site may include market analysis. All ideas, opinions, and/or forecasts, expressed or implied herein, information, charts or examples contained in the lessons, are for informational and educational purposes only and should not be construed as a recommendation to invest, trade, and/or speculate in the markets. Any trades, and/or speculations made in light of the ideas, opinions, and/or forecasts, expressed or implied herein, are committed at your own risk, financial or otherwise.
The use of the site is agreement that the site is for informational and educational purposes only and does not constitute advice in any form in the furtherance of any trade or trading decisions.
The accuracy, completeness and timeliness of the information contained on this site cannot be guaranteed. IC Markets does not warranty, guarantee or make any representations, or assume any liability with regard to financial results based on the use of the information in the site.
News, views, opinions, recommendations and other information obtained from sources outside of www.icmarkets.com.au, used in this site are believed to be reliable, but we cannot guarantee their accuracy or completeness. All such information is subject to change at any time without notice. IC Markets assumes no responsibility for the content of any linked site. The fact that such links may exist does not indicate approval or endorsement of any material contained on any linked site.
IC Markets is not liable for any harm caused by the transmission, through accessing the services or information on this site, of a computer virus, or other computer code or programming device that might be used to access, delete, damage, disable, disrupt or otherwise impede in any manner, the operation of the site or of any user’s software, hardware, data or property.


