
DXY:
The XAU/USD chart currently exhibits bearish momentum, indicating the potential for further downward movement.
In the short term, there is a possibility of a bearish reaction off the first resistance level at 105.65, which is identified as an overlap resistance. This level could act as a price ceiling and trigger a drop towards the first support.
The first support level at 103.43 is recognized as a pullback support, suggesting it could provide a price floor and support any potential declines.
Additionally, there is a second support level at 100.80, identified as a multi-swing low support, further reinforcing its significance as a potential price floor.
On the resistance side, the second resistance level at 107.87 is an overlap resistance, indicating its importance as a potential barrier for the price’s upward movement.
Furthermore, there is an intermediate resistance level at 104.63, recognized as a pullback resistance and coinciding with a 78.60% Fibonacci extension. This level could pose additional obstacles for the price if it attempts to rise.
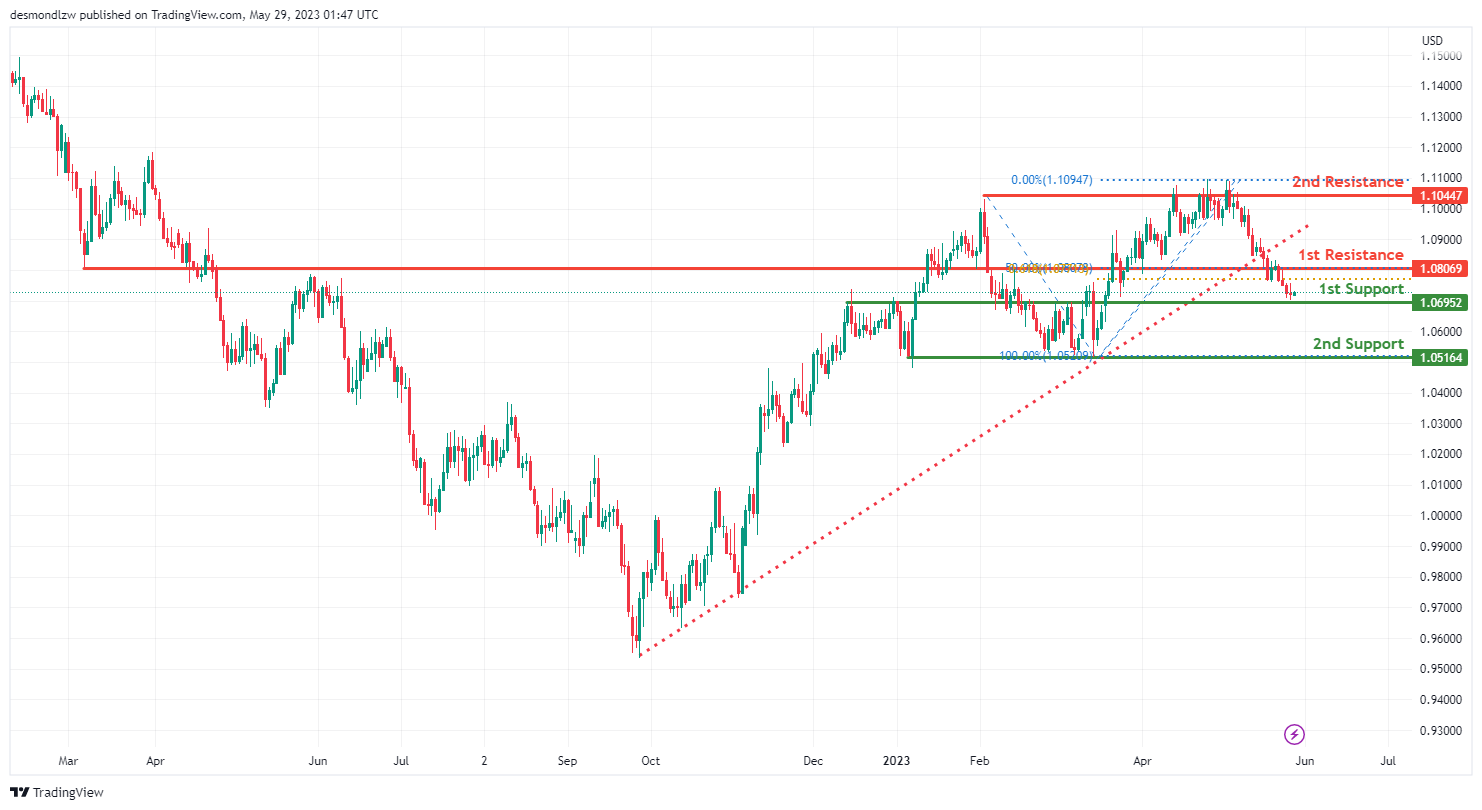
EUR/USD:
The EUR/USD chart currently exhibits bearish momentum, suggesting the potential for further downward movement.
In the short term, there is a possibility of a rise towards the first resistance level at 1.0806. However, it is anticipated that the price may reverse off this level and drop towards the first support.
The first support level at 1.0695 is identified as an overlap support, indicating its significance as a potential price floor.
Additionally, there is a second support level at 1.0516, recognized as a multi-swing low support, further reinforcing its importance as a potential price floor.
On the resistance side, the first resistance level at 1.0806 is an overlap resistance. It also coincides with a 61.80% Fibonacci projection and a 50% Fibonacci retracement, which adds to its significance as a potential price ceiling. This combination of Fibonacci levels is referred to as Fibonacci confluence.
Furthermore, there is a second resistance level at 1.1044, identified as a swing high resistance. This level could pose additional obstacles for the price’s upward movement.
Moreover, there is an intermediate resistance level at 1.0463, recognized as a pullback resistance.This level could potentially act as a stronger barrier for the price if it attempts to rise.
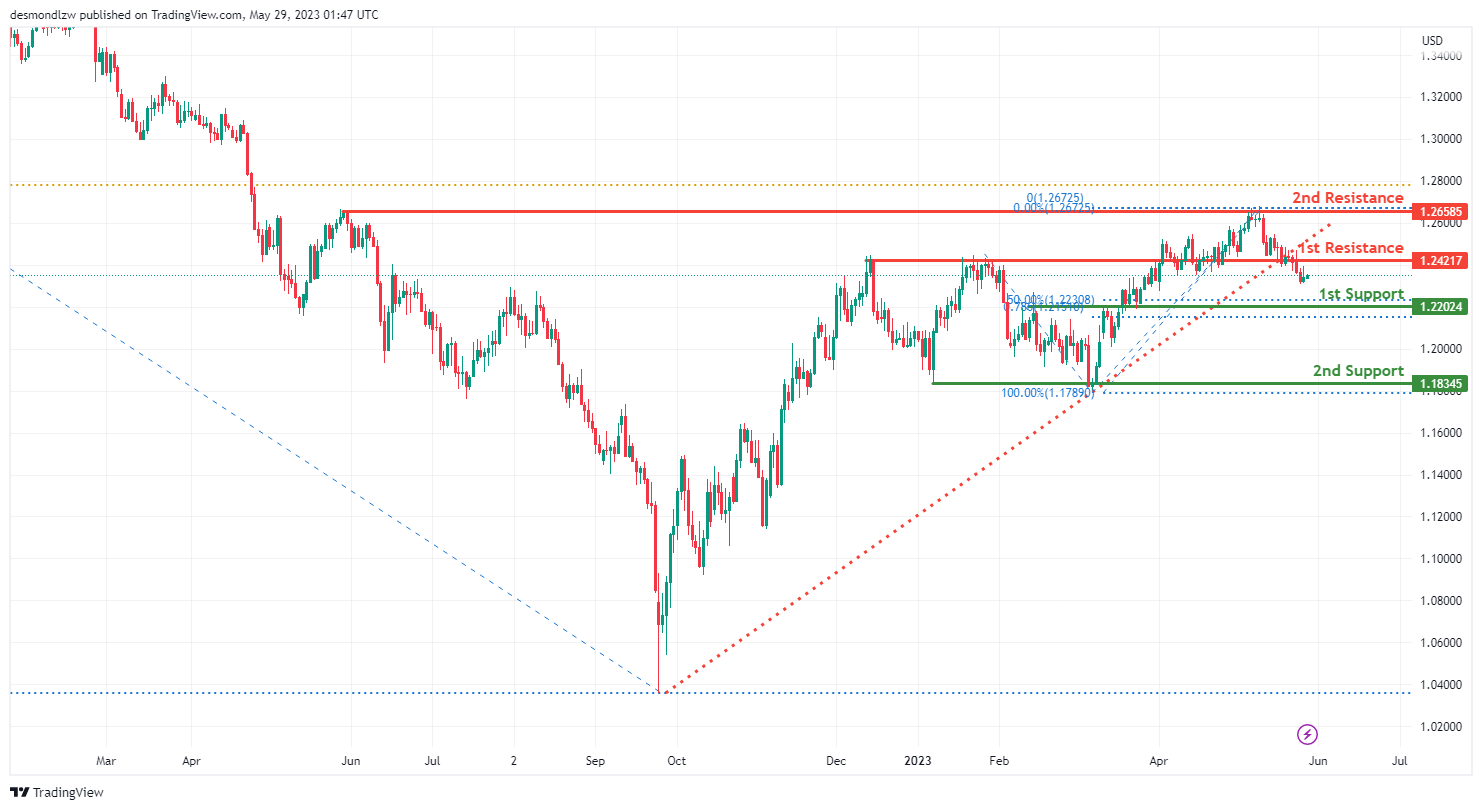
GBP/USD:
The GBP/USD chart currently exhibits bearish momentum, indicating the potential for further downward movement.
As the price broke below an ascending support line, it triggered a potential bearish move.
There is a possibility of a bearish continuation towards the first support level at 1.2202.
The first support level at 1.2202 is significant as it is an overlap support and coincides with a 50% Fibonacci retracement and a 78.60% Fibonacci projection. This combination of Fibonacci levels is referred to as Fibonacci confluence, adding to its importance as a potential price floor.
Additionally, there is a second support level at 1.1834, recognized as a multi-swing low support, further reinforcing its significance as a potential price floor.
On the resistance side, the first resistance level at 1.2421 is identified as a pullback resistance.
Furthermore, there is a second resistance level at 1.2658, identified as a multi-swing high resistance.
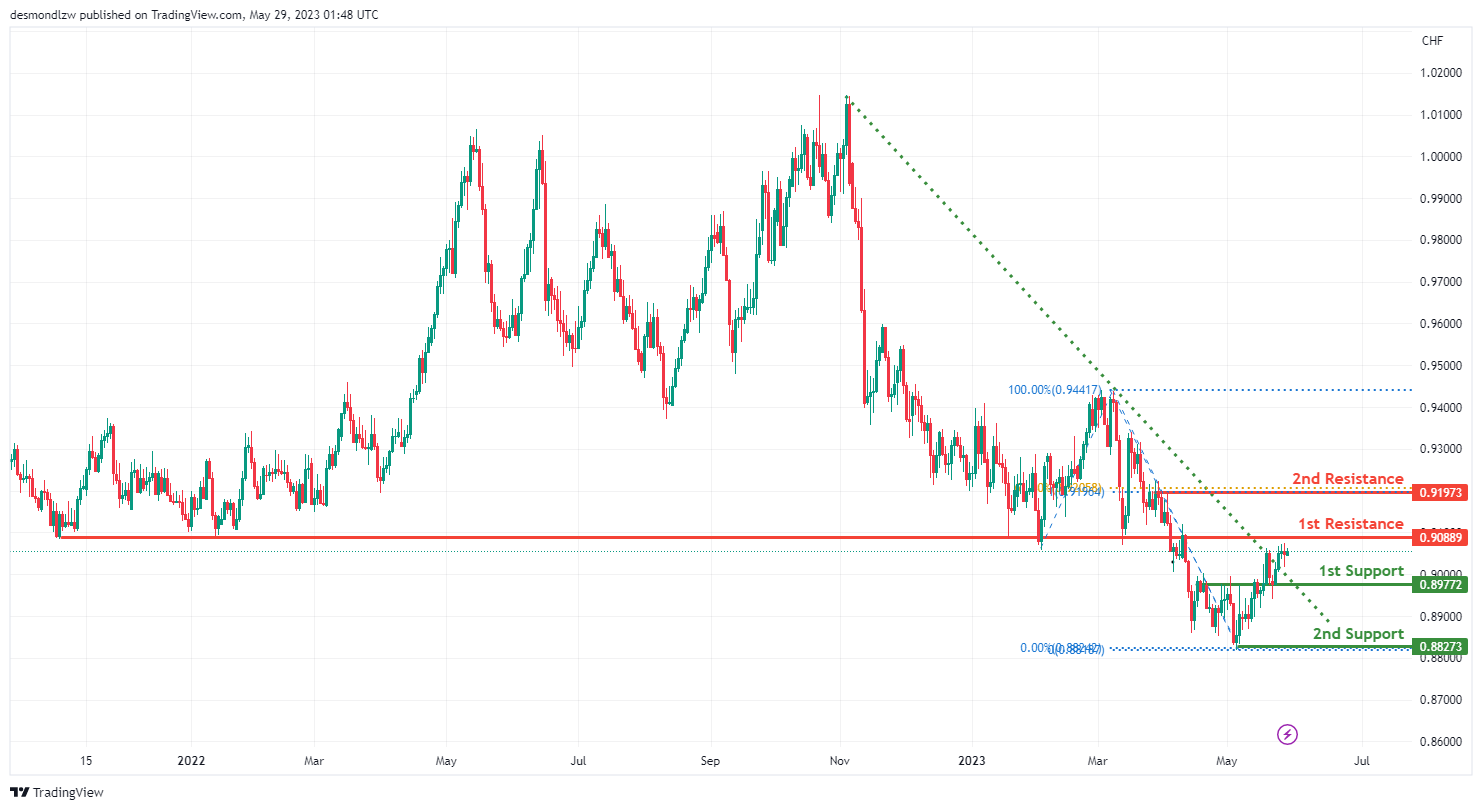
USD/CHF:
The USD/CHF chart currently exhibits bullish momentum, indicating the potential for further upward movement.
This bullish momentum is supported by the fact that the price broke above a descending resistance line, triggering a potential bullish move.
There is a possibility of a bullish continuation towards the first resistance level at 0.9088.
The first support level at 0.8977 is identified as an overlap support, suggesting it could act as a price floor during potential pullbacks.
Additionally, there is a second support level at 0.8827, recognized as a swing low support, further contributing to the overall bullish bias.
On the resistance side, the first resistance level at 0.9088 is an overlap resistance level.
Furthermore, there is a second resistance level at 0.9197, identified as a multi-swing high resistance. This level coincides with a 61.80% Fibonacci retracement and a 100% Fibonacci projection, adding to its significance as a potential price barrier.
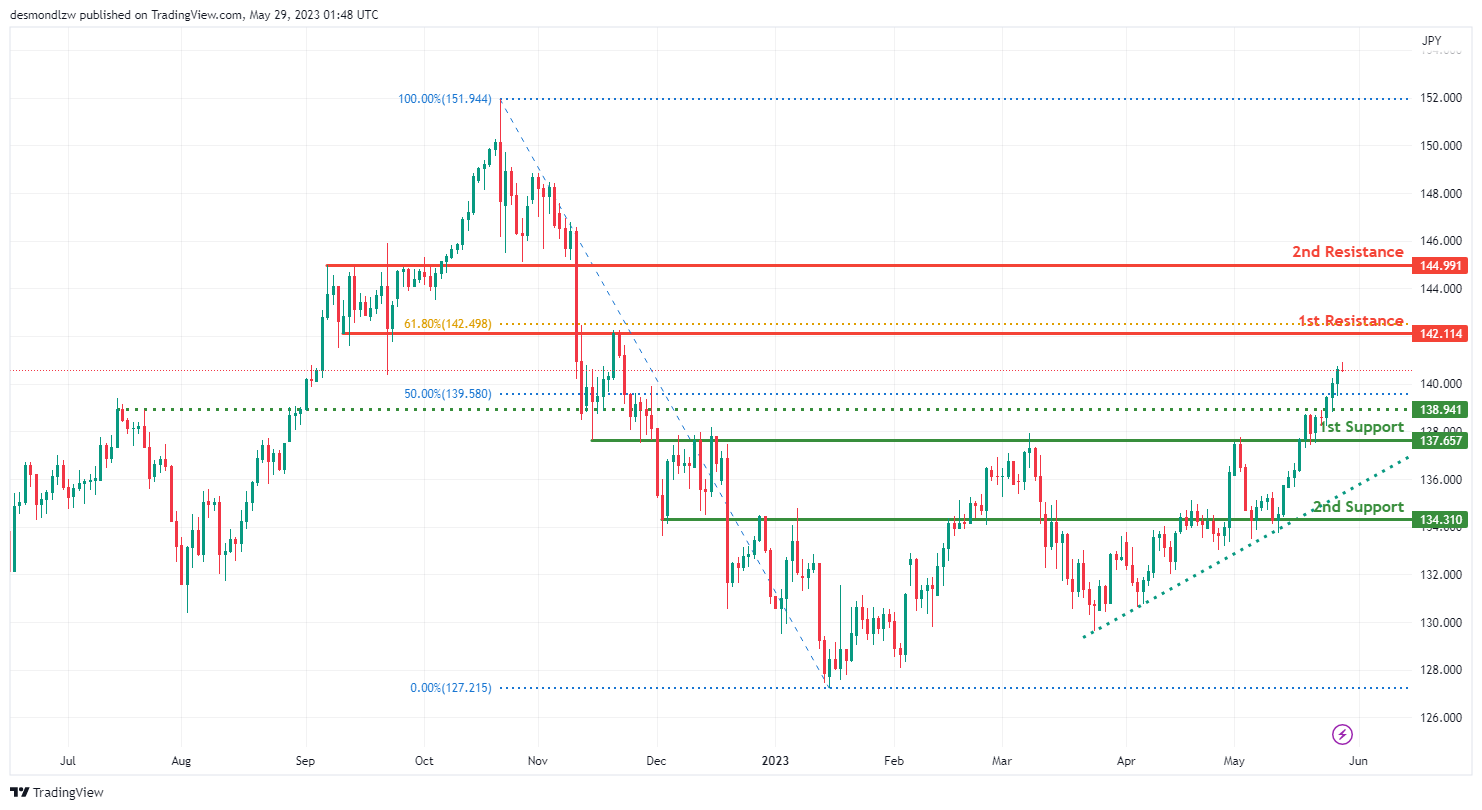
USD/JPY:
The USD/JPY chart currently demonstrates bullish momentum, suggesting the potential for further upward movement.
This bullish momentum is supported by the fact that the price is positioned above a major ascending trend line, indicating a favorable outlook for continued bullish momentum.
There is a possibility of a bullish continuation towards the first resistance level at 142.11.
On the support side, the first support level at 137.65 is identified as an overlap support, indicating its potential significance as a price floor.
Additionally, there is a second support level at 134.31, recognized as an overlap support, further supporting the overall bullish sentiment.
On the resistance side, the first resistance level at 142.11 is an overlap resistance level. If the price continues to rise, it may encounter resistance at this level.
Furthermore, there is a second resistance level at 144.99, identified as a pullback resistance.
For potential pullbacks, traders may find support at the intermediate support level of 138.94, which aligns with a 50% Fibonacci retracement.
AUD/USD:
The AUD/USD chart currently exhibits bullish momentum, suggesting the potential for further upward movement.
There is a possibility of a bullish continuation towards the first resistance level at 0.6652.
On the support side, the first support level at 0.6496 is identified as a pullback support, indicating its potential as a price floor during pullbacks.
Additionally, there is a second support level at 0.6386, recognized as a swing low support, which further contributes to the overall bullish sentiment. This level also aligns with a 78.60% Fibonacci retracement, adding to its significance.
On the resistance side, the first resistance level at 0.6652 is a pullback resistance level. If the price continues to rise, it may encounter resistance at this level.
Furthermore, there is a second resistance level at 0.6790, identified as a multi-swing high resistance.
For potential pullbacks, traders may find support at the intermediate resistance level of 0.6548, which aligns with a 23.60% Fibonacci retracement.
NZD/USD
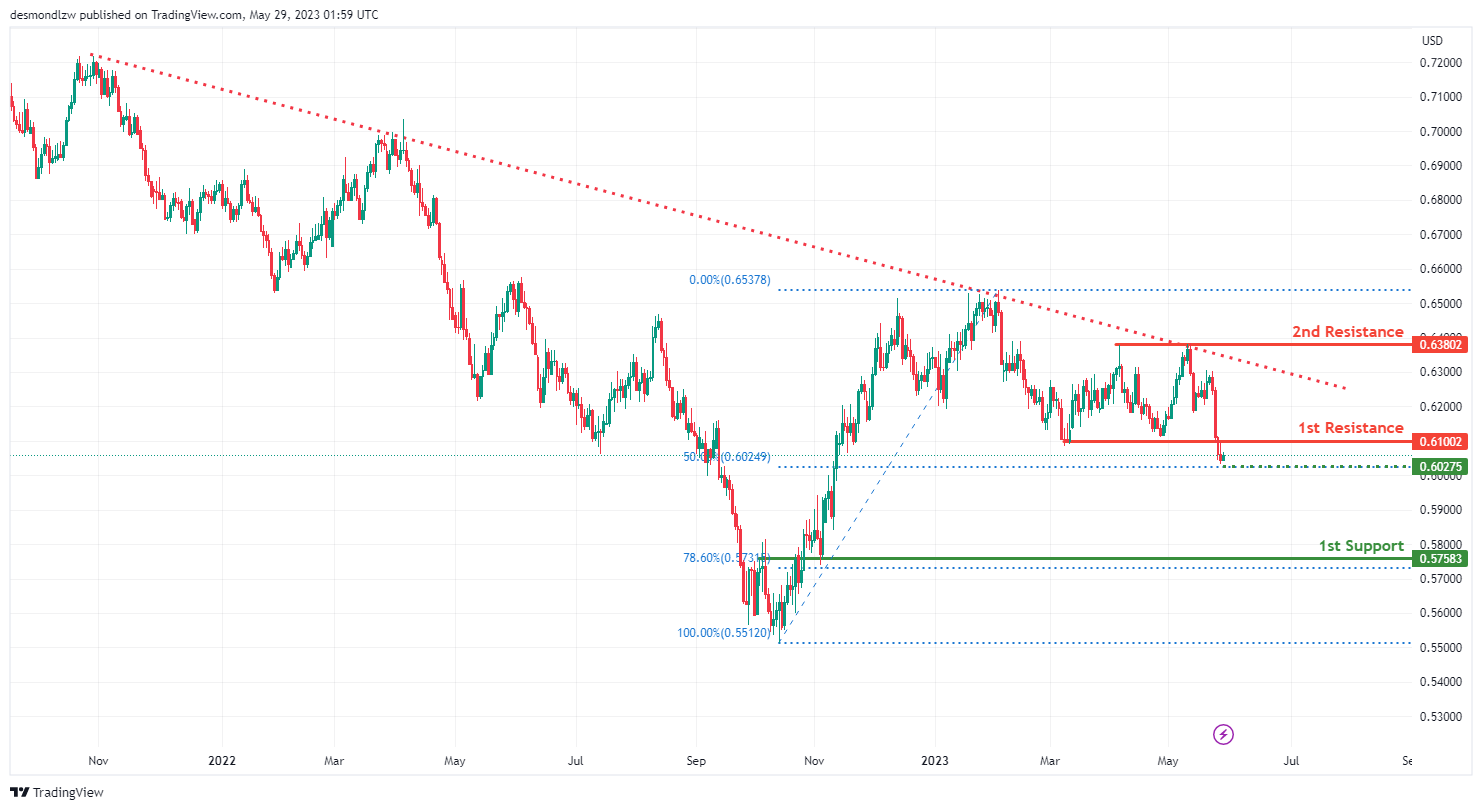
The NZD/USD chart currently demonstrates bearish momentum, indicating the potential for further downward movement.
There is a possibility of a bearish continuation towards the first support level at 0.5758. This level is identified as an overlap support and coincides with a 78.60% Fibonacci retracement, suggesting its significance as a potential price floor.
An intermediate support level can be found at 0.6027, which represents a swing low support and aligns with a 50% Fibonacci retracement.
On the resistance side, the first resistance level at 0.6100 is recognized as a pullback resistance. If the price were to rally, it may encounter resistance at this level.
Additionally, there is a second resistance level at 0.6380, identified as a multi-swing high resistance.
USD/CAD:
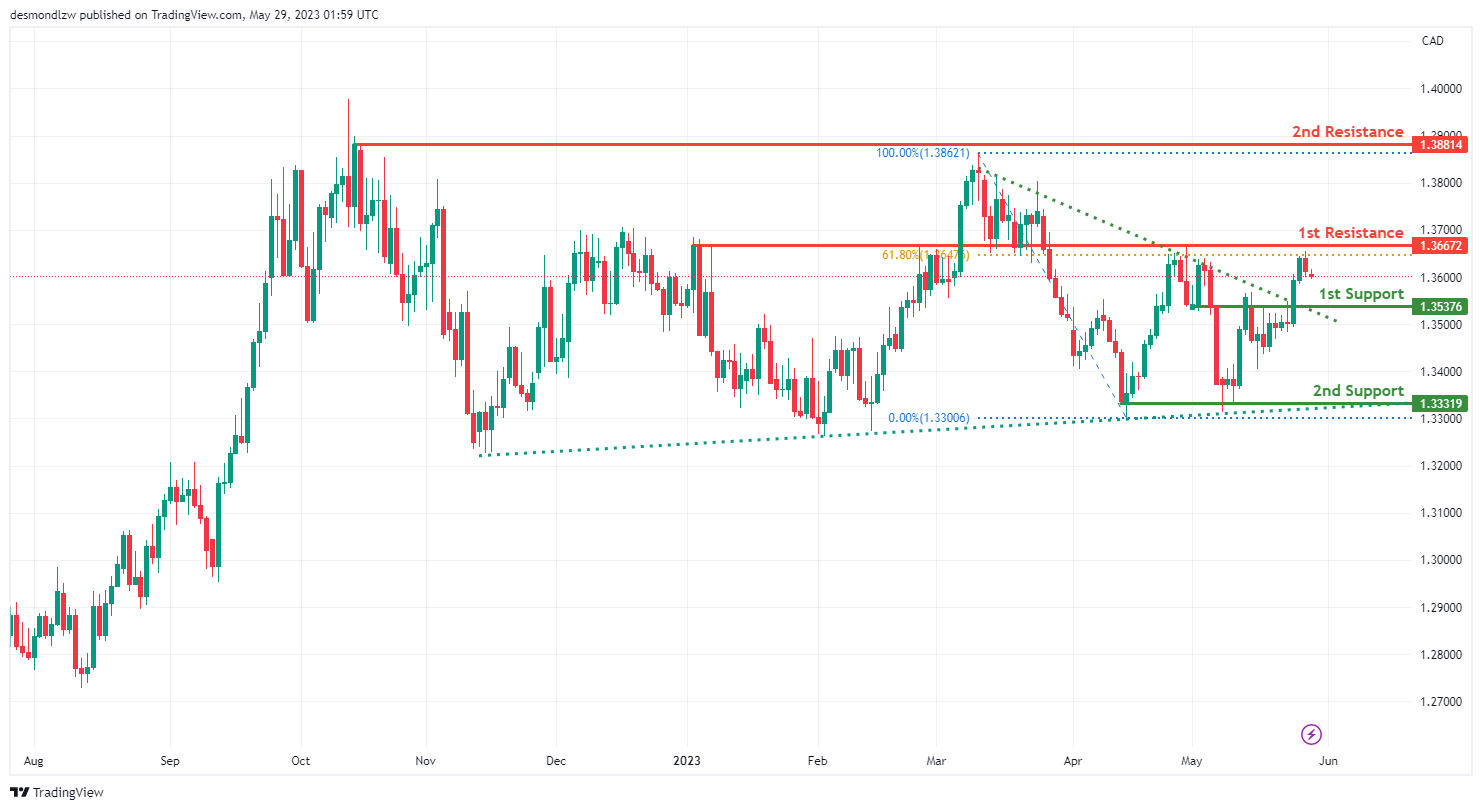
The USD/CAD chart currently exhibits bullish momentum, indicating the potential for further upward movement.
Although the price has broken above a descending resistance line, there is a possibility of a short-term drop towards the first support level at 1.3537 before bouncing back and rising towards the first resistance.
The first support level at 1.3537 is identified as an overlap support, suggesting its significance as a potential price floor. Additionally, there is a second support level at 1.3331, recognized as a multi-swing low support.
On the resistance side, the first resistance level at 1.3667 is an overlap resistance level. Further upward movement could encounter resistance at this level. Additionally, there is a second resistance level at 1.3881, which represents a multi-swing high resistance.
DJ30:
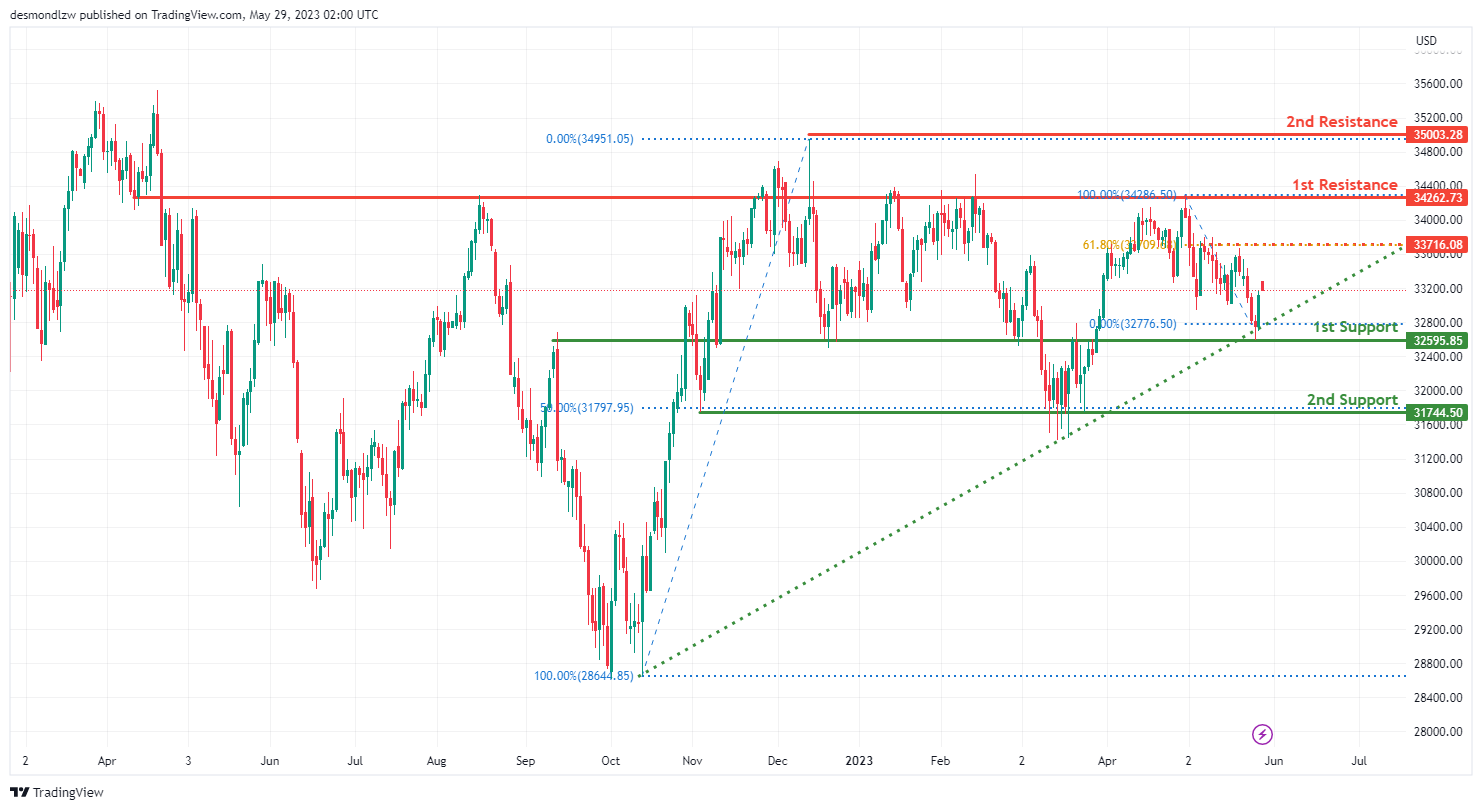
The DJ30 (Dow Jones Industrial Average) chart currently exhibits bullish momentum, suggesting the potential for further upward movement.
The price is positioned above a major ascending trend line, indicating a bullish bias in the market. This trend line serves as a contributing factor to the bullish momentum.
There is a possibility of a bullish continuation towards the first resistance level at 34262.73. This level is identified as an overlap resistance, which could pose a challenge for further upward movement. Additionally, there is a second resistance level at 35003.28, representing a swing high resistance.
On the support side, the first support level at 32595.85 is recognized as an overlap support. This level may provide a price floor during potential pullbacks. Additionally, there is a second support level at 31744.50, which is a multi-swing low support and coincides with a 50% Fibonacci retracement.
GER30:
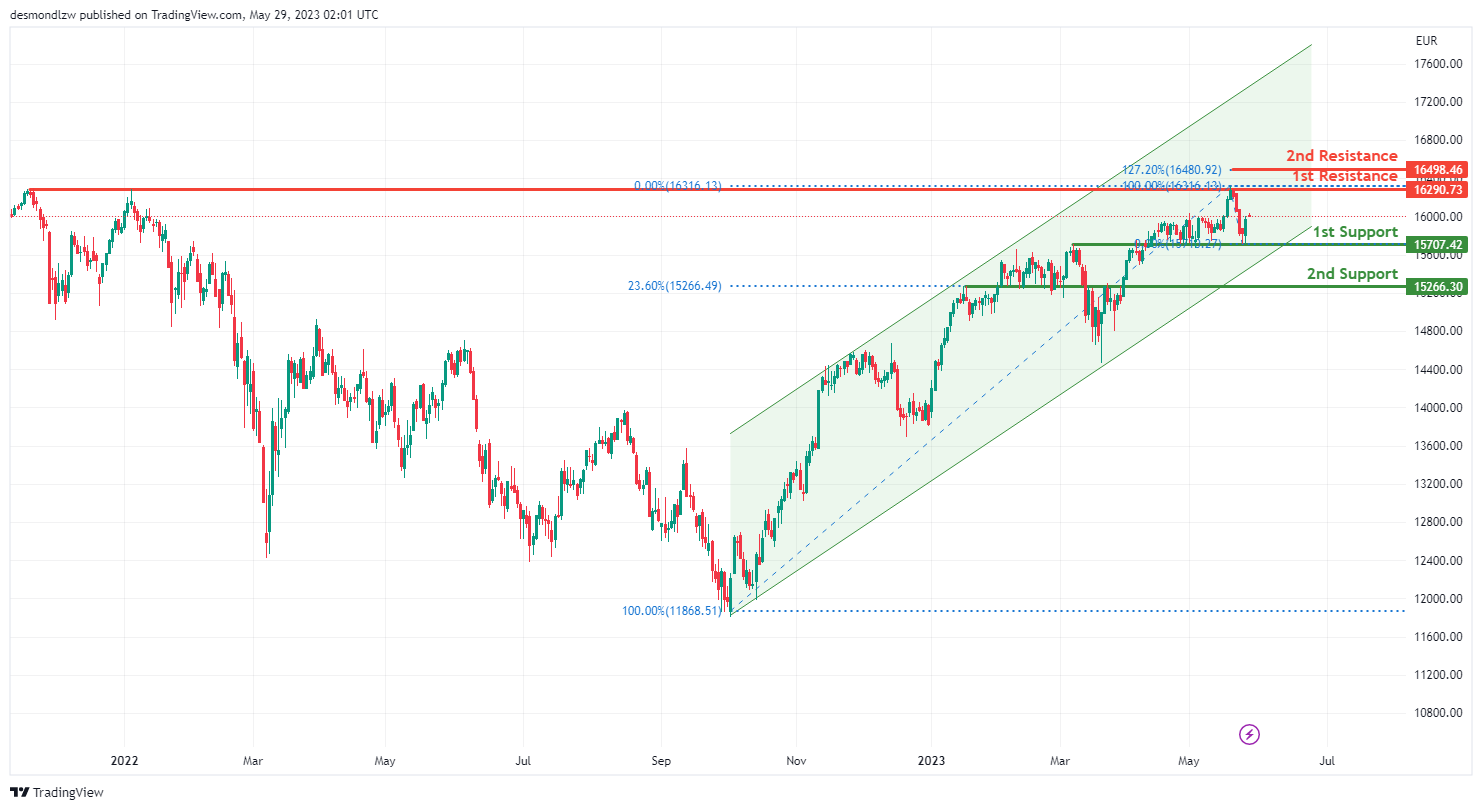
The GER30 (DAX) chart currently shows bullish momentum, with the price moving within a bullish ascending channel, indicating the potential for further upward movement.
There is a possibility of a bullish continuation towards the first resistance level at 16290.73. This level represents a multi-swing high resistance and could pose a challenge for the price’s upward movement. Additionally, there is a second resistance level at 16498.46, which coincides with the 127.20% Fibonacci extension.
On the support side, the first support level at 15707.42 is identified as an overlap support. This level may act as a price floor during pullbacks. Furthermore, there is a second support level at 15266.30, which serves as a pullback support and aligns with the 23.60% Fibonacci retracement.
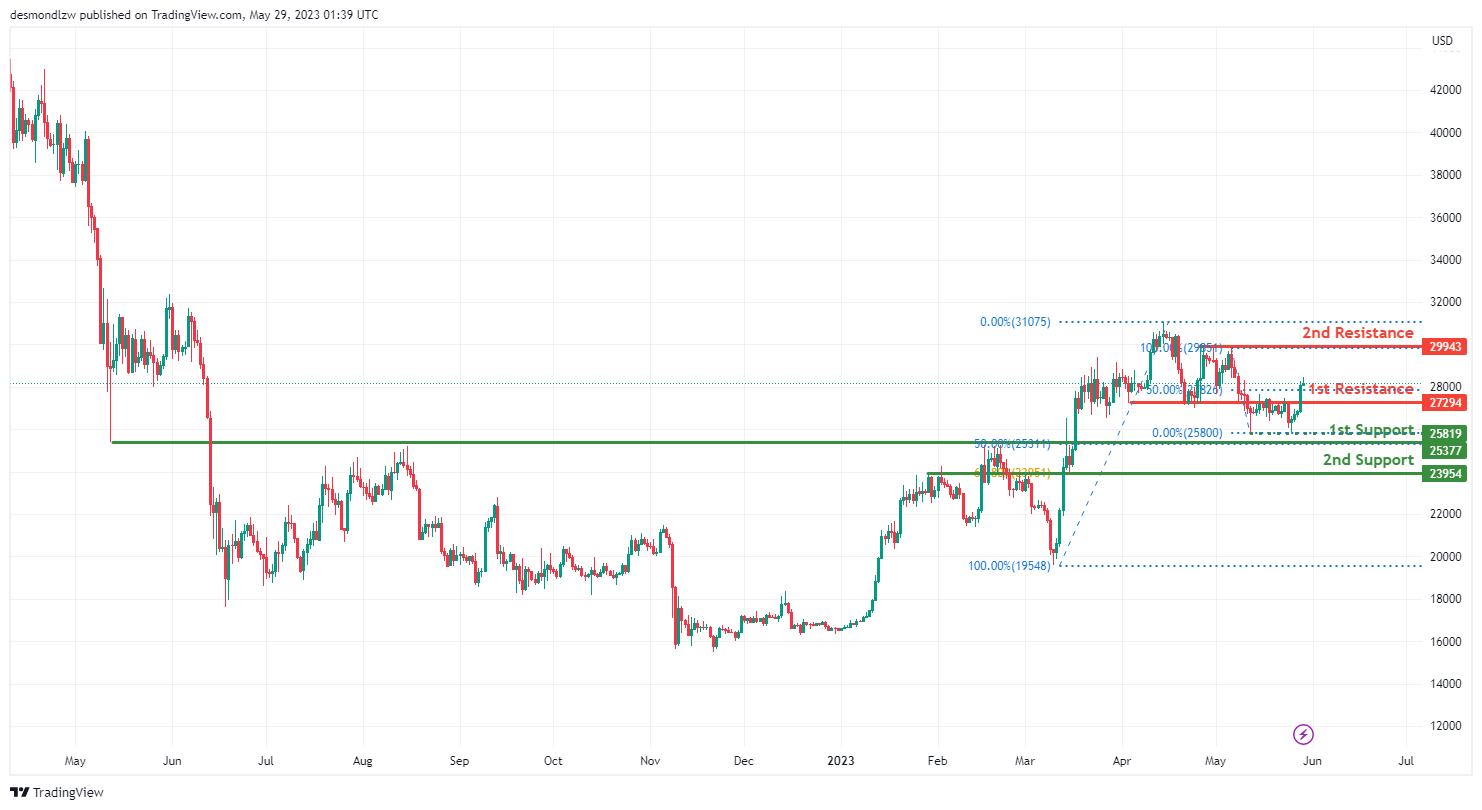
BTC/USD:
The BTC/USD chart currently demonstrates bullish momentum, indicating the potential for further upward movement.
There is a possibility of a bullish break through the first resistance level at 27294 and a subsequent rise towards the second resistance level at 29943.
On the support side, the first support level at 25377 is identified as an overlap support and aligns with the 50% Fibonacci retracement. This level may provide a price floor during pullbacks. Additionally, there is a second support level at 23954, recognized as an overlap support and coinciding with the 61.80% Fibonacci retracement.
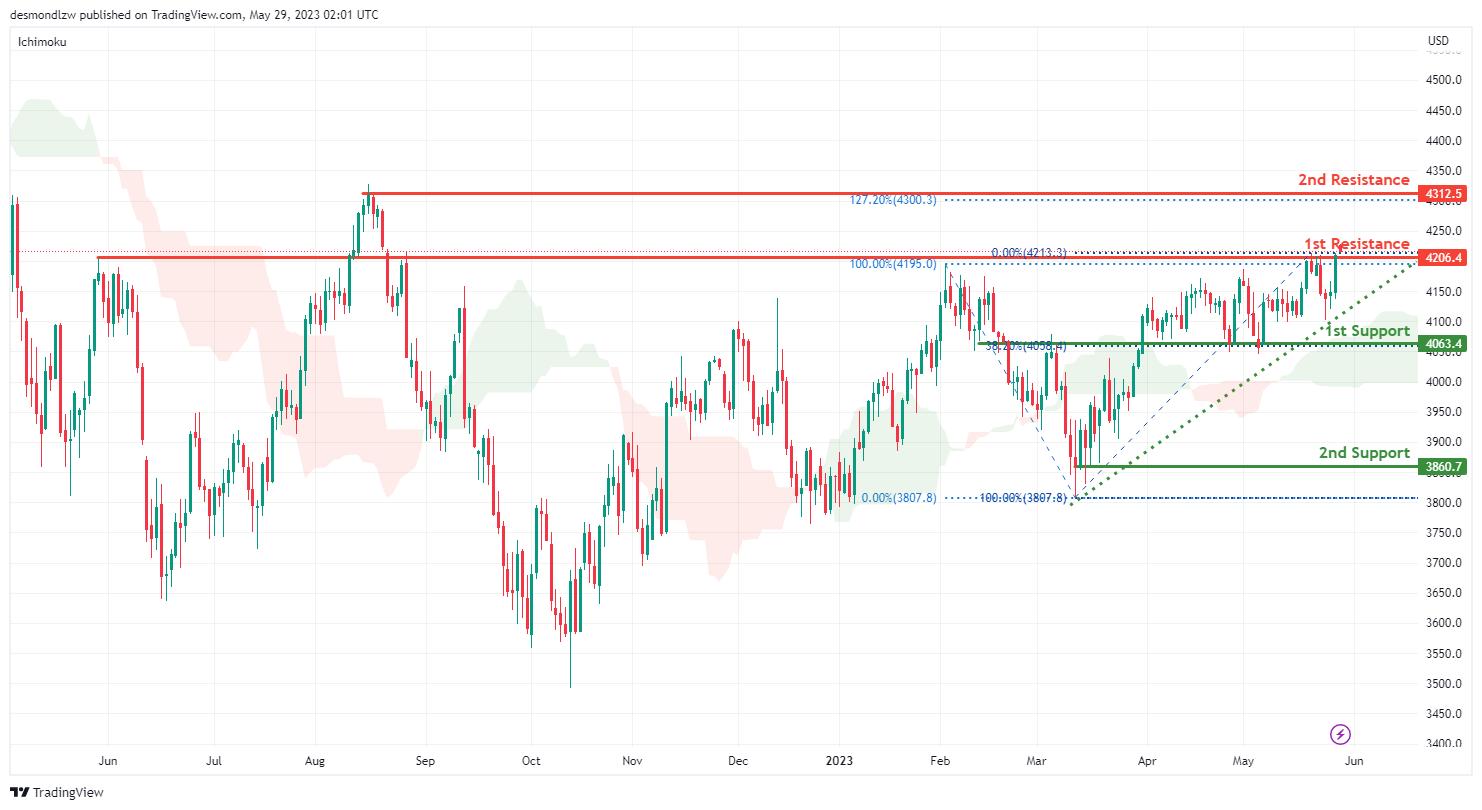
US500
The US500 chart currently exhibits bullish momentum, indicating the potential for further upward movement.
There is a possibility of a bullish break through the first resistance level at 4206.4 and a subsequent rise towards the second resistance level at 4312.5.
Support levels are identified at 4063.4 and 3860.7. The first support level aligns with an overlap support and the 38.20% Fibonacci retracement, while the second support level is recognized as a multi-swing low support.
It’s worth noting that the price is also above a major ascending trend line and the bullish Ichimoku cloud, which further supports the bullish momentum.
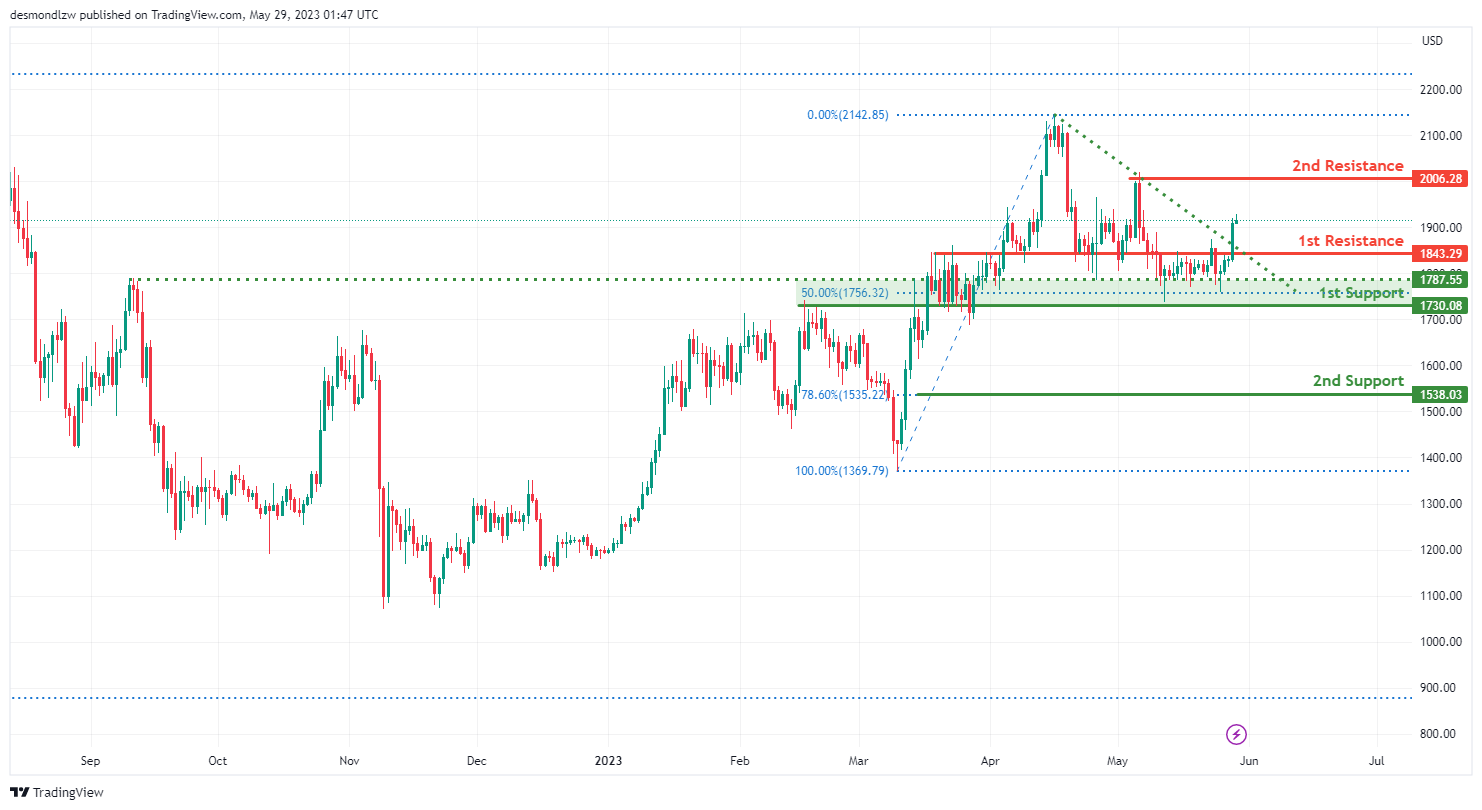
ETH/USD:
The ETH/USD pair is exhibiting a bullish momentum, with the price recently breaking above a descending resistance line, suggesting a potential bullish move.
Your first line of support is at 1730.08, serving as an overlap support and representing the 50% Fibonacci retracement level. This area may attract buyers in the market, holding the price from falling further.
If the price breaks below this level, the second line of support lies at 1538.03, which is the 78.60% Fibonacci retracement level. It’s a significant level where the market could see additional buying interest to prevent a further decline.
On the upside, the first resistance is at 1843.29, which is currently acting as a pullback resistance. If bullish momentum continues and the price manages to break through this resistance, it could pave the way for further upward movement.
The second resistance is at 2006.28, which was a previous swing high. This resistance may be strong, as sellers previously found this level attractive to sell or short, causing the price to reverse downwards.
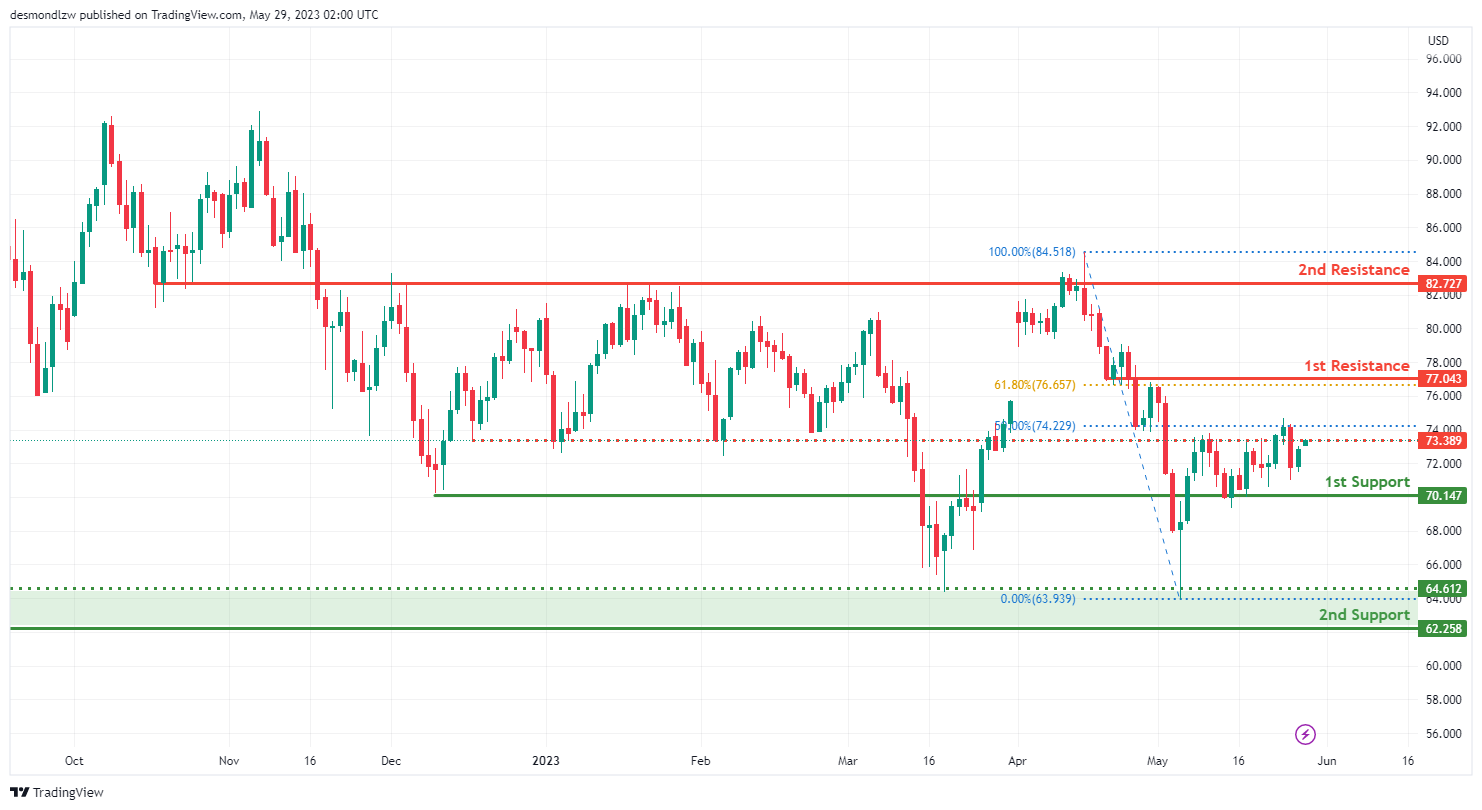
WTI/USD:
WTI (West Texas Intermediate) crude oil indicates a bullish momentum, suggesting a potential for price continuation towards the first resistance.
The first line of support is at $70.14, functioning as an overlap support. This level may draw buyers, keeping the price from dropping further.
If the price falls below this point, the second line of support is at $62.25, known as a multi-swing low support. This level, which has been tested multiple times as a support in the past, could again attract buyers and prevent further decline.
Looking upward, the first resistance level is at $77.04, serving as an overlap resistance and also marking the 61.80% Fibonacci retracement level. This could be a crucial level where the market might see some selling pressure.
The intermediate resistance level is at $73.38, another overlap resistance and the 50% Fibonacci retracement level. This level may provide some resistance before the price reaches the first resistance level.
The second resistance is at $82.72, which is another overlap resistance. This level may see strong selling pressure as it has served as a reversal point in the past.
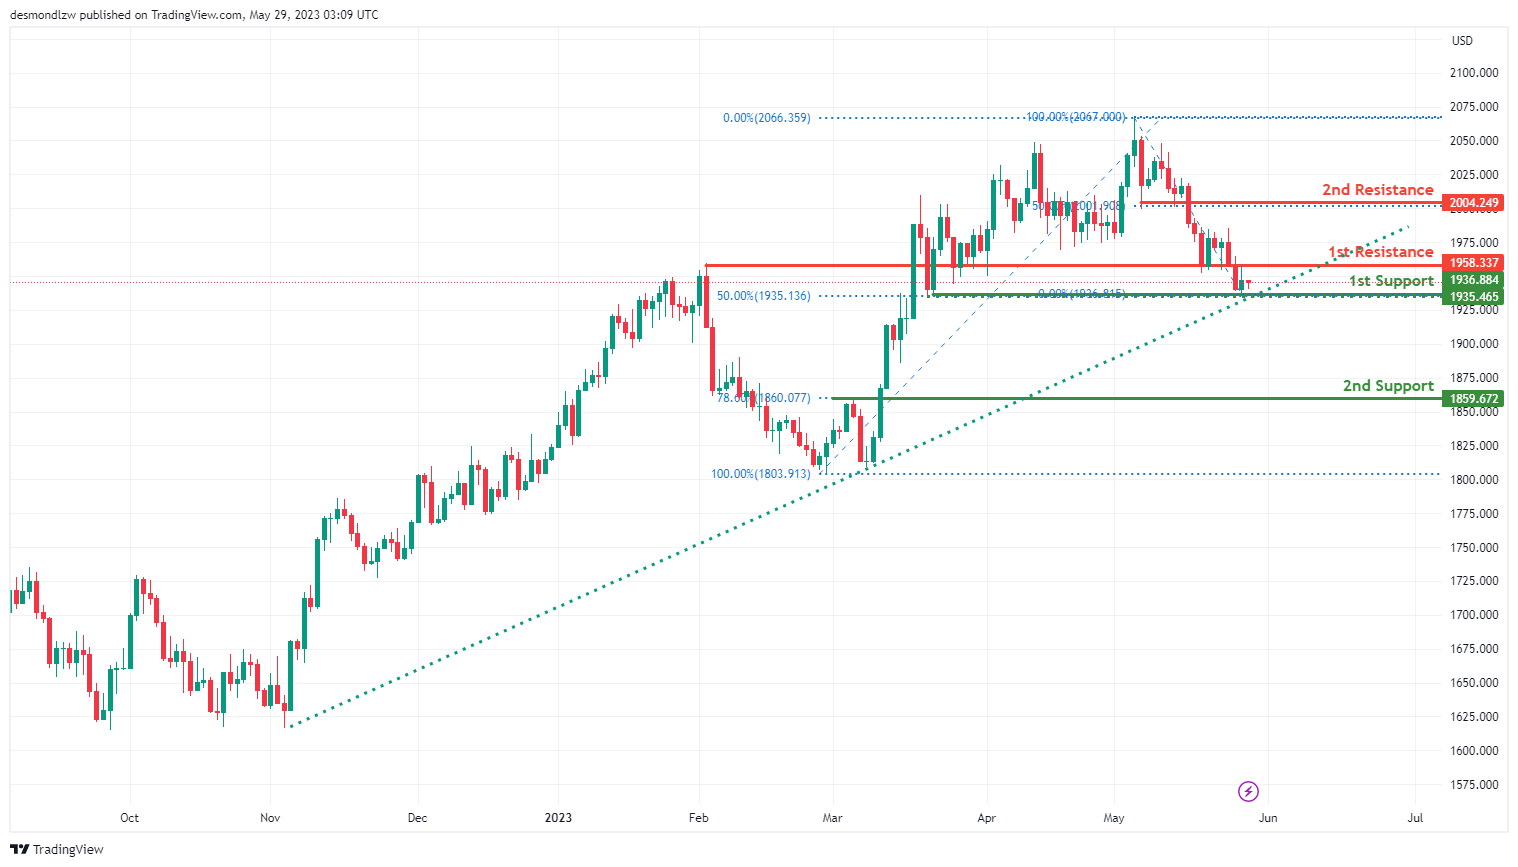
XAU/USD (GOLD):
Based on your analysis, the XAU/USD pair (Gold to US Dollar) is currently demonstrating a bullish momentum. The price being above a significant ascending trendline is a good indicator suggesting further bullish momentum could be anticipated.
The first level of support is at 1935.46. This point serves as the 50% Fibonacci retracement level, which could potentially attract buyers into the market, preventing the price from falling further.
If the price breaks below this level, the second line of support is at 1859.67. This level is a pullback support and represents the 78.60% Fibonacci retracement level. This area could serve as a strong buy zone to prevent the price from declining further.
On the upside, the first resistance level is at 1958.33, acting as an overlap resistance. If the bullish momentum continues, and the price manages to break above this resistance, further upward movement could be expected.
The second resistance is located at 2004.24, serving as a pullback resistance and the 50% Fibonacci retracement level. This resistance might be significant, as sellers previously found this level attractive enough to cause a price reversal.
The accuracy, completeness and timeliness of the information contained on this site cannot be guaranteed. IC Markets does not warranty, guarantee or make any representations, or assume any liability regarding financial results based on the use of the information in the site.
News, views, opinions, recommendations and other information obtained from sources outside of www.icmarkets.com, used in this site are believed to be reliable, but we cannot guarantee their accuracy or completeness. All such information is subject to change at any time without notice. IC Markets assumes no responsibility for the content of any linked site.
The fact that such links may exist does not indicate approval or endorsement of any material contained on any linked site. IC Markets is not liable for any harm caused by the transmission, through accessing the services or information on this site, of a computer virus, or other computer code or programming device that might be used to access, delete, damage, disable, disrupt or otherwise impede in any manner, the operation of the site or of any user’s software, hardware, data or property.


