
EUR/USD:
Weekly gain/loss: +1.68%
Weekly closing price: 1.2428
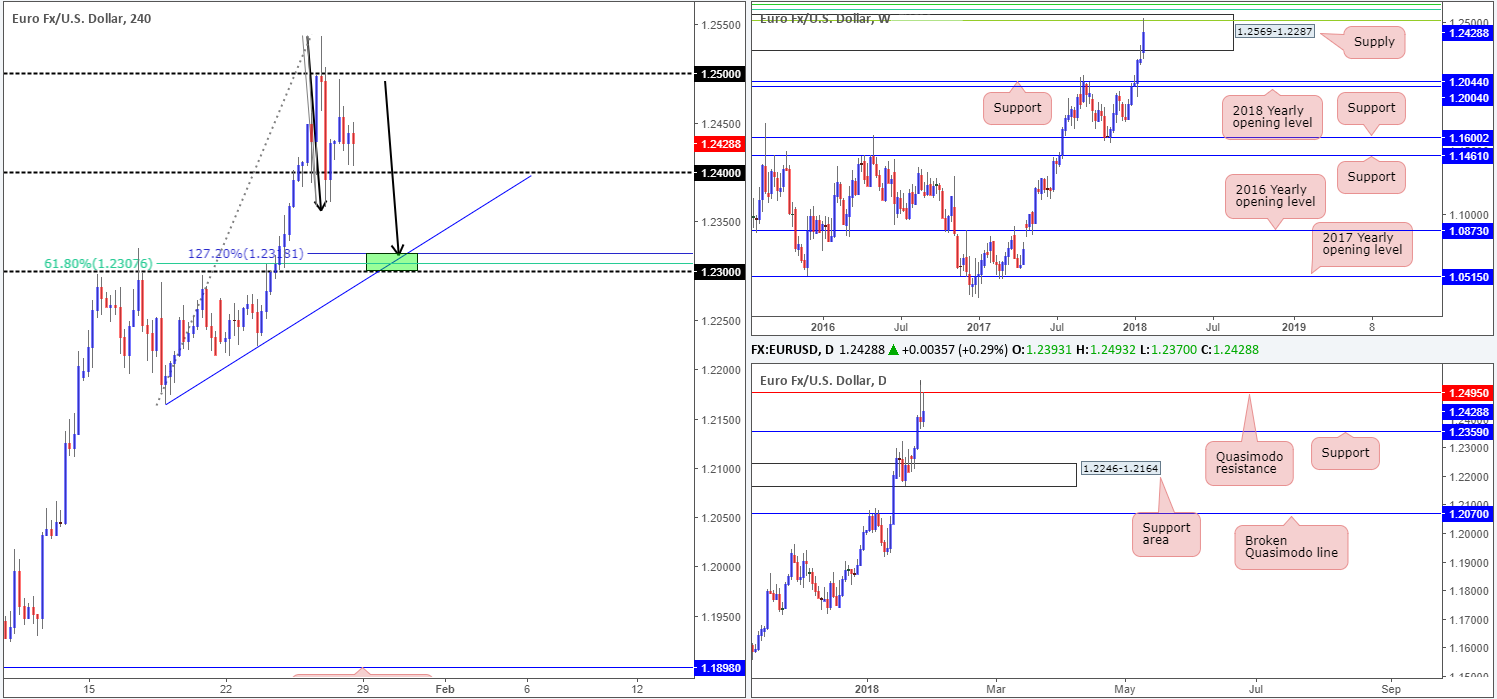
Despite the end-of-week correction from highs of 1.2537, the euro put in another solid performance last week.
Registering its sixth consecutive weekly gain, the unit managed to advance more than 200 pips!
While this is an incredibly impressive run, we still have to take into account that weekly price concluded the week closing within the walls of a strong-looking weekly supply area at 1.2569-1.2287, along with monthly price on the US dollar index seen trading from support at 88.50. Not only this, but circling around the top edge of the weekly supply is a weekly Fibonacci resistance cluster (green lines):
- 61.8% Fib resistance at 1.2604 taken from the high 1.3993.
- 50.0% Fib resistance at 1.2644 taken from the high 1.4940.
- 38.2% Fib resistance at 1.2519 taken from the high 1.6038.
Moving down to the daily timeframe, we can see that a daily Quasimodo resistance level at 1.2495 elbowed its way into the spotlight on Thursday. The level – coupled with the weekly 38.2% Fib resistance at 1.2519 and noted weekly supply – prompted the daily candles to print two back-to-back daily selling wicks (also known as bearish pin bars). Key support from this point rests nearby at 1.2359. A break beyond here potentially sets the stage for a continuation move down to a daily support area coming in at 1.2246-1.2164.
A quick recap of Friday’s action on the H4 timeframe shows that the single currency recovered part of the losses that followed US President Trump’s comments regarding a strong dollar. H4 price bottomed at 1.2364 but lost momentum just ahead of the 1.25 handle. In the event that 1.24 is taken out today/early this week, this move could begin forming the D leg required for a H4 AB=CD pattern (black arrows) that terminates around the 127.2% Fib ext. point at 1.2318 (converges with a H4 trendline support drawn from the low 1.2165 and a round number at 1.23 [green zone]).
Market direction:
Given the weekly and daily resistances currently in motion, a breach beyond the 1.24 handle and daily support at 1.2359 is a reasonable possibility going forward.
A bounce from 1.23 is expected, however, in view of its surrounding H4 confluence. How much of a bounce, though, is difficult to judge since let’s remember that this area is positioned within weekly supply! In addition to this, keep in mind that psychological numbers such as 1.23 are prone to fakeouts. Therefore, entering long based on a pending order may not be the best path to take. Waiting for additional candle confirmation (buying tails/engulfing candles etc.) could be a safer approach.
Data points to consider: US core PCE price index m/m at 1.30pm GMT.
Areas worthy of attention:
Supports: 1.24/1.23 handle; 1.2318; H4 trendline support; 1.2359; 1.2246-1.2164.
Resistances: 1.2569-1.2287; Weekly Fib cluster (see above); 1.2495; 1.25 handle.
GBP/USD:
Weekly gain/loss: +2.22%
Weekly closing price: 1.4162
In a similar fashion to the EUR/USD, the British pound performed strappingly last week. The unit managed to record its sixth consecutive weekly gain and drive beyond a weekly resistance level plotted at 1.4079 (now acting support). Despite the pullback from highs of 1.4344, last week’s move could have possibly cleared the path north for weekly price to challenge the 2016 yearly opening level marked at 1.4732.
In order for market action to climb to fresh highs, nevertheless, you can probably see that a daily resistance area coming in at 1.4393-1.4297 would need to be removed. Should this area manage to remain in the game this week, however, there’s a chance that daily price may slide below weekly support and look to approach daily support registered at 1.3878.
Over on the H4 timeframe, we can see that following US President Trump’s comments about a strong dollar, the pair chewed through the 1.42 handle and challenged 1.41. Price attempted to reclaim losses on Friday, but failed ahead of 1.43, despite UK prelim GDP q/q figures surprising to the upside.
Market direction:
The closing break back below 1.42 will likely attract further selling down to the 1.41 region today/early this week (note that directly below is weekly support at 1.4079).
Traders may have also noticed that H4 price is on track to complete a H4 AB=CD formation (black arrows) that terminates around the 127.2% Fib ext. point at 1.4009 (a few pips ahead of the large psychological number 1.40). This would imply a potential fakeout beneath weekly support (and break of 1.41), likely triggering a truckload of stop-loss orders along the way!
In light of the above, we believe the pair is a high-probability buy around the 1.40 mark. Just to be clear though, a mild fakeout is likely to be seen through this number as this is common around psychological bands. For that reason, try to avoid entering based on a pending order. Instead, wait and assess the H4 candle reaction from 1.40 before pulling the trigger.
Data points to consider: US core PCE price index m/m at 1.30pm GMT.

Areas worthy of attention:
Supports: 1.41 handle; 1.4079; 1.4009; 1.40 handle.
Resistances: 1.4732; 1.4393-1.4297; 1.43/2 handle.
AUD/USD:
Weekly gain/loss: +1.46%
Weekly closing price: 0.8108
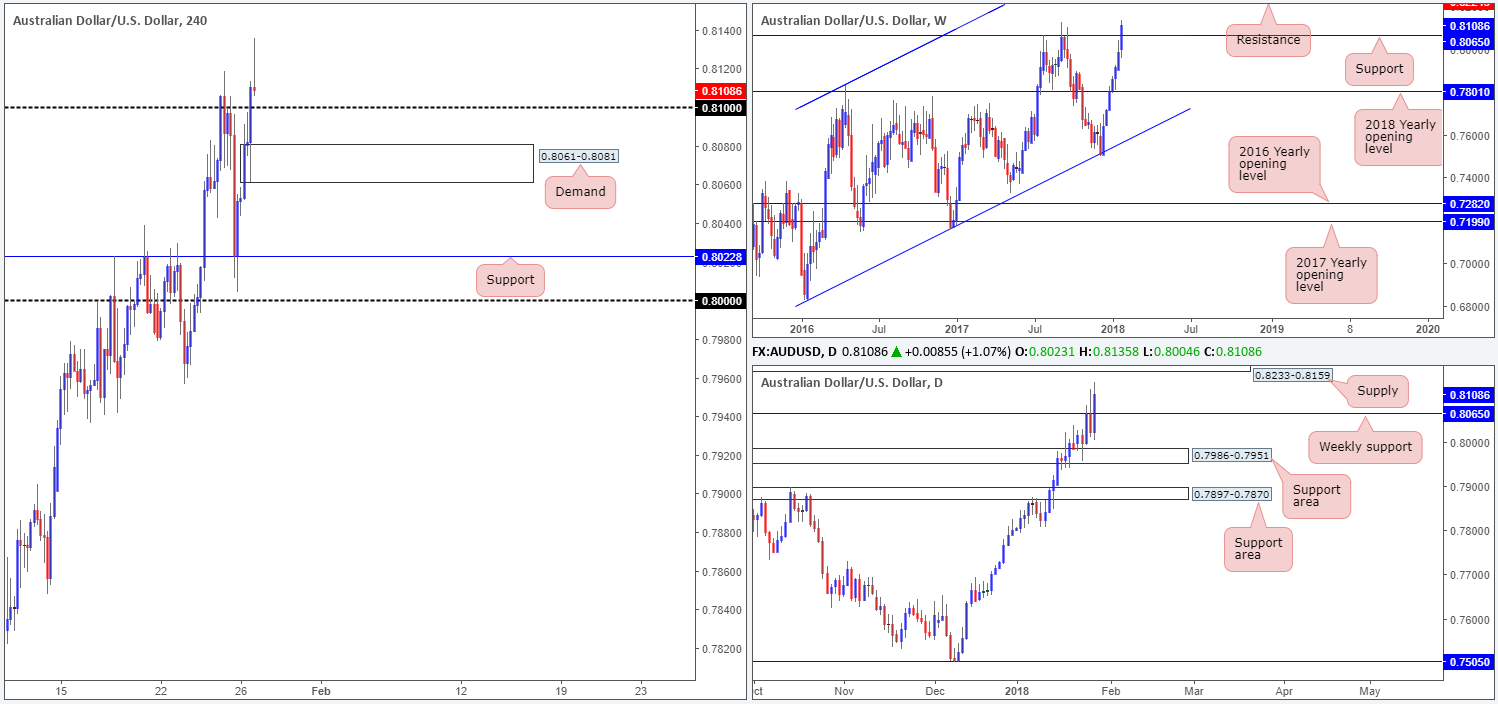
Since weekly price struck the weekly channel support extended from the low 0.6827 seven weeks ago, AUD/USD bulls have been on the offensive. Last week’s action dragged the commodity currency to highs of 0.8135, breaking through weekly resistance at 0.8065 (now acting support) and possibly opening the stage for a continuation move up to weekly resistance penciled in at 0.8224 (not seen on the screen).
Zooming in for a closer look on the daily timeframe, we can see that the break of weekly resistance mentioned above at 0.8065 has placed a daily supply zone formed back in early Jan 2015 (proved valid in May 2015) at 0.8233-0.8159 (houses the weekly resistance at 0.8224 within) on the hit list.
Friday’s action on the H4 timeframe erased all losses that followed US President Trump’s comments regarding a strong dollar. The H4 candles bottomed just ahead of the 0.80 band (H4 support at 0.8022) before starting the recovery, and ended the day chomping through the 0.81 level.
Market direction:
As can be seen on the H4 timeframe, the pair chalked up a closing H4 bearish selling wick a few pips above 0.81. This likely caught the eye of candlestick traders. However, looking to sell this formation is not a trade we would label high probability. Here’s why:
- Possible buying pressure from 0.81.
- Directly below 0.81 we have a H4 demand base located at 0.8061-0.8081.
- Within the H4 demand is the weekly support at 0.8065.
- The H4 bearish selling wick failed to clip the underside of the current daily supply, thereby indicating further upside may be needed before serious sellers make an appearance.
Although a sell is out of the question, in our opinion, a buy is also somewhat tricky given how close the daily supply at 0.8233-0.8159 (houses the weekly resistance at 0.8224 within) is positioned!
Data points to consider: US core PCE price index m/m at 1.30pm GMT.
Areas worthy of attention:
Supports: 0.81 handle; 0.8061-0.8081; 0.8065; 0.7986-0.7951.
Resistances: 0.8224; 0.8233-0.8159.
USD/JPY:
Weekly gain/loss: -1.98%
Weekly closing price: 108.58
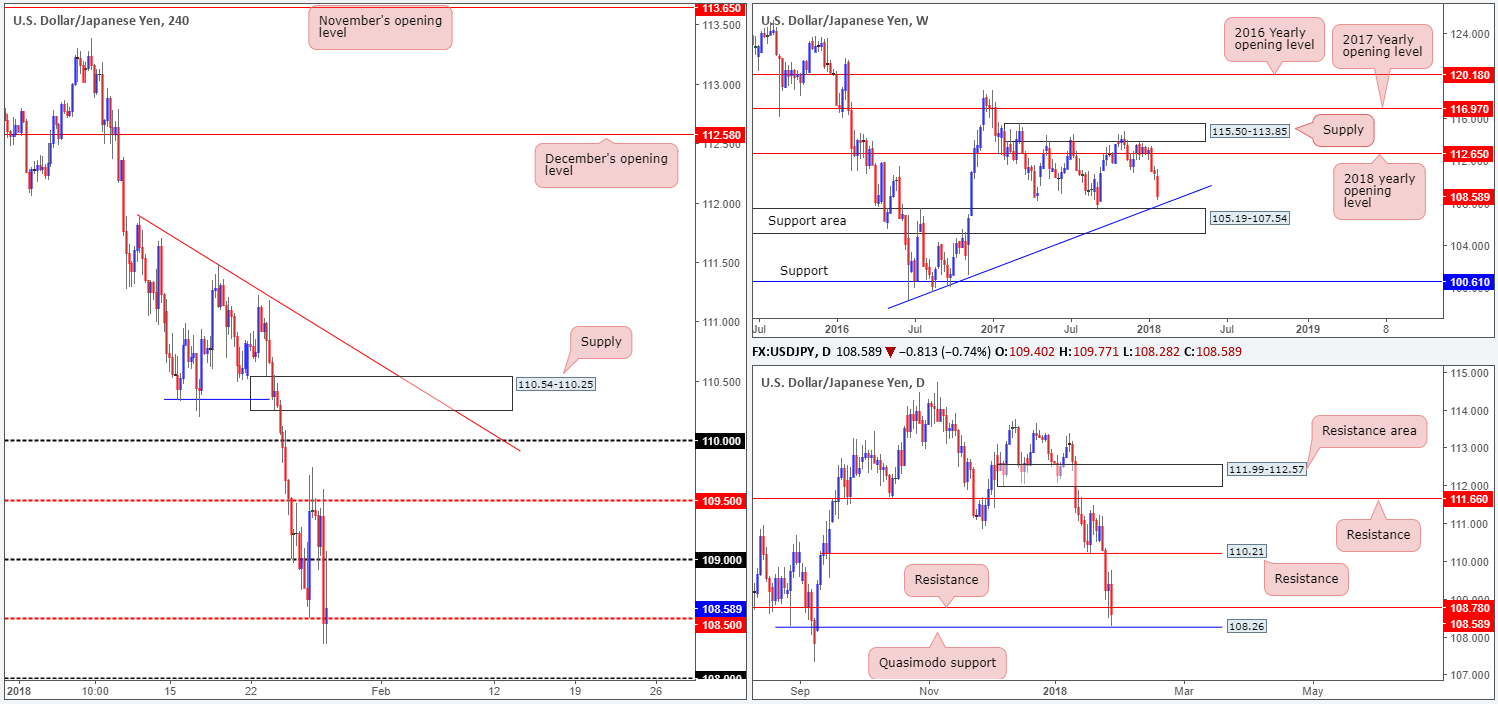
The USD/JPY suffered additional loss last week, wiping away 223 pips in value, or nearly 2%.Thanks to this latest bout of selling, weekly movement is seen trading within a reasonable distance of a weekly trendline support taken from the low 98.78, followed closely by a weekly support area at 105.19-107.54.
Turning our attention to the daily timeframe, daily support at 108.78 experienced a minor breach on Friday after the pair produced a daily bearish engulfing candle. While this is considered a bearish cue, other key points to note here is the daily Quasimodo support seen just beneath at 108.26 which happens to be bolstered by the top edge of the weekly support area registered at 107.54 (low of the daily Quasimodo support comes in at 107.31).
H4 price failed to sustain gains beyond the H4 mid-level resistance at 109.50 on Friday, and consequently fell sharply on the back of Gov. Kuroda’s comments at the World Economic Forum in Davos. 109, as you can see, was quickly removed, leaving H4 price free to whipsaw through the H4 mid-level support at 108.50 into the close.
Market direction:
Sellers’ stop-loss orders have likely been filled below 108.50, as have breakout sellers’ sell orders. Together, these orders provide traders liquidity to buy. And, as we have recently seen price come within an inch of the aforementioned daily Quasimodo support that’s bolstered by a weekly support area at 105.19-107.54, a recovery may be on the cards.
Although a move higher is feasible, it does not come without opposition. Nearby we have the recently engulfed daily support-turned resistance at 108.78 to contend with, as well as the fact that weekly price shows space to stretch a little lower. Therefore, to confirm a bullish reversal from 108.26, we would need to witness a decisive DAILY close above the daily resistance 108.78. Selling, on the other hand, is out of the question as far as we can see. Selling into a daily Quasimodo, and then the top edge of a weekly support area/weekly trendline support, is not a trade with high odds, in our opinion, despite a down trending market.
Data points to consider: US core PCE price index m/m at 1.30pm GMT.
Areas worthy of attention:
Supports: 108.50; 108.26; Weekly trendline support; 105.19-107.54.
Resistances: 109 handle; 108.78.
USD/CAD:
Weekly gain/loss: -1.44%
Weekly closing price: 1.2314
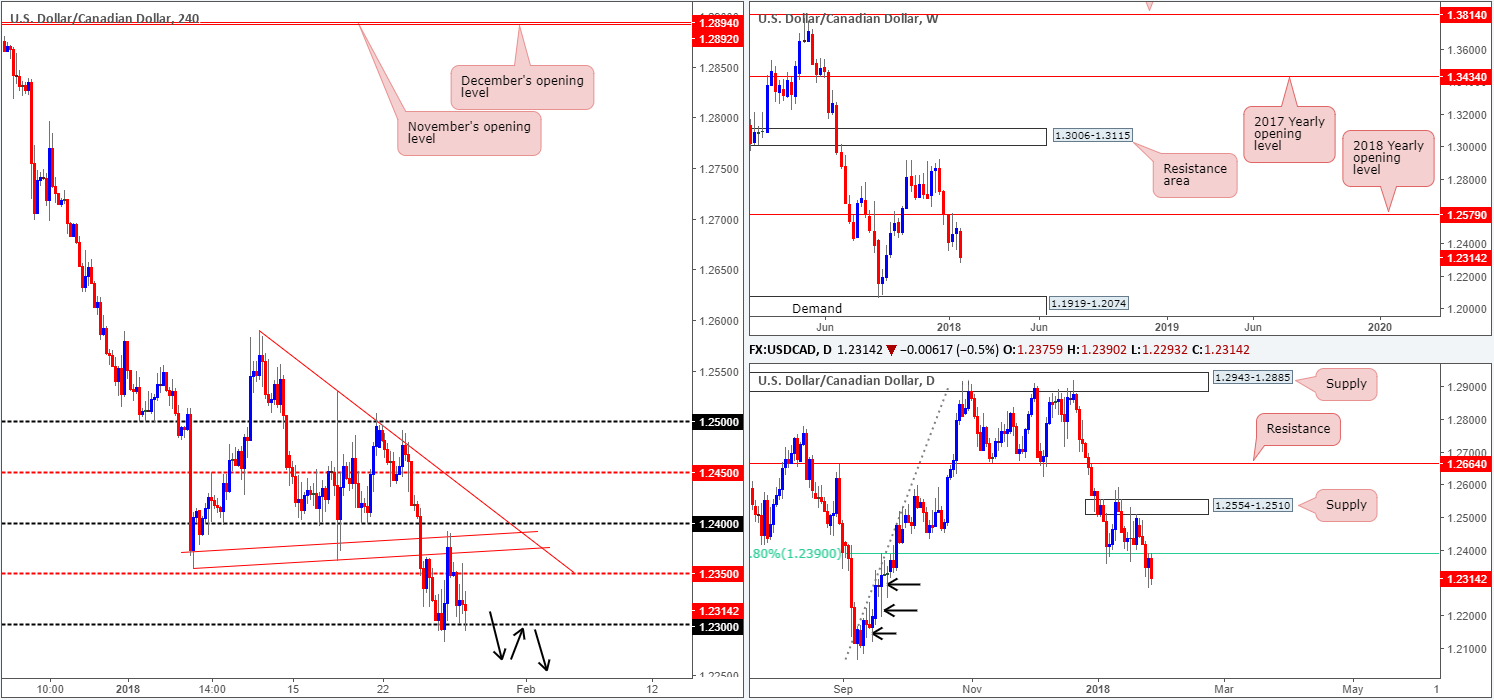
After spending two weeks consolidating below the 2018 yearly opening level on the weekly timeframe at 1.2579, the sellers finally cranked it up a gear and moved lower last week. In the shape of a near-full-bodied weekly bearish candle, the pair erased more than 180 pips, or nearly 1.50%. With little weekly support in sight until we reach the weekly demand base at 1.1919-1.2074, further selling in the coming weeks is a real possibility.
Daily price, as you can see, drew in a solid bearish candle on Friday below 1.2390: a daily 61.8% Fib support-turned resistance. Below 1.2390 there’s little support worthy of mention, in our opinion. Note the clear daily buying tails marked with black arrows at 1.2253, 1.2194 and 1.2118. These, to us, resemble consumption of unfilled buy orders.
A brief look at recent dealings on the H4 timeframe shows that price spent the majority of Friday’s segment encased between a H4 mid-level resistance at 1.2350 and the 1.23 handle. Should 1.23 fail to hold this week, the next downside objective in the firing line can be seen at 1.2236: a H4 Quasimodo support. To the upside, above 1.2350, movement is somewhat restricted, given a H4 trendline resistance extended from the low 1.2355 and the 1.24 handle.
Market direction:
Our bias, at least medium/long term, is short. This is largely because of where price is located on the bigger picture. A H4 close beneath 1.23 would, in our view, further confirm this bearish bias and open up the possibility for a short trade. However, we would not label a breakout as a high-probability setup as they have a tendency to recoil. Instead, consider waiting for the H4 close to form itself and look to then trade any (successful) retest of 1.23 thereafter (as per the black arrows), targeting the noted H4 Quasimodo support at 1.2236 as an initial take-profit zone.
Data points to consider: US core PCE price index m/m at 1.30pm GMT.
Areas worthy of attention:
Supports: 1.23 handle; 1.2350; 1.2236; 1.1919-1.2074.
Resistances: 1.24 handle; H4 trendline resistance; 1.2350; 1.2390.
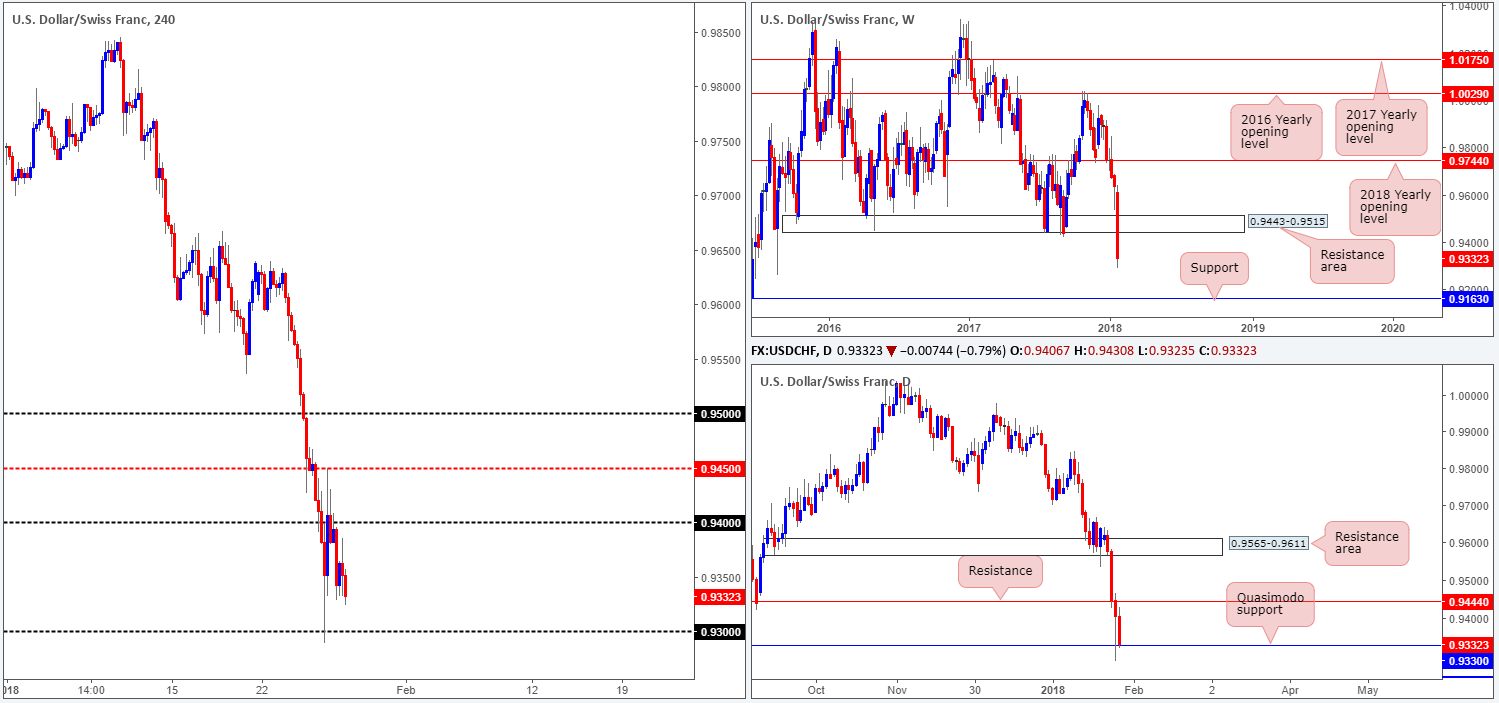
USD/CHF:
Weekly gain/loss: -3.21%
Weekly closing price: 0.9332
The USD/CHF suffered its biggest loss in quite some time last week, erasing a whopping 300 pips in the process. As is evident on the weekly timeframe, the weekly support area at 0.9443-0.9515 (now acting resistance zone) was completely mutilated, likely freeing the path south down to as far as the weekly support plotted at 0.9163.Although this was an eye-opening decline, it is worth remembering that the US dollar index is seen trading from a monthly support at 88.50.
Thanks to the recent dollar decline, daily support at 0.9444 (now acting resistance) was consumed, with daily price going on to cross swords with a daily Quasimodo support carved from 0.9330. Thursday’s response from this line was promising, forming a reasonably strong buying tail. Friday, however, failed to generate any follow-through action and concluded the week revisiting the daily Quasimodo support. Assuming that this line gives way this week, the next level eyed is likely to be the daily Quasimodo support pegged at 0.9233.
Despite a strong push to the upside on Thursday on the back of US President Trump’s comments regarding the strength of the dollar, the H4 candles were unable to muster enough oomph to remain bid above the 0.94 base on Friday, and therefore collapsed to lows of 0.9323.
Market direction:
With weekly direction showing little stopping price from declining lower, and Friday’s reaction from the daily Quasimodo support at 0.9330 registering minimal bullish intent, further downside is likely to be seen this week. To become sellers in this market, however, it might be an idea to wait for a H4 close to form beneath the 0.93 handle. A close below here followed up with a successful retest would, in our view, be enough to warrant a sell trade down to the daily Quasimodo support mentioned above at 0.9233.
Data points to consider: US core PCE price index m/m at 1.30pm GMT.
Areas worthy of attention:
Supports: 0.93 handle; 0.9330; 0.9233; 0.9163.
Resistances: 0.94 handle; 0.9444; 0.9443-0.9515.
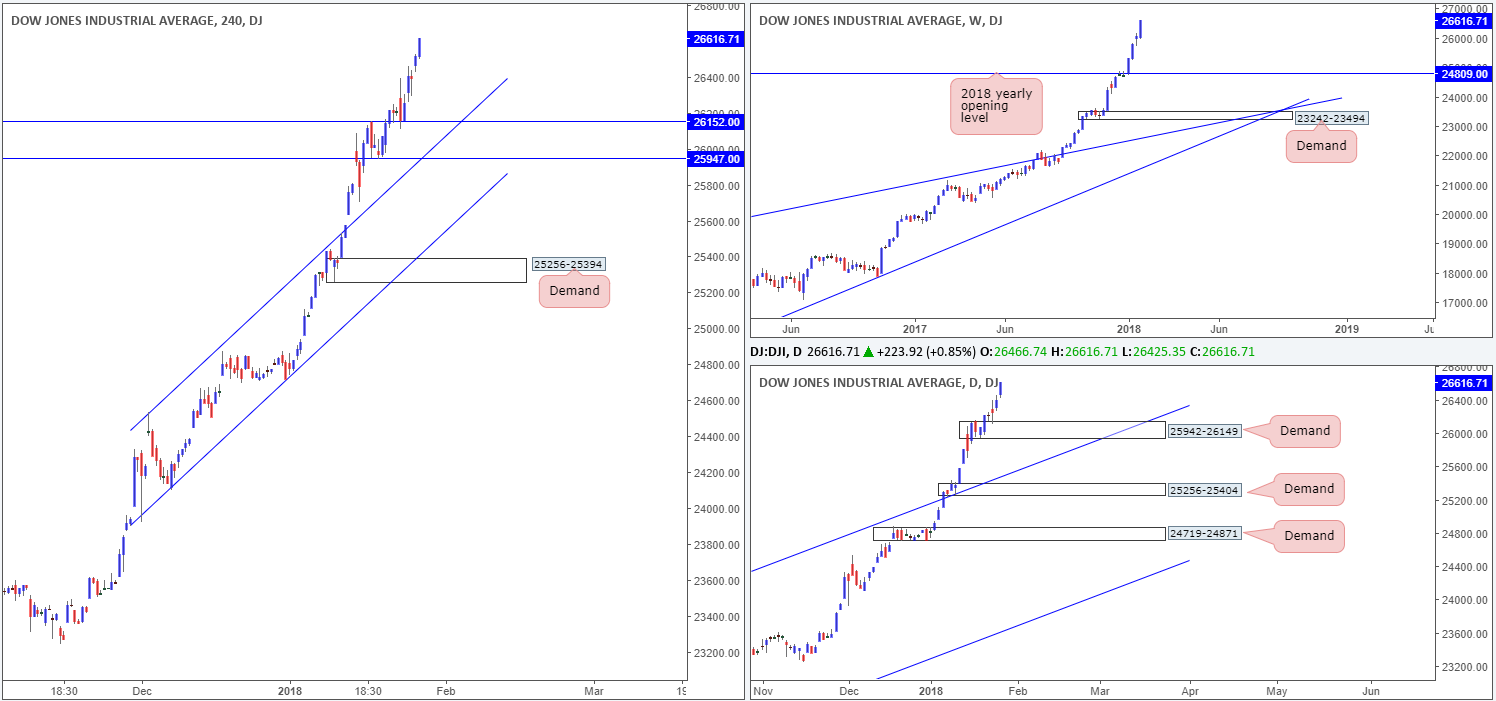
DOW 30:
Weekly gain/loss: +2.09%
Weekly closing price: 26616
US equities put in another solid performance during the course of last week’s trading, printing a full-bodied weekly bullish candle. A pullback on the weekly timeframe could see the index dip as low as the 2018 yearly opening level at 24809.
A closer look on the daily timeframe shows that daily price chalked up a demand base last week drawn from 25942-26149. A violation of this area would open the floor to a potential test of the daily channel support extended from the high 21169.
Local support on the H4 timeframe at 26152 held beautifully on Wednesday, allowing buyers a platform to enter this market. Well done to any of our readers who managed to catch this move as it was highlighted as a potential buy, especially given Wednesday’s near-full-bodied H4 bull candle.
Market direction:
Further upside still remains the favored position, and will do for a while yet.
Near term, the following levels remain of interest:
- The current H4 support at 26152. A second retest of this level, followed up with a H4 full or near-full-bodied bull candle, would, in our view, be enough to warrant a buy.
- The broken H4 channel resistance-turned support taken from the high 24535 and H4 support at 25947.
Data points to consider: US core PCE price index m/m at 1.30pm GMT.
Areas worthy of attention:
Supports: 26152; 25947; H4 channel support; 24809; 25942-26149; Daily channel support.
Resistances: …
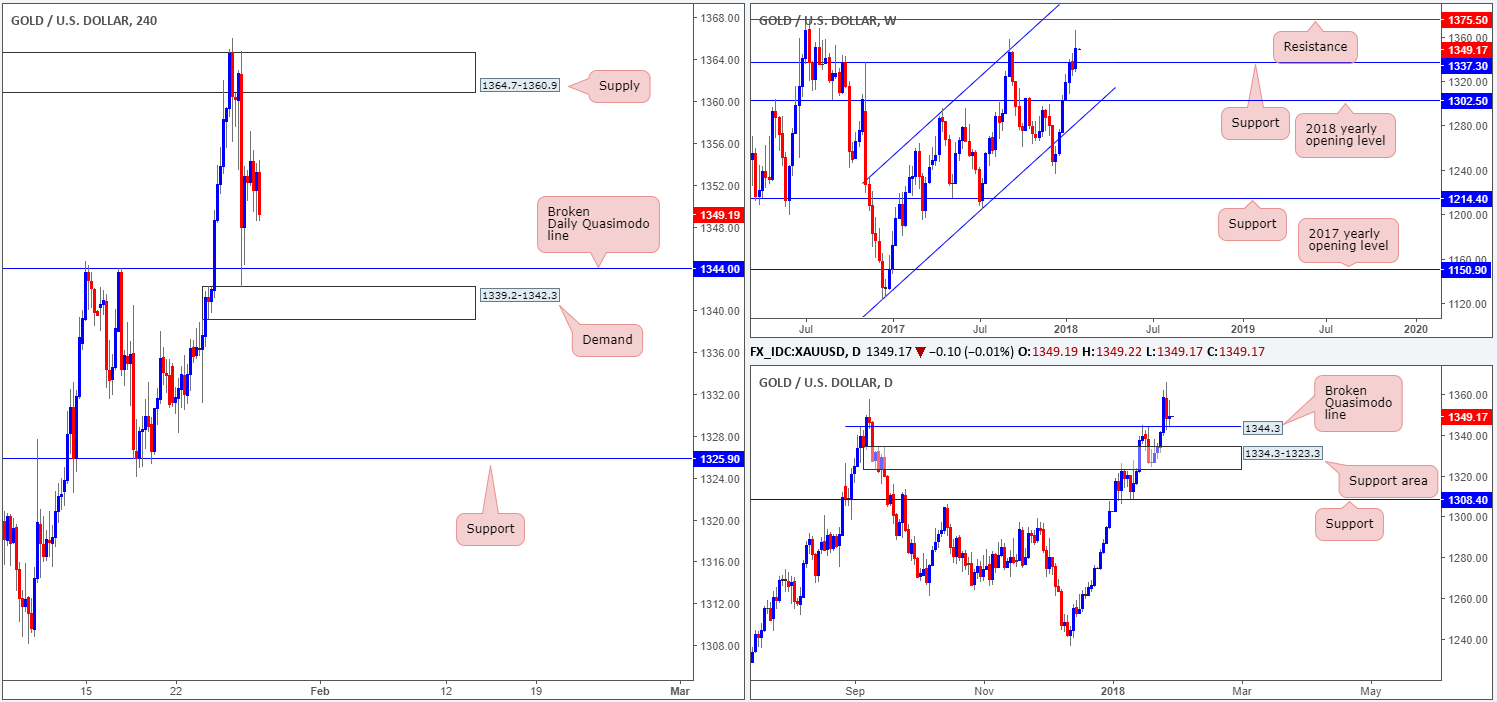
GOLD:
Weekly gain/loss: +1.37%
Weekly closing price: 1349.1
The price of gold increased in value over the course of last week’s segment, consequently crossing above weekly resistance at 1337.3 (now acting support) and reaching a high of 1366.0. An unrelenting bearish assault on the US dollar provided the yellow metal the fuel to push higher, and exposed a weekly resistance level at 1375.0. Despite this, the tables may turn this week for the metal as the US dollar (index) recently crossed paths with a monthly support logged at 88.50.
Looking at this market from the daily timeframe, the unit is currently bid above a daily broken Quasimodo support registered at 1344.3. In the case that this level holds ground this week, it could encourage further buying up to the noted weekly resistance level.
Over on the H4 timeframe, candle action ended the week closing mid-range between a H4 supply area at 1364.7-1360.9 and the aforesaid daily broken Quasimodo line/H4 demand at 1339.2-1342.3.
Market direction:
Taking into account how close weekly price came to connecting with weekly resistance at 1375.5, along with possible dollar buying from the USDX monthly support at 88.50, sellers could enter the fray this week. On the other hand, the price of gold remains in a strong uptrend at the moment and is currently testing a daily broken Quasimodo line at 1344.0, which are notoriously high-probability levels!
As we highlighted in Friday’s report, neither a long nor short seems attractive at the moment. Irrespective of the direction one selects, oncoming higher-timeframe structure is a clear problem!
Areas worthy of attention:
Supports: 1339.2-1342.3; 1344.0; 1337.3.
Resistances: 1364.7-1360.9; 1375.5.
This site has been designed for informational and educational purposes only and does not constitute an offer to sell nor a solicitation of an offer to buy any products which may be referenced upon the site. The services and information provided through this site are for personal, non-commercial, educational use and display. IC Markets does not provide personal trading advice through this site and does not represent that the products or services discussed are suitable for any trader. Traders are advised not to rely on any information contained in the site in the process of making a fully informed decision.
This site may include market analysis. All ideas, opinions, and/or forecasts, expressed or implied herein, information, charts or examples contained in the lessons, are for informational and educational purposes only and should not be construed as a recommendation to invest, trade, and/or speculate in the markets. Any trades, and/or speculations made in light of the ideas, opinions, and/or forecasts, expressed or implied herein, are committed at your own risk, financial or otherwise.
The use of the site is agreement that the site is for informational and educational purposes only and does not constitute advice in any form in the furtherance of any trade or trading decisions.
The accuracy, completeness and timeliness of the information contained on this site cannot be guaranteed. IC Markets does not warranty, guarantee or make any representations, or assume any liability with regard to financial results based on the use of the information in the site.
News, views, opinions, recommendations and other information obtained from sources outside of www.icmarkets.com.au, used in this site are believed to be reliable, but we cannot guarantee their accuracy or completeness. All such information is subject to change at any time without notice. IC Markets assumes no responsibility for the content of any linked site. The fact that such links may exist does not indicate approval or endorsement of any material contained on any linked site.
IC Markets is not liable for any harm caused by the transmission, through accessing the services or information on this site, of a computer virus, or other computer code or programming device that might be used to access, delete, damage, disable, disrupt or otherwise impede in any manner, the operation of the site or of any user’s software, hardware, data or property.


