
EUR/USD:
Weekly gain/loss: -0.90%
Weekly close: 1.1139
Weekly perspective:
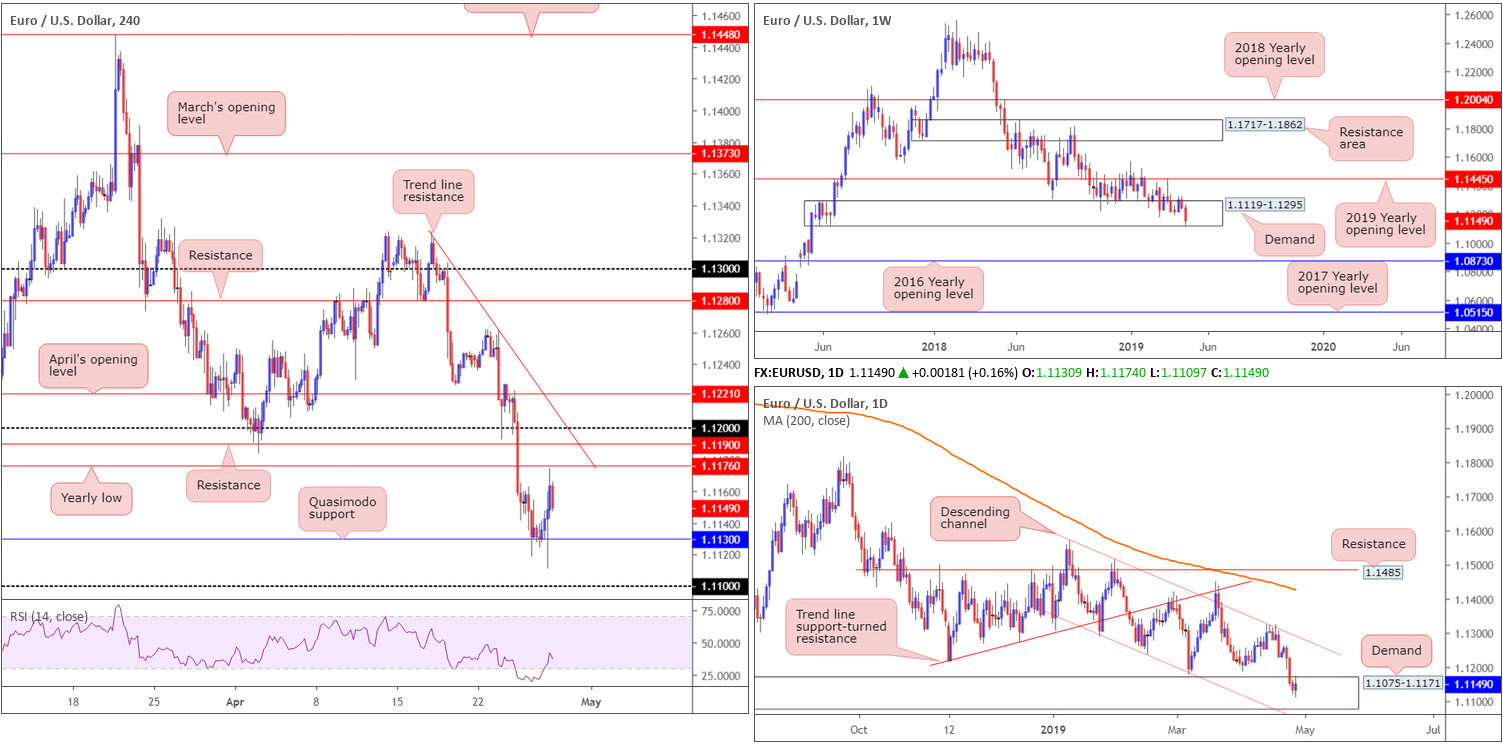
Last week’s sharp run to the downside pressured the euro into further losses, shedding close to 100 pips and refreshing 2019 lows. As a consequence to this, buyers appear to be losing grip of a reasonably long-standing demand area at 1.1119-1.1295. Recent flow clipped the lower edge of the zone, though was unlikely enough to trip stop-loss orders on this timeframe. A decisive break of the area to the downside, however, has the 2016 yearly opening level at 1.0873 to target.
Daily perspective:
Daily activity, on the other hand, continues to dip its toes into demand priced in at 1.1075-1.1171 (glued to the underside of the current weekly demand area). Note price action concluded the week by way of a bullish engulfing candle (shadows engulfed prior range) on this timeframe, and also remains compressing within the walls of a descending channel formation (1.1569/1.1289).
H4 perspective:
In recent sessions, the US dollar fell as the market shrugged off a GDP beat. Despite this, the currency managed to hold the majority of the week’s gains around the 98.00 handle (US dollar index).
Quasimodo support at 1.1130 nudged its way into the spotlight amid London hours Thursday and held form, propelling the unit towards the underside of the 2019 yearly low at 1.1176 Friday. Directly above here, traders may want to acknowledge resistance parked at 1.1190, closely followed by the 1.12 handle and intersecting trend line resistance extended from the high 1.1327.
Areas of consideration:
As highlighted in Friday’s briefing, the majority of the market are sellers at the moment. And with weekly demand quite literally ‘on its last legs’, further selling could still be on the cards today/this week.
Contrary to this, however, some technicians might feel the current daily demand (and the daily bullish engulfing formation) may be sufficient to keep buyers in the fight, together with the aforementioned H4 Quasimodo support.
Irrespective of the direction one selects, weakening structure is clearly evident. Therefore, unless you’re methodology reasons otherwise, opting to remain on the side lines may be the path to take as we head into a fresh week. Remember, trading flat is ALSO a POSITION.
Today’s data points: US Core PCE Price Index m/m; US Personal Spending m/m.
GBP/USD:
Weekly gain/loss: -0.64%
Weekly close: 1.2909
Weekly perspective:
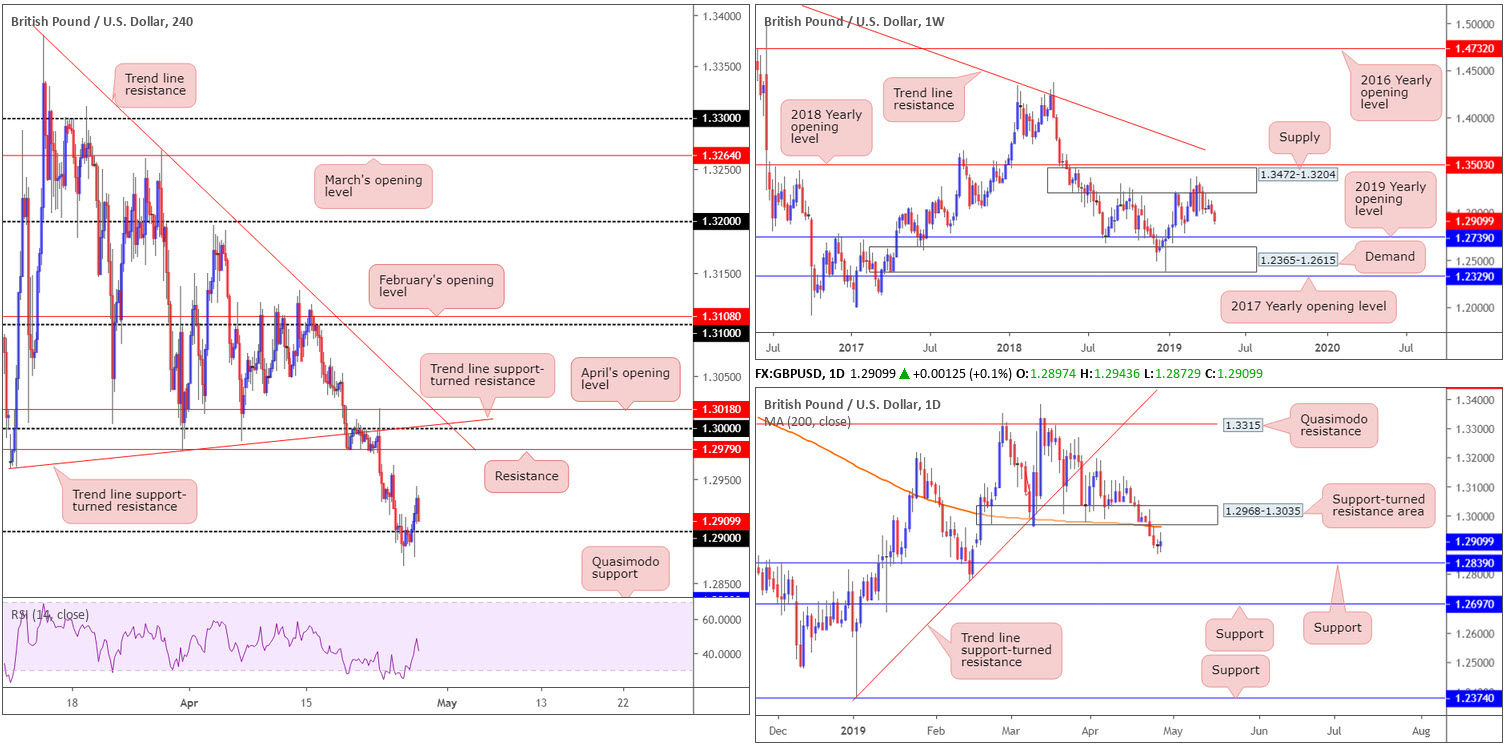
Since the end of February, the underside of supply at 1.3472-1.3204, situated a few points south of the 2018 yearly opening level at 1.3503, has been home to many traders. With the next obvious downside target not realised on this timeframe until the 2019 yearly opening level at 1.2739, and movement pressing more than 80 points lower last week, sellers still have plenty of room to manoeuvre if they shoot lower.
Daily perspective:
In conjunction with weekly flow, last week’s action saw daily price cross beneath its 200-day SMA (orange) and also overthrow a block of support coming in at 1.2968-1.3035 (now acting resistance). As a result of this, support at 1.2839 is now in the firing range. Before we reach here, though, traders might want to pencil in the possibility of a retest forming at 1.2968-1.3035 to draw in additional sellers.
H4 perspective:
Despite spending a portion of Thursday and Friday’s sessions beneath 1.29, GBP/USD bulls ended the week reclaiming the psychological mark to the upside amid Early European hours.
Having seen the pair conclude the week poised to retest 1.29 as support, however, short-term buying may materialise today/early week towards resistance plotted at 1.2979, shadowed closely by key figure 1.30 and two merging trend line resistances (1.3380/1.2975). In the event 1.29 fails to hold ground, nonetheless, the next port of call falls in around Quasimodo support at 1.2839 (also lines up with daily support highlighted above).
Areas of consideration:
Traders considering longs from 1.29 are urged to tread carefully. Not only is the overall market direction facing a southerly bearing at the moment, both weekly and daily structure exhibit space to explore lower ground.
Assuming our higher-timeframe reading is accurate and the H4 candles engulf 1.29 to the downside, the spotlight will be focused on shorts towards Quasimodo support at 1.2839. A retest of 1.29 as resistance by way of a H1 or H4 bearish candlestick signal would be optimal, identifying seller intent and also providing entry/risk parameters to work with.
Today’s data points: US Core PCE Price Index m/m; US Personal Spending m/m.
AUD/USD:
Weekly gain/loss: -1.56%
Weekly close: 0.7035
Weekly perspective:
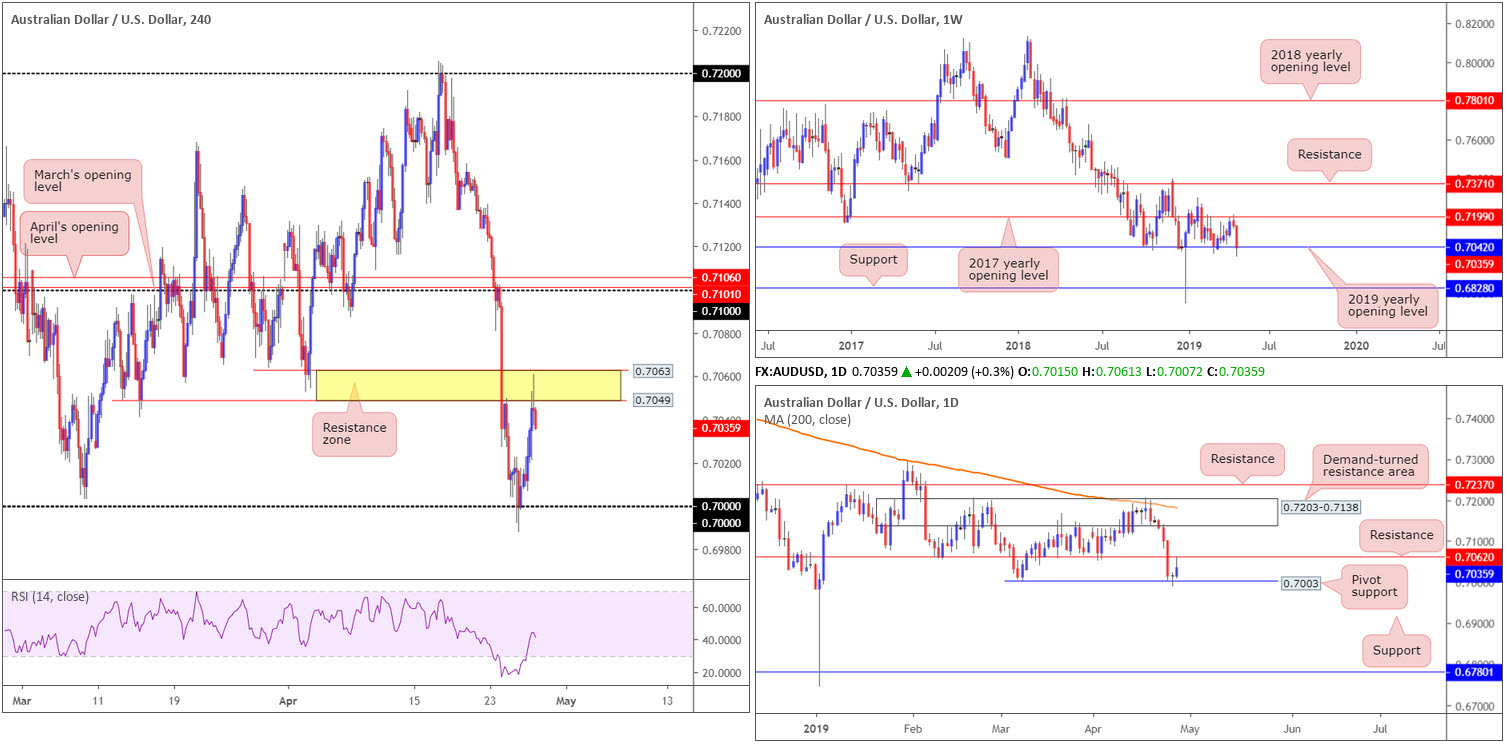
Following a modest response off the 2017 yearly opening level at 0.7199 two weeks back, the commodity currency snowballed south in recent sessions. In terms of structure, price action marginally engulfed the 2019 yearly opening level at 0.7042, though the break is unlikely enough to entice breakout sellers into the market owing to the levels historical significance as support.
Daily perspective:
Wednesday’s activity witnessed a strong break of support at 0.7062 take shape, ultimately exposing a pivot support resting around 0.7003. As you can see, this level held Thursday and forced a retest of 0.7062 as resistance into the week’s close.
Technically, whether we break 0.7003 or 0.7062 is difficult to judge. With weekly buyers likely not done off the 2019 yearly opening level at 0.7042 on the weekly timeframe, nevertheless, a break north could be in store.
H4 perspective:
Key figure 0.70 offered the market a ‘floor’ Thursday, with price action building on gains Friday on the back of a waning US dollar, despite a GDP beat.
Upside momentum diminished as the candles entered US trade, capped by a resistance zone pencilled in between 0.7063/0.7049 (yellow). This area is particularly significant, comprised of two Quasimodo support-turned resistances, levels which, statistically, have a high probability of holding – even more so when merging with daily resistance at 0.7062.
Areas of consideration:
In spite of both H4 and daily structure underscoring strong resistance, weekly has support in sight. In light of Friday’s closing candle on the H4 timeframe printing a near-full-bodied formation, however, short-term selling from current price is likely to develop, at least until realising 0.70. Aggressive sellers might position stops above Friday’s (H4) closing candle high (0.7046), while conservative sellers likely have above 0.7063 in mind.
Do also bear in mind a sell at current price effectively places the position against potentially weekly buying; therefore strict trade management is a MUST.
Today’s data points: US Core PCE Price Index m/m; US Personal Spending m/m.
USD/JPY:
Weekly gain/loss: -0.34%
Weekly close: 111.53
Weekly perspective:
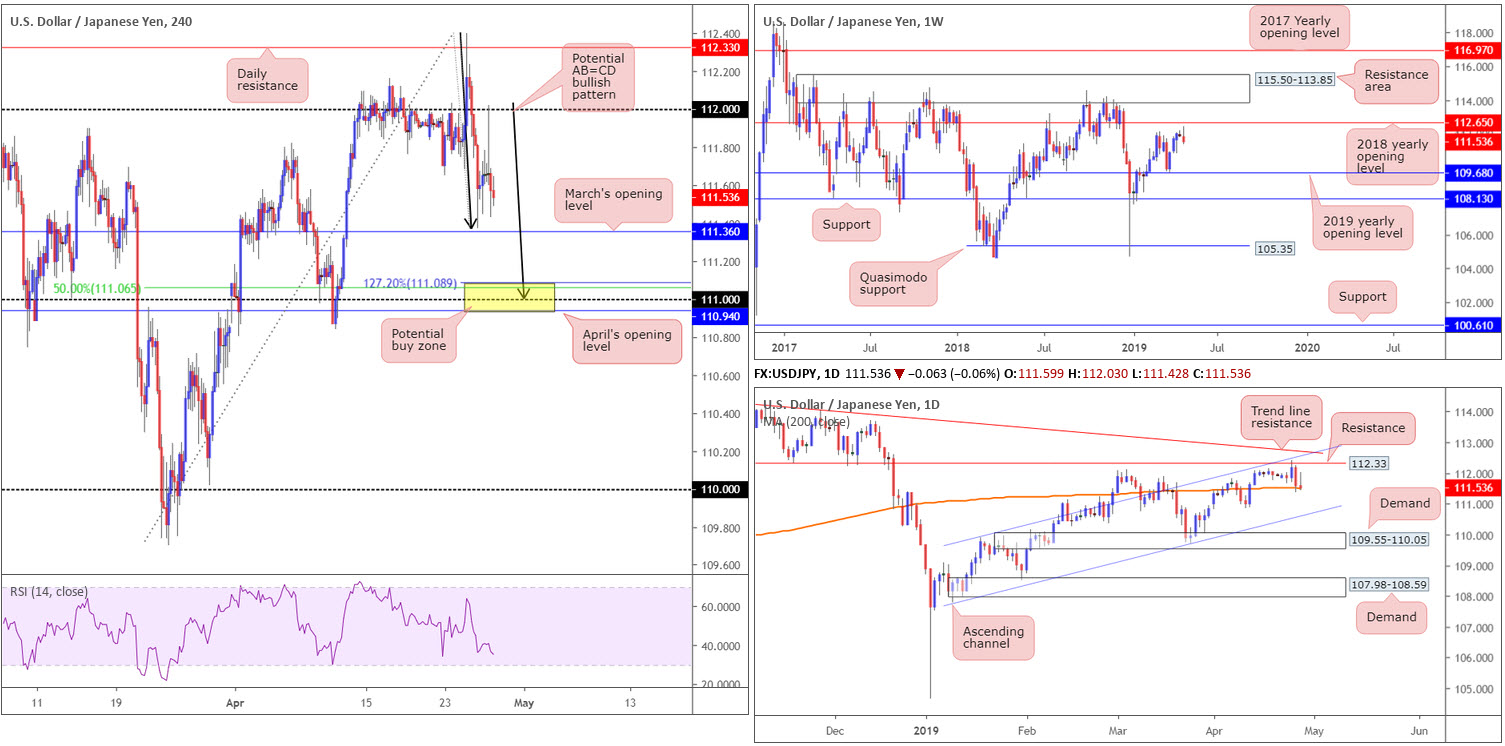
Leaving the 2018 yearly opening level at 112.65 unopposed last week, price turned lower and wrapped up the session forming a bearish pin-bar pattern. Further selling from this point is a possibility and has the 2019 yearly opening level at 109.68 to target. Traders may also want to note the long-standing resistance area positioned at 115.50-113.85, in the event we push for higher ground this week.
Daily perspective:
Mid-week trading observed a test of resistance at 112.33 form. This, by reason of the level fusing closely with a channel resistance drawn from the high 109.88 and a nearby trend line resistance etched from the high 114.54, was a noted level to watch for shorts in previous analysis. As is evident from the chart, buyers and sellers are clashing for position around the 200-day SMA (orange). Failure to offer support could lead to a move in the direction of channel support drawn from the low 107.77.
H4 perspective:
A brief look at Friday’s dealings on the H4 timeframe shows the unit aggressively spiked to a session high of 112.02 in response to stronger-than-expected US growth data. The move, nonetheless, was short lived as price failed to sustain gains above the 112 handle.
The next support target in sight comes in at 111.36, March’s opening level. Beyond here, the research team has eyes on the (yellow) 110.94/111.08 region (comprised of April’s opening level at 110.94, the round number 111, a 50.0% support value at 111.06 and a 127.2% AB=CD [black arrows] Fibonacci ext. point at 111.08).
Areas of consideration:
March’s opening level at 111.36 on the H4 timeframe remains a barrier worth keeping an eye on today, largely due to its connection with the 200-day SMA. A H4 or H1 bullish candlestick signal printed from 111.36 (entry and risk parameters can be determined according to this structure) is likely sufficient to draw in buyers and potentially retest the 112 region.
A push below 111.36, as mentioned above, has 110.94/111.08 on the hit list. Owing to its local H4 confluence this is also another area buyers may potentially reside this week. As round numbers are prone to fakeouts, traders may also wish to consider waiting for additional candlestick confirmation to form here before pulling the trigger.
Today’s data points: US Core PCE Price Index m/m; US Personal Spending m/m. Japanese banks are closed in observance of Showa Day.
USD/CAD:
Weekly gain/loss: +0.49%
Weekly close: 1.3455
Weekly perspective:
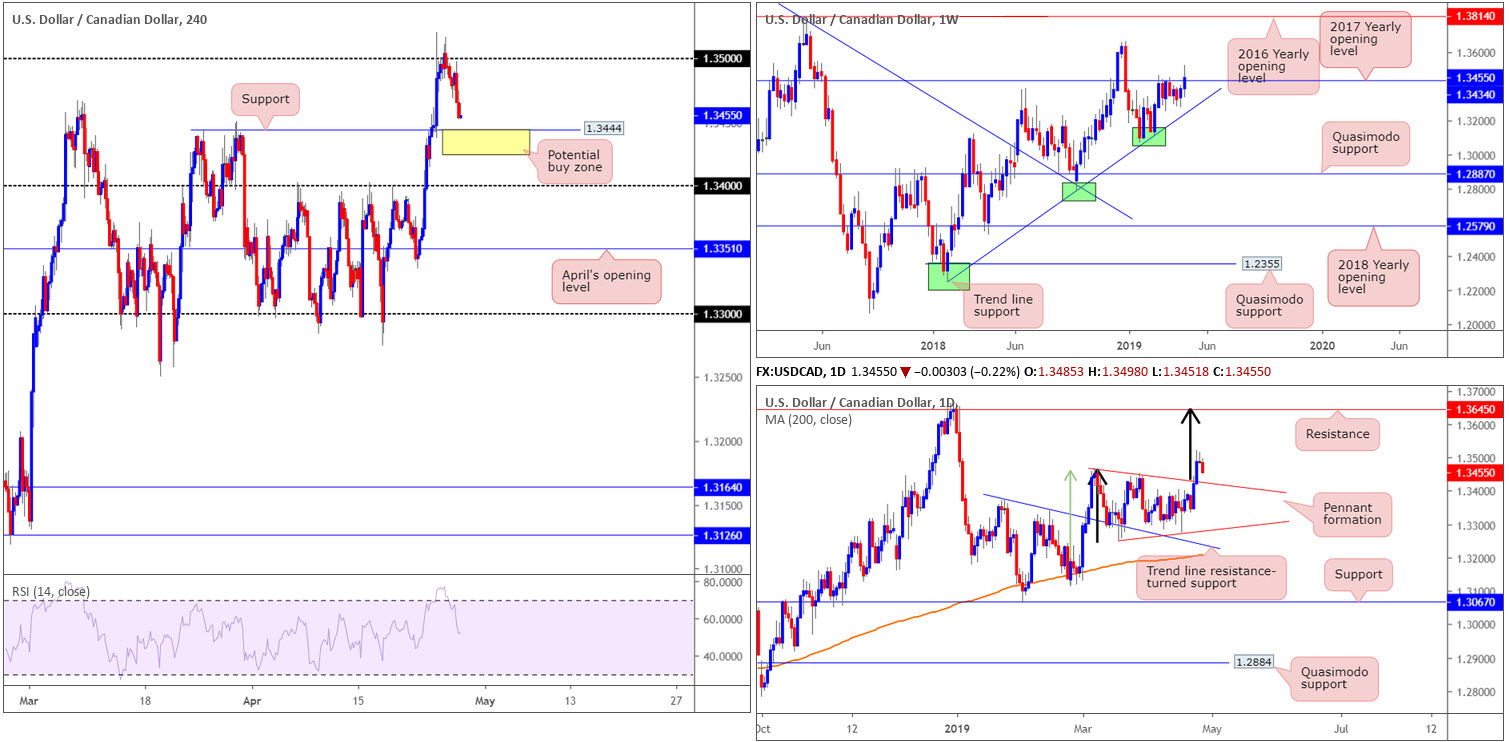
Longer-term flows broke out to the upside last week, conquering the 2017 yearly opening level at 1.3434, a barrier which held the unit lower by way of a tight consolidation since early March. Assuming buyers remain in the driving seat, this could eventually lead to a move materialising in the direction of the 2018 yearly high of 1.3664.
Daily perspective:
In addition to weekly position, daily action recently broke out of a symmetrical pennant formation. Traders are likely looking for this pattern to hit a take-profit target around resistance at 1.3645 (the T.P was calculated by adding the base distance to the breakout level [black arrows]). Another price target traders are likely eyeing is calculated by taking the distance from the beginning of the sharp move preceding the pennant to the first reversal within the formation and adding the value to the breakout price (green arrow).
As we head into a fresh week, though, it appears a retest of the top edge of the pennant could be in store.
H4 perspective:
USD/CAD movement eased beneath 1.35 Thursday as the US dollar struggled to sustain its upside presence. Friday, however, observed a near-retest of 1.35 as resistance before turning south. Following the initial surge to a fresh 2019 high of 98.33 (US dollar index) on the back of a US GDP beat, broad-based dollar selling emerged.
H4 flow, as is evident from the chart, ended the week hovering a few points north of support at 1.3444, a Quasimodo resistance-turned support. The important thing to consider here is the nearby 2017 yearly opening level seen on the weekly timeframe at 1.3434 and the top edge of the daily pennant coming in around the 1.3425 region (yellow).
Areas of consideration:
The yellow zone marked on the H4 timeframe between 1.3425/1.3444 is likely of interest for longs today/early week; the area echoes a strong cluster of confluence.
The only drawback to a buy from 1.3425/1.3444 is the possibility of price drawing lower to bring in buyers from the nearby psychological band 1.34. For that reason, traders are urged to consider waiting for additional candlestick confirmation before pressing the buy button (entry and risk can be determined according to this structure).
Today’s data points: US Core PCE Price Index m/m; US Personal Spending m/m.
USD/CHF:
Outlook unchanged due to lacklustre movement.
Weekly gain/loss: +0.55%
Weekly close: 1.0195
Weekly perspective:
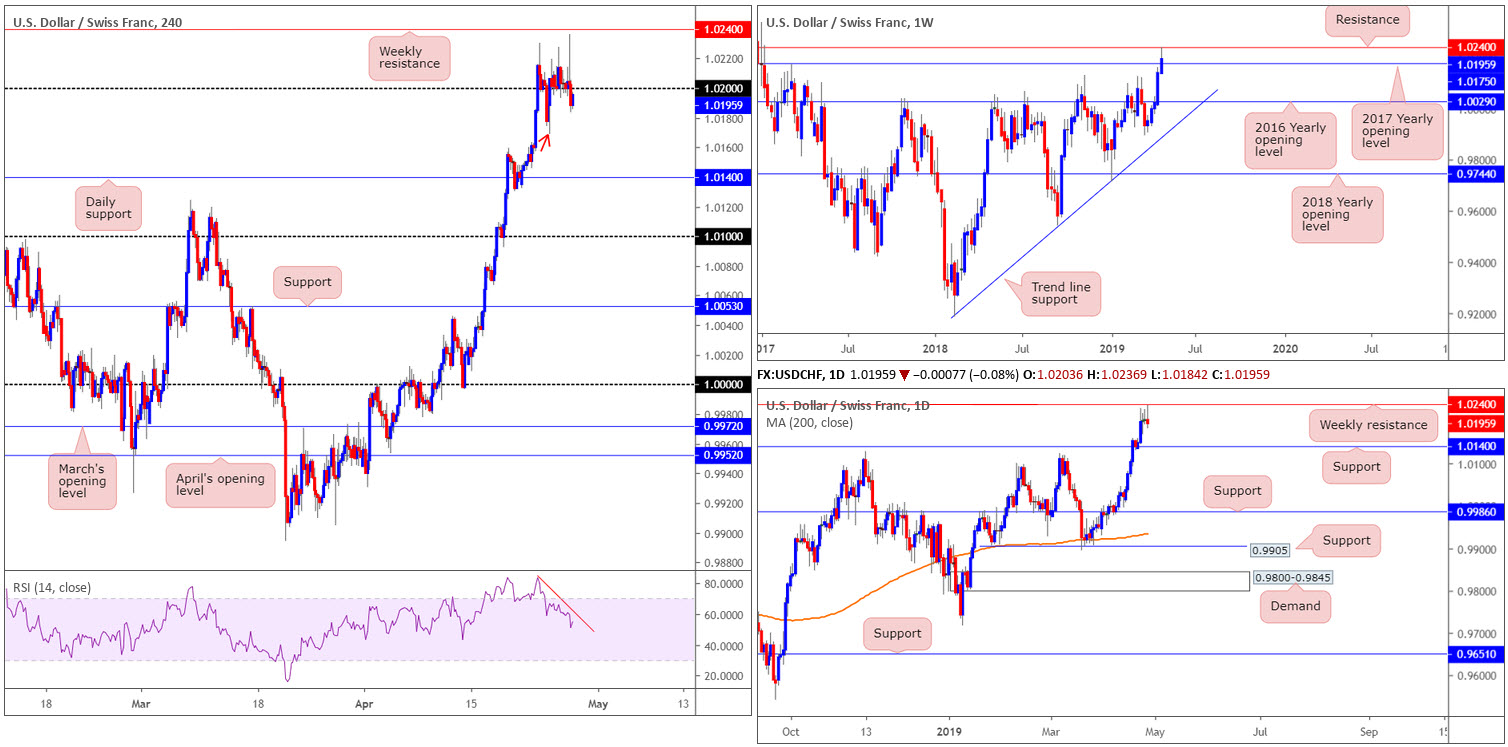
The 2017 yearly opening level at 1.0175 failed to offer the market much resistance last week, consequently lifting the USD/CHF to its fifth consecutive weekly gain and fresh 2019 highs, as well as opening the gates for a test of nearby resistance at 1.0240. This level boasts reasonably strong historical significance and could therefore entice sellers into the market this week.
Daily perspective:
Much the same as the weekly viewpoint, weekly resistance 1.0240 is in view, though instead of the 2017 yearly opening level at 1.0175 set as the next downside target, daily support comes in a little lower at 1.0140.
H4 perspective:
From Tuesday onwards, trading volume remained thin as the unit flipped between gains/losses around the 1.02 handle. Overhead, traders are urged to pencil in weekly resistance coming in at 1.0240 (also shown on the H4 chart), which could, technically, be the reason behind cautious buying above 1.02.
Friday wrapped up the week reclaiming 1.02 to the downside and is now set to potentially retest the the 2017 yearly opening level at 1.0175 on the weekly timeframe. Note this level was already retested as support on the H4 chart last Wednesday (red arrow). It might also interest some traders to note the RSI indicator is currently chalking up a strong divergence reading (red line).
Areas of consideration:
From a technical standpoint, the USD/CHF appears to be ‘caught between a rock and a hard place’. In other words, irrespective of the direction one selects, opposing structure is close by. A short in this market has you contending with possible support from the 2017 yearly opening level at 1.0175, and a long has you competing with nearby weekly resistance at 1.0240. Granted, a long from above 1.02 has 40-points of wiggle room to play with, though given the lacklustre buying seen around this neighbourhood of late, it’s a chancy move. With that being the case, the research team’s initial outlook stands: neither a long nor short seems attractive at this time.
Today’s data points: US Core PCE Price Index m/m; US Personal Spending m/m.
Dow Jones Industrial Average:
Weekly gain/loss: -0.30%
Weekly close: 26467
Weekly perspective:
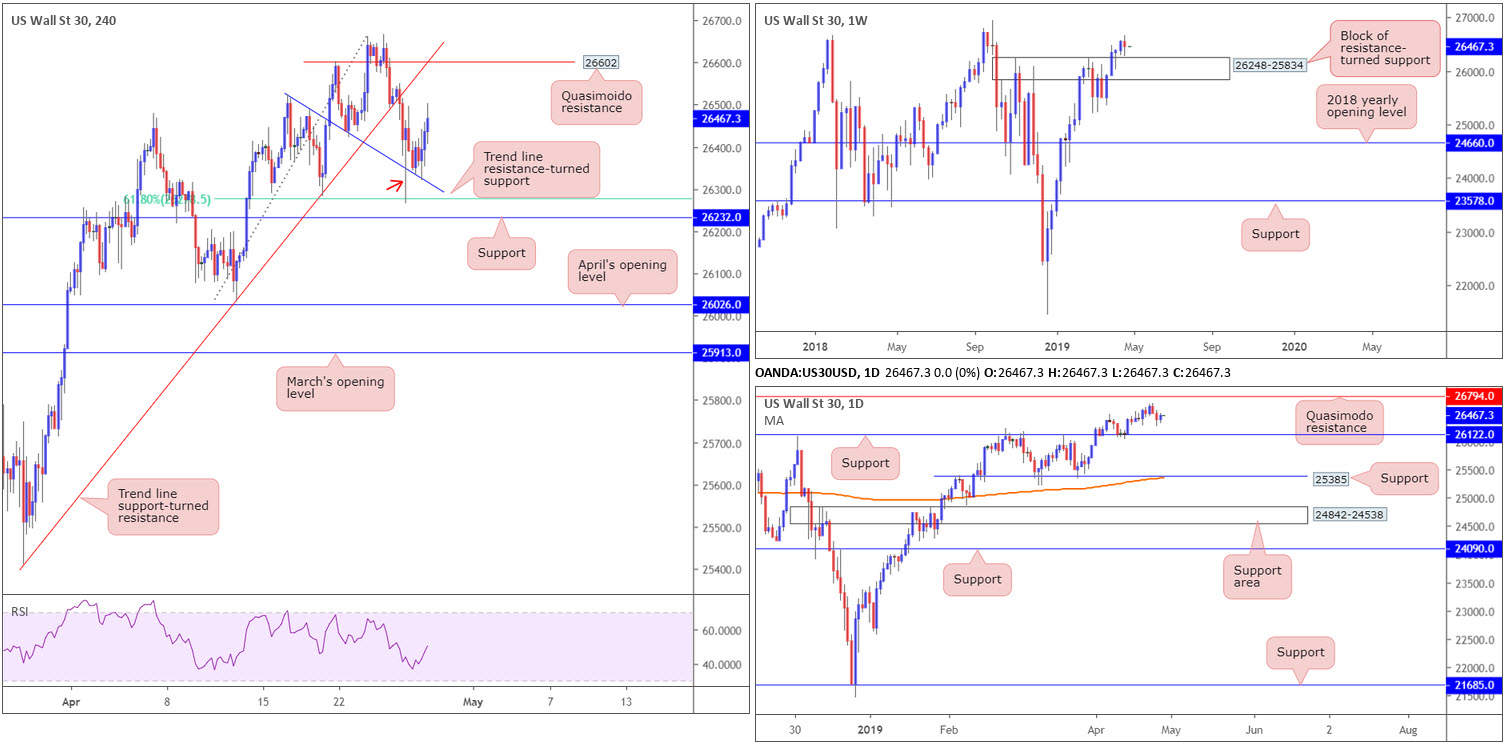
In the shape of a bearish engulfing configuration, the Dow Jones Industrial Average settled the week lower, down 80 points. While candlestick traders may consider this a bearish signal, it is worth noting the formation printed just north of a block of resistance-turned support at 26248-25834.
Should our technical reading prove accurate, the next port of call to the upside on this timeframe can be seen around the all-time high of 26939.
Daily perspective:
Located within the top region of the current support zone on the weekly timeframe, daily structure displays support at 26122. To the upside, however, a Quasimodo resistance is present at 26794.
A break beyond the current support this week has another layer of support to target at 25385, which happens to merge closely with the 200-day SMA (orange).
H4 perspective:
Friday’s action eked out a gain, but ended the week slightly lower. The S&P 500 ended the day adding 0.47%, while the tech-heavy Nasdaq Composite chalked up marginal gains of 0.12%.
The market’s latest milestones came as investors weighed a mixed bag of corporate earnings. The market also drew encouragement from Friday’s GDP beat.
Technically, Friday’s advance was supported by a trend line resistance-turned support taken from the high 26525. Further buying this week has a Quasimodo resistance in view at 26602 that’s merging with a trend line support-turned resistance drawn from the low 25410.
Areas of consideration:
With the current H4 trend line resistance-turned support in play, along with a H4 61.8% Fibonacci support at 26280 and the nearby resistance-turned support area on the weekly timeframe at 26248-25834 also in the mix, further upside could take shape this week.
Traders may already be long this market on the back of the goodish H4 pin-bar pattern (red arrow). The first logical take-profit target from here is the H4 Quasimodo resistance mentioned above at 26602.
Today’s data points: US Core PCE Price Index m/m; US Personal Spending m/m.
XAU/USD (GOLD):
Weekly gain/loss: +0.81%
Weekly close: 1285.8
Weekly perspective:
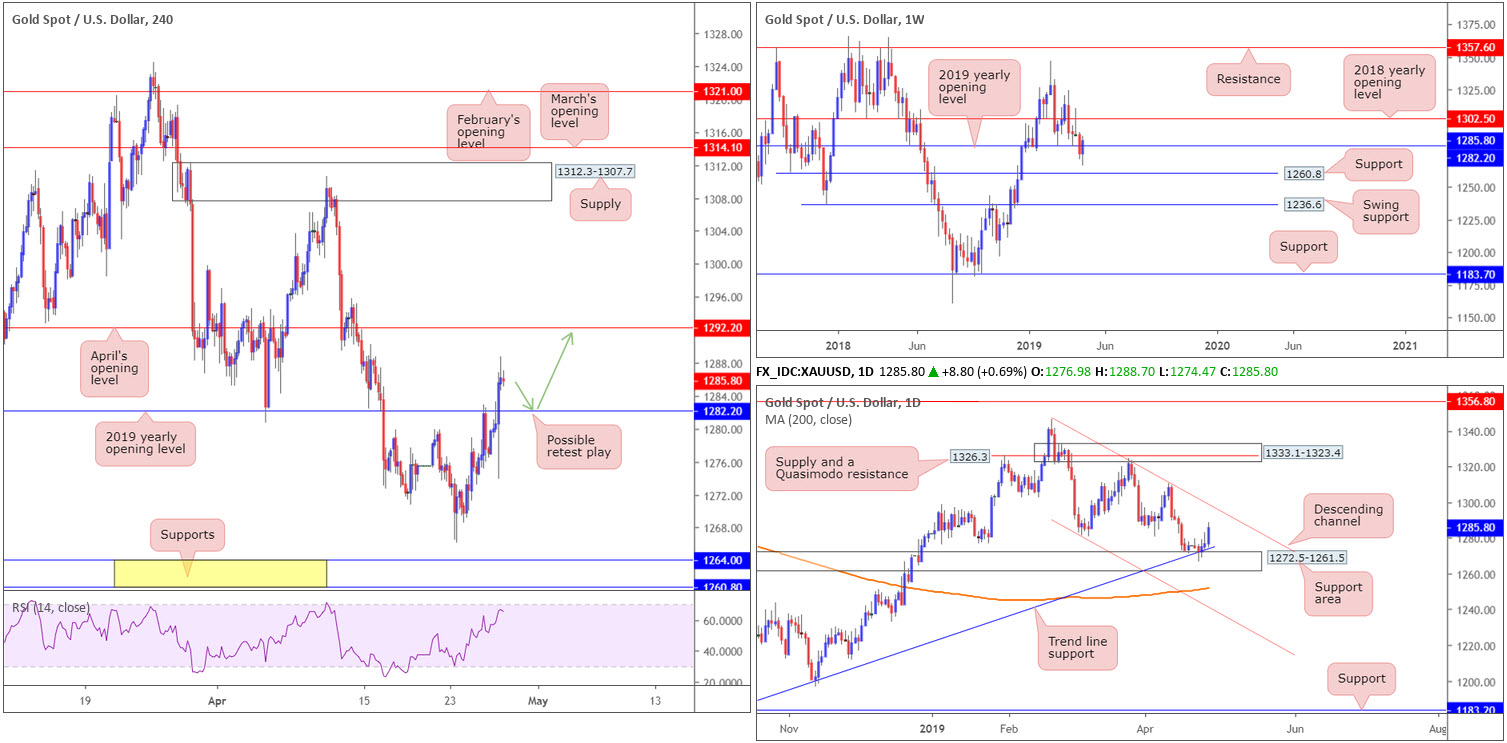
Over the course of last week’s sessions, bullion added more than $10 of value and reclaimed a large portion of the prior week’s losses. What’s also interesting from a technical perspective is the yellow metal climbed back above its 2019 yearly opening level at 1282.2, potentially setting the stage for additional upside this week towards the 2018 yearly opening level at 1302.5.
Daily perspective:
The support area marked at 1272.5-1261.5 on the daily timeframe, which happened to unite with a trend line support taken from the low 1160.3, held the market higher last week. The next upside target from current price rests at a channel resistance drawn from the high 1346.7.
H4 perspective:
Having witnessed the US dollar index fail to capitalise on Friday’s upbeat growth reading, the price of gold on the H4 timeframe overthrew the 2019 yearly opening level at 1282.2, as already highlighted on the weekly timeframe. Above this barrier on the H4 timeframe, though, traders’ crosshairs are likely fixed on April’s opening level at 1292.2.
Areas of consideration:
In view of the H4 close above 1282.2, a retest of this level (preferably in the shape of a H4 bullish candlestick pattern – entry and risk can be determined according to this pattern) as support could take form today/early week, prompting further buying towards April’s opening level at 1292.2, followed by the daily channel resistance highlighted above.
The accuracy, completeness and timeliness of the information contained on this site cannot be guaranteed. IC Markets does not warranty, guarantee or make any representations, or assume any liability with regard to financial results based on the use of the information in the site.
News, views, opinions, recommendations and other information obtained from sources outside of www.icmarkets.com.au, used in this site are believed to be reliable, but we cannot guarantee their accuracy or completeness. All such information is subject to change at any time without notice. IC Markets assumes no responsibility for the content of any linked site. The fact that such links may exist does not indicate approval or endorsement of any material contained on any linked site.
IC Markets is not liable for any harm caused by the transmission, through accessing the services or information on this site, of a computer virus, or other computer code or programming device that might be used to access, delete, damage, disable, disrupt or otherwise impede in any manner, the operation of the site or of any user’s software, hardware, data or property.


