
Key risk events today:
ECB President Lagarde Speaks.
(Previous analysis as well as outside sources – italics).
EUR/USD:
Weekly gain/loss: -1.77%
Weekly close: 1.1627
Weekly perspective:
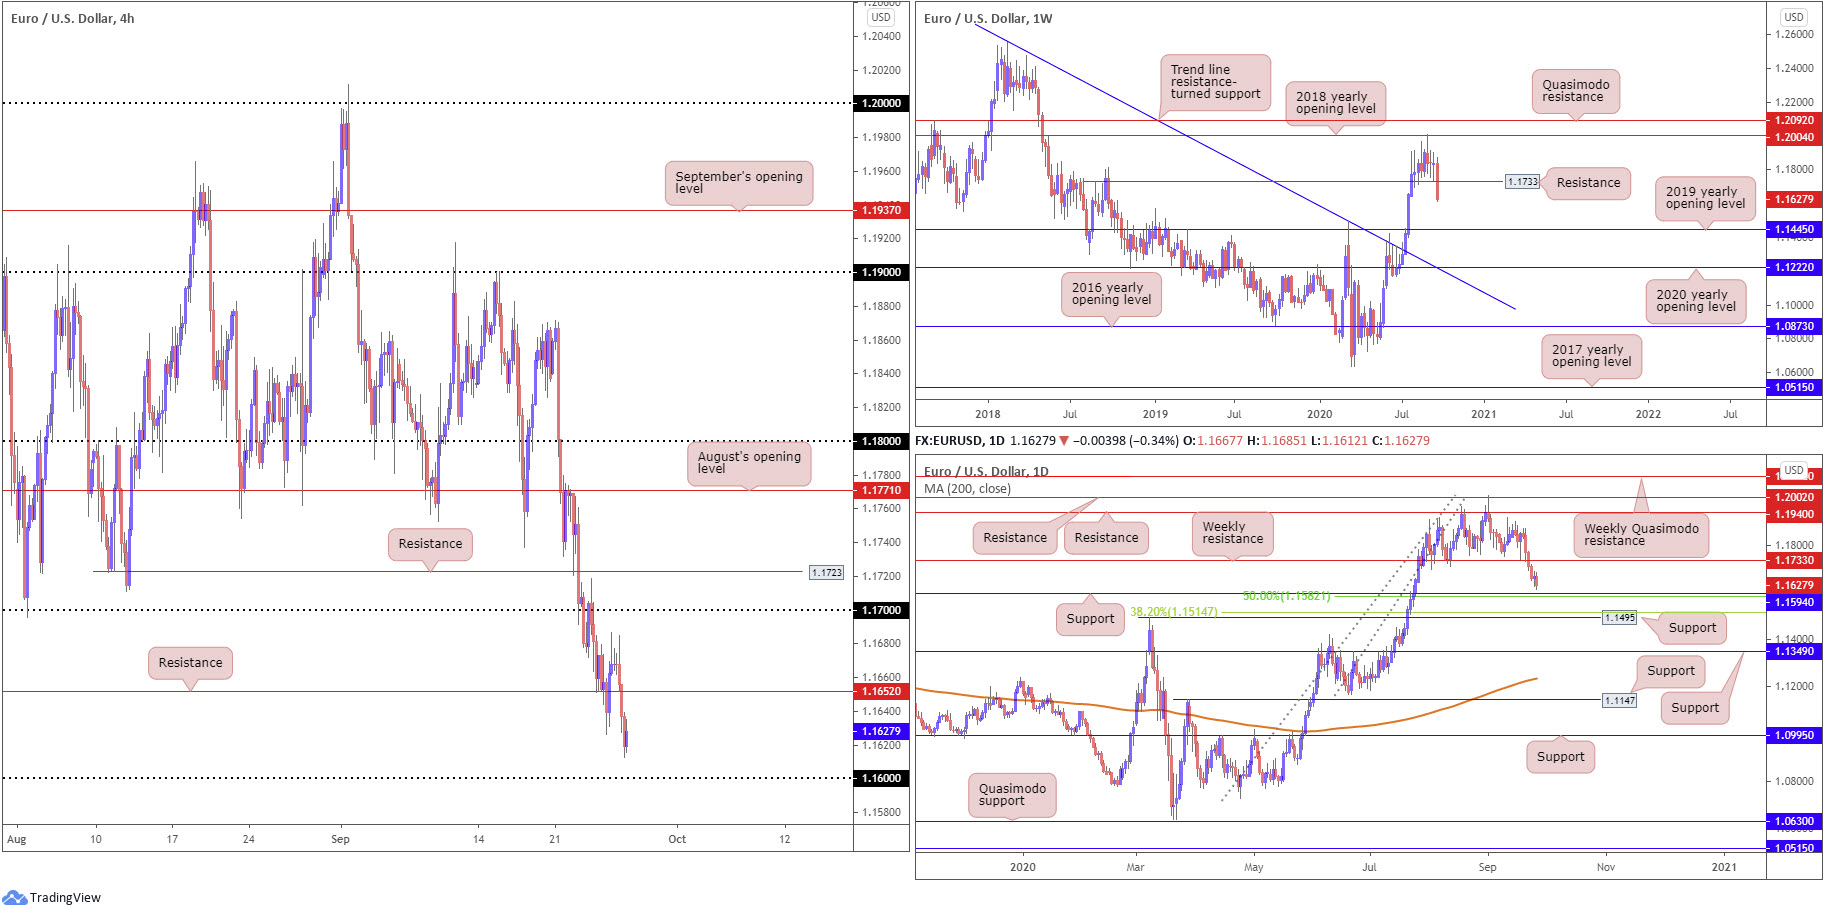
Down more than 200 points, support at 1.1733, a prior Quasimodo resistance level, came under strong fire last week (now marked as resistance). The pair finished the week grasping session lows, shining the technical spotlight on the 2019 yearly opening level at 1.1445 as the next obvious support target.
Consequently, an extension to the downside this week is a possibility.
Daily perspective:
Last week’s downward pressure could have EUR/USD knocking on the door of daily support this week at 1.1594, coinciding with a 50.00% retracement ratio at 1.1582.
Beyond the aforementioned levels, the pair also faces possible support from 1.1495 (March 9 high), complemented by a 38.2% Fibonacci retracement ratio at 1.1514.
H4 perspective:
Four out of five trading sessions finished higher on the US dollar index last week, with Friday extending to peaks at 94.74. Increased USD demand, despite US durable goods orders expanding less than expected in August, directed EUR/USD to fresh weekly lows at 1.1612 Friday.
Support emerging off the 1.16 handle is not out of the Question this week; resistance at 1.1652 is also an area traders could work with. Focus also likely remains on the 1.17 handle, sheltered by a resistance level at 1.1723 (previous Quasimodo support).
Areas of consideration:
While the weekly timeframe exhibits scope to explore lower levels this week, brushing aside daily support at 1.1594 (and nearby 50.00% retracement at 1.1582) could prove troublesome. As a result, bullish scenarios may surface off 1.16 on the H4. How much of a bounce we’ll see from here is difficult to judge, owing to the weekly timeframe threatening to move lower.
Overthrowing 1.16, on the other hand, opens the door to possible bearish setups, targeting H4 Quasimodo support at 1.1563, followed by the 1.15 handle, a level sharing space with daily support mentioned above at 1.1495.
GBP/USD:
Weekly gain/loss: -1.34%
Weekly close: 1.2740
Weekly perspective:
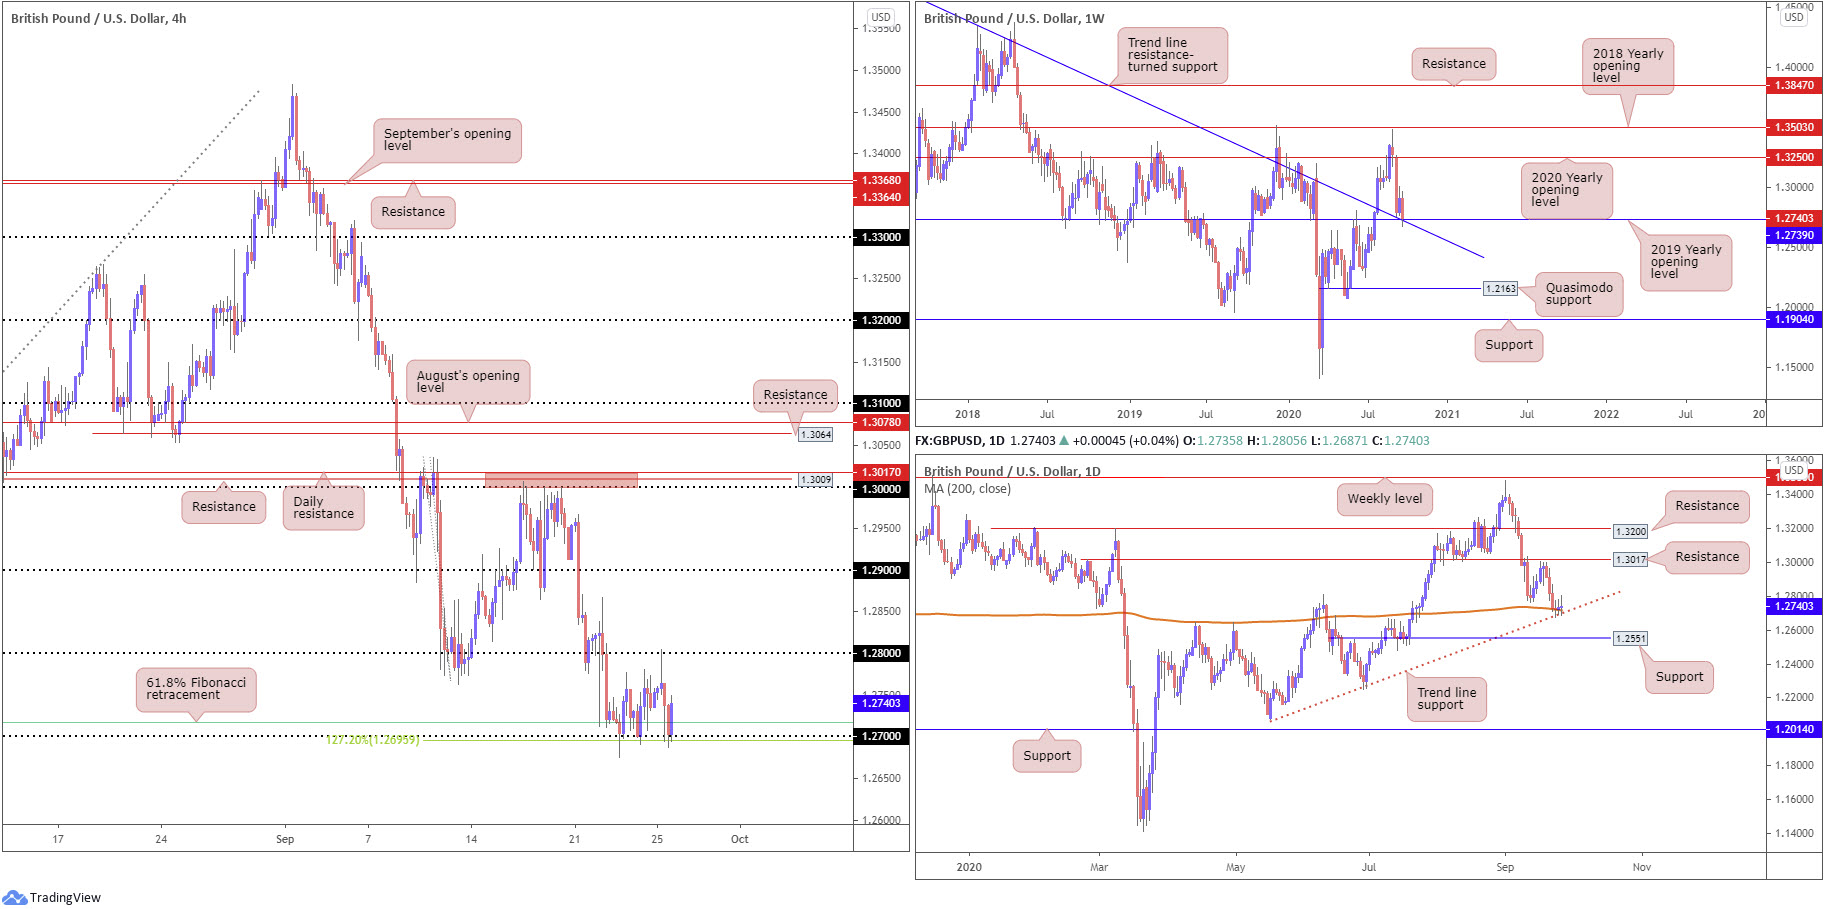
Sterling finished the week down nearly 180 points, erasing prior gains and shaking hands with support at 1.2739, a 2019 yearly opening value. Technicians will acknowledge the level also merges with trend line resistance-turned support, extended from the high 1.5930.
A rebound this week has room to advance as far north as the 2020 yearly opening value at 1.3250. Yet, crossing through 1.2739 registers a bearish setting, with the 1.2251 June 29 low targeted, closely shadowed by Quasimodo support priced in at 1.2163.
Daily perspective:
Mid-week, as seen from the daily timeframe, crossed swords with the 200-day SMA (orange – 1.2717) and joining trend line support, extended from the low 1.2075.
Despite weekly support reinforcing the daily levels, a recovery is proving difficult, demonstrated by way of three back-to-back candles finishing off session peaks. Failure to hold current support shifts support at 1.2551 into the light.
H4 perspective:
The US dollar index delivered healthy upside Friday (directing focus on 95.00), despite US equities staging a rebound going into the US session.
H4, as you can see on GBP/USD, holds the 1.27 handle and converging 61.8% Fibonacci retracement at 1.2718, aided by a 127.2% Fibonacci extension point at 1.2695.
Strengthened on the back of USD demand, however, the 1.28 handle is proving a tough resistance to crack.
Areas of consideration:
The reaction from 1.27 (and Fibonacci confluence) is (technically) unsurprising on the H4, having noted support also emerging from higher timeframes. This implies buyers still have a hand in this fight, despite currently lacking the firepower to oust 1.28.
Assuming 1.27 remains intact this week, and daily resistance on the DXY at 94.65 holds (March 9 low), a H4 bullish candlestick developing from the round number could attract buying. Rupturing 1.28 also advertises further upside could be on the cards, targeting at least the 1.29 handle.
AUD/USD:
Weekly gain/loss: -3.65%
Weekly close: 0.7023
Weekly perspective:
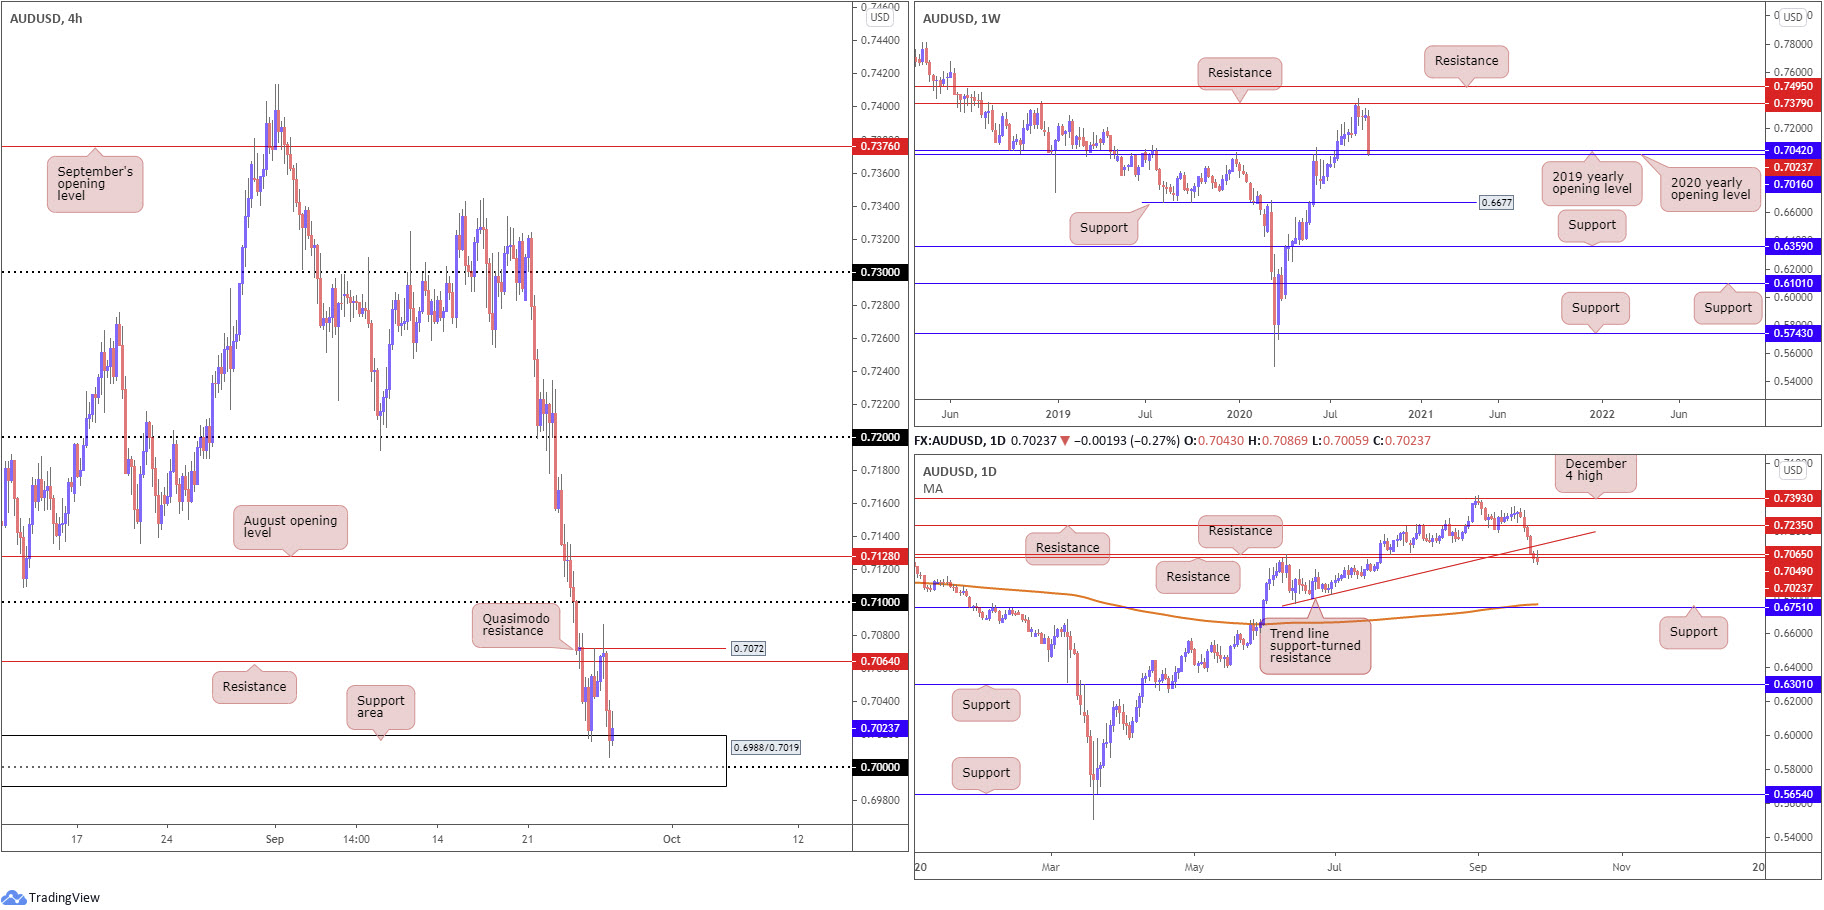
Against the US dollar, the Australian dollar wiped out more than 250 points and concluded the week around session lows, consequently establishing a near-full-bodied bearish candle.
As a result of recent selling, the 2020 and 2019 yearly opening values at 0.7016 and 0.7042, respectively, made an appearance. Should the market fail to derive some much-needed respite from the noted levels this week, this suggests scope towards support priced in at 0.6677.
Daily perspective:
Tumbling through trendline support, extended from the low 0.6776, subsequently saw the pair take on two support levels at 0.7049 and 0.7065.
While weekly price tests support, the outlook on the daily timeframe reflects a bearish stance, with room to reach for support at 0.6751 and the 200-day SMA (orange – 0.6772).
H4 perspective:
The support zone at 0.6988/0.7019, which contains the key figure 0.70 and the 2020 yearly opening level at 0.7016 on the weekly timeframe, is currently in play on the H4 timeframe.
To the upside, buyers must contend with resistance at 0.7064 and a Quasimodo resistance at 0.7072. Given these levels are closely positioned to daily resistances at 0.7049 and 0.7065, and the H4 support area includes weekly support, a range could develop early week.
Areas of consideration:
Buyers and sellers are likely to continue battling for position between the H4 support area at 0.6988/0.7019 and H4 resistances at 0.7072/0.7064 in the early stages of the week, potentially interesting range traders.
In terms of the trend, we’ve faced a northerly trajectory since mid-March. This, coupled with weekly support around 0.7016, places a question mark on selling and could eventually stir a range breakout (H4) to the upside and head for 0.71 (H4). Consequently, buyers could make a stand out of the current H4 support area in early trading.
USD/JPY:
Weekly gain/loss: +0.96%
Weekly close: 105.55
Weekly perspective:
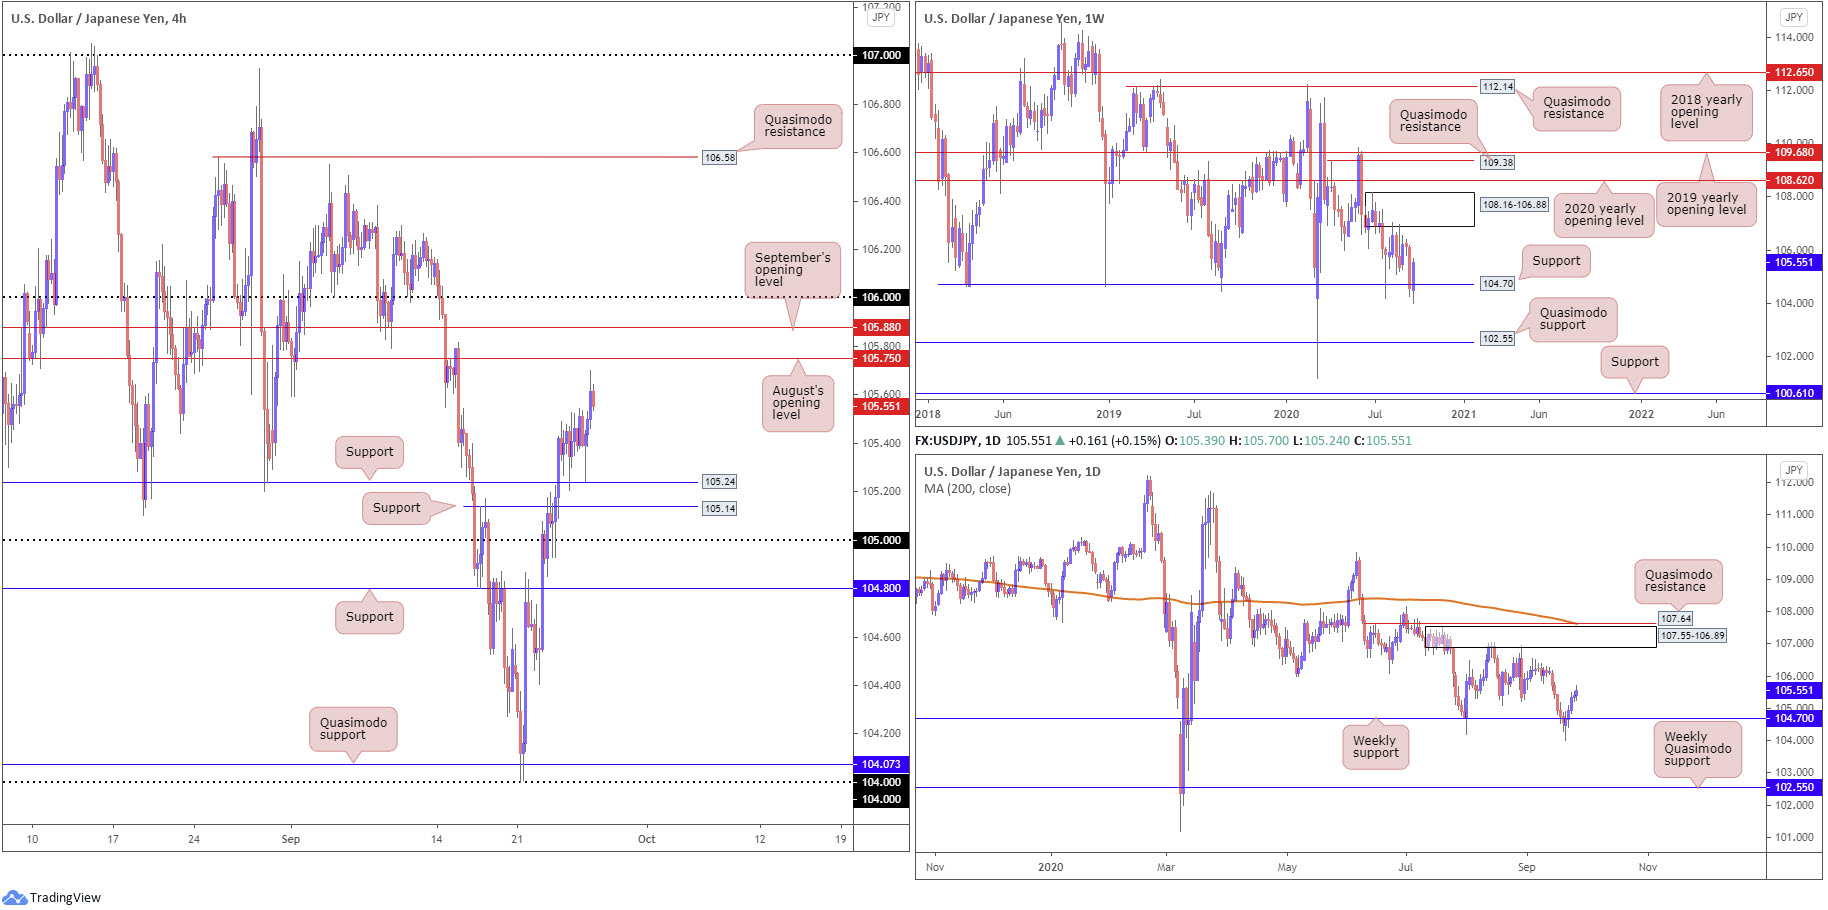
Supply at 108.16-106.88 remains prominent, capping upside since price made its way off support at 104.70 at the end of July.
As evident from the weekly chart, the pair recently retested the 104.70 support. Although tumbling to lows at 104.00, the unit regained a strong footing above the aforementioned support last week, adding 100 points.
While additional upside is perhaps the favoured course this week, Quasimodo support at 102.55 offers a feasible target beyond current support in the event we turn south.
Daily perspective:
Supply at 107.55-106.89, an area housed within the lower boundary of weekly supply mentioned above at 108.16-106.88, has proved tough to takeover.
The recovery from weekly support at 104.70 over the course of last week, fashioned by way of five consecutive daily bullish candles, highlights the possibility of readdressing the aforementioned supply. Of note, we can see the daily area also benefits from nearby Quasimodo resistance at 107.64 and the 200-day SMA (orange – 107.62).
H4 perspective:
Bolstered on the back of the DXY pushing for 95.00, Friday extended recovery gains forged off support at 105.24.
For those who read Friday’s technical briefing you may recall the following (italics):
Those long the 105.24 retest (a noted move to watch for in recent analysis) are likely looking for the currency pair to reach for August’s opening value at 105.75, with a break throwing September’s opening value at 105.88 and the 106 handle into the mix.
Interestingly, Friday closed out the week mildly paring gains within striking distance of August’s opening value.
Areas of consideration:
Weekly support at 104.70 elbowing its way back into the spotlight, together with both the weekly and daily timeframes displaying room to reach 107ish (the underside of weekly/daily supply [106.88/89), underpins the possibility of further buying materialising north of 106 this week. Above here, resistance appears limited until crossing paths with Quasimodo resistance at 106.58, with a break exposing the 107 handle (and the lower edges of higher timeframe supply).
USD/CAD:
Weekly gain/loss: +1.41%
Weekly close: 1.3384
Weekly perspective:
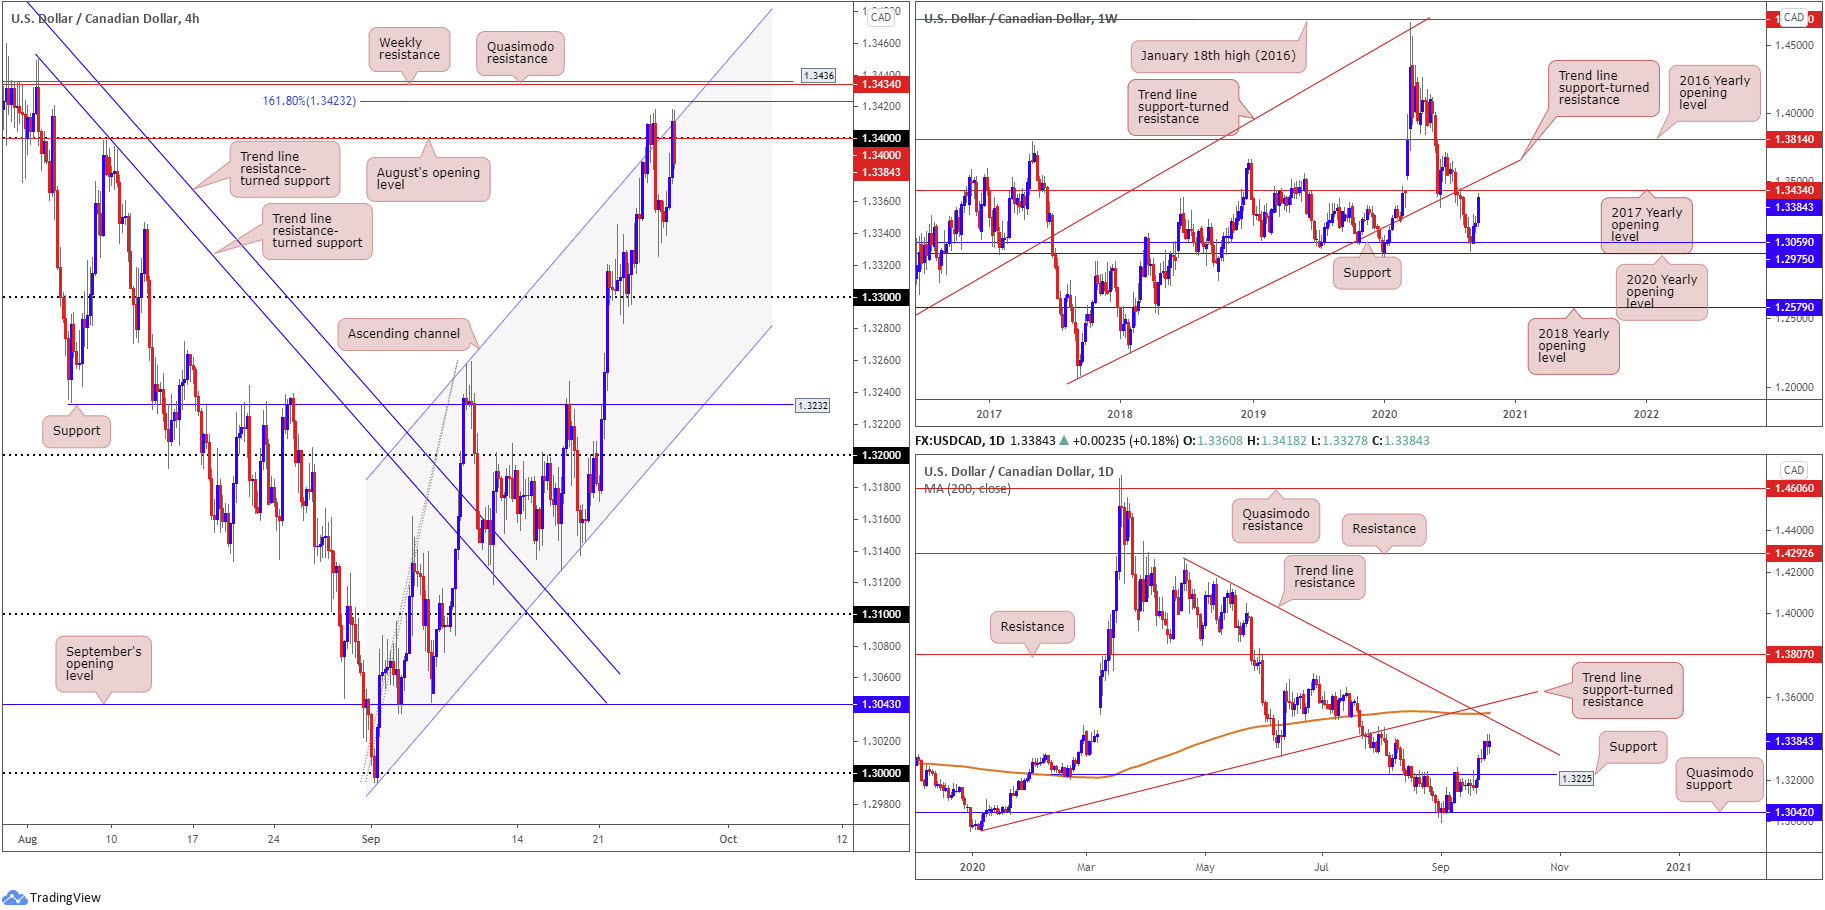
The US dollar made considerable ground against its Canadian counterpart last week, extending recovery gains off support at 1.3059 (pinned just north of the 2020 yearly opening value at 1.2975) and adding nearly 200 points.
Overhead, the 2017 yearly opening value at 1.3434 (resistance) is visible, therefore a pullback could arise should we challenge the aforementioned area in early trading. Brushing aside the level, however, throws trend line support-turned resistance, taken from the low 1.2061, into the mix.
Daily perspective:
On the daily timeframe, resistance is not expected to make an appearance until trend line resistance, etched from the high 1.4265, which happens to align closely with the 200-day SMA (orange – 1.3523). Also in close view is trend line support-turned resistance, taken from the low 1.2957.
While the above hints at the possibility of follow-through buying this week, a pullback, perhaps caused by weekly resistance at 1.3434, to 1.3225 support is also a scenario worth monitoring.
H4 perspective:
WTI prices concluded Friday unmoved around $40.00 a barrel. The US dollar index, on the other hand, clocked fresh weekly pinnacles and hauled USD/CAD back to 1.34 and August’s opening value, two levels that merge closely with channel resistance, taken from the high 1.3257.
Interestingly, directly above 1.34 lies an area of notable resistance, consisting of a 161.8% Fibonacci extension point at 1.3423, weekly resistance at 1.3434 (2017 yearly opening level) and Quasimodo resistance at 1.3436.
Areas of consideration:
The fact we’re closing in on weekly resistance at 1.3434, surrounded by a H4 Quasimodo resistance level at 1.3436 and a 161.8% H4 Fibonacci extension at 1.3423, buyers may not have the firepower to take these resistances down this week.
With this in mind, a H4 close back under 1.34, off the noted resistances, is likely to spur sellers, targeting at least the 1.33 handle on the H4.
USD/CHF:
Weekly gain/loss: +1.91%
Weekly close: 0.9286
Weekly perspective:
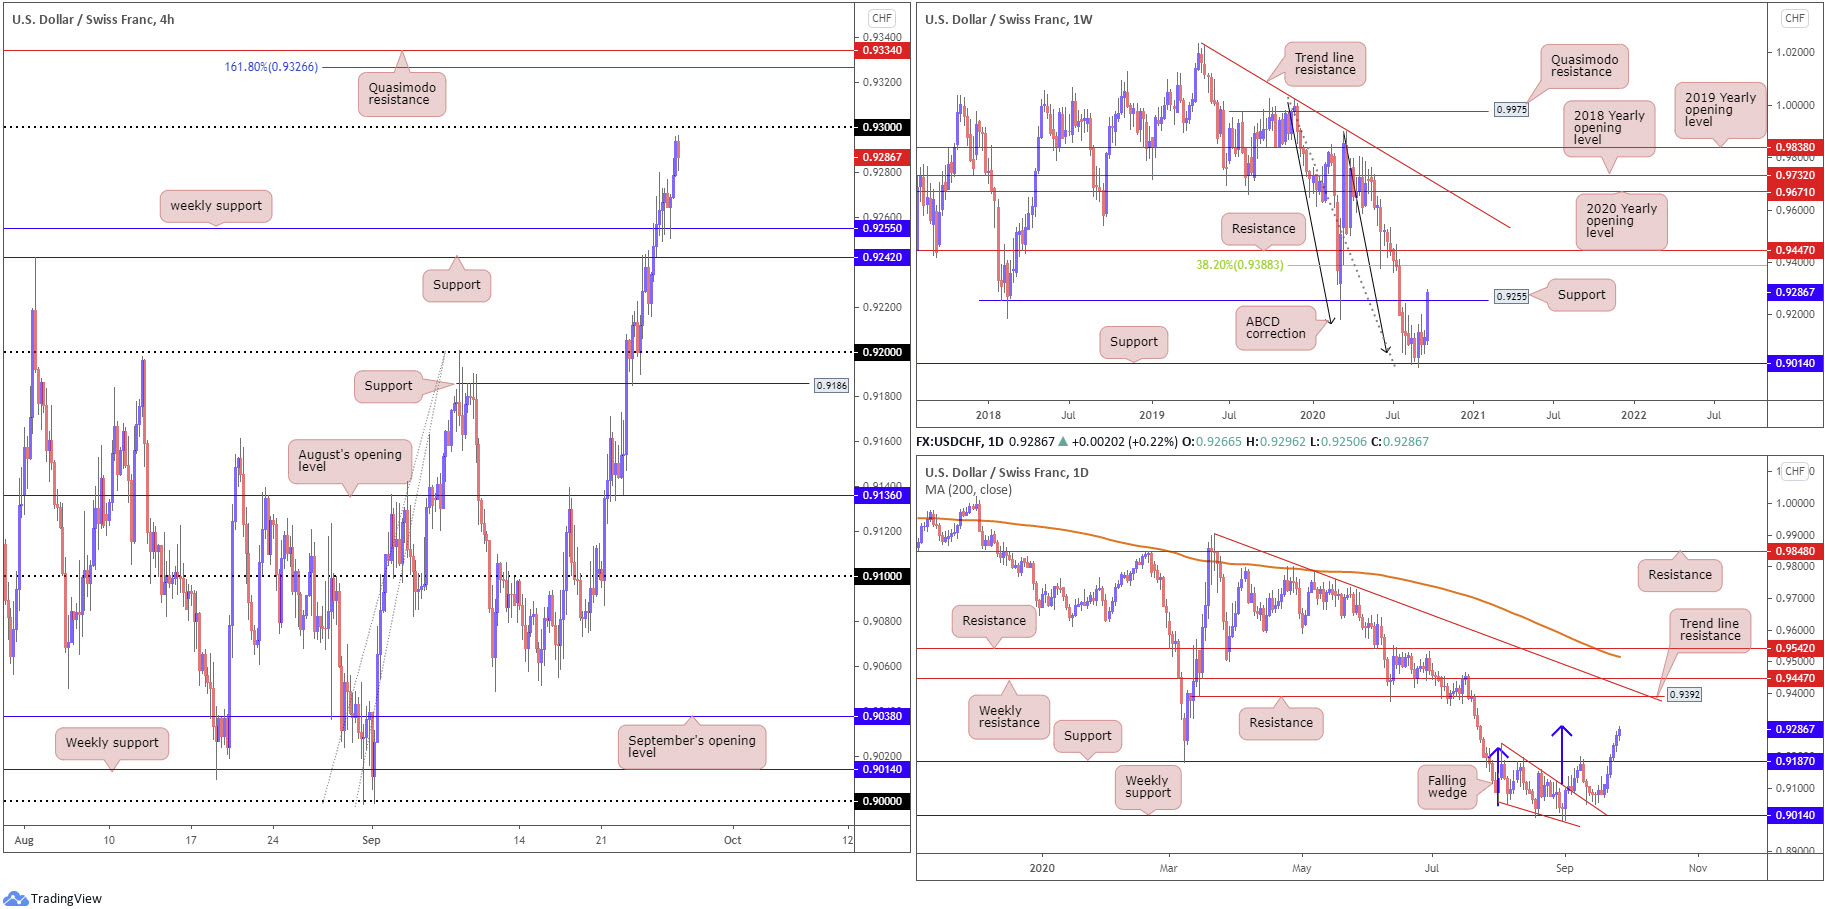
Despite a phase of indecisiveness off support at 0.9014, price action staged an impressive recovery north of the level last week, potentially gleaning additional impetus from ABCD support at 0.9051 (black arrows).
Resistance at 0.9255 (a previous Quasimodo support level) put up little fight, as the pair reached for highs at 0.9296. This positions current longs in a favourable situation this week; the next upside target is not seen until the 38.2% Fibonacci retracement ratio at 0.9388, a common take-profit target out of ABCD patterns (derived from legs A-D).
Daily perspective:
From the daily timeframe, the beginning of September observed the upper border of a falling wedge pattern (drawn from the high 0.9241 and a low of 0.9056) give way, consequently unlocking a bullish reversal signal. Although resistance at 0.9187 initially put a lid on gains, buyers regained consciousness after retesting the falling wedge and recently engulfed the aforementioned resistance level. Breaking through weekly resistance at 0.9255 last week, as you can see, guided the currency pair towards the daily falling wedge take-profit target (blue arrows) at 0.9297.
H4 perspective:
After retesting weekly support at 0.9255, upside gained speed Friday to top just ahead of the 0.93 psychological handle, conveniently aligning with the daily falling wedge take-profit target at 0.9297. Breaking beyond 0.93, as the weekly timeframe suggests, shines the spotlight on a Quasimodo resistance level at 0.9334, sited just north of a 161.8% Fibonacci extension point at 0.9326.
Areas of consideration:
For those who read Friday’s technical briefing you may recall the following (italics):
Some traders will interpret H4 action retesting weekly resistance at 0.9255 (as support) as a sign we might be heading for higher terrain, and look to secure bullish positions off the weekly base. The next upside target beyond the weekly resistance level is the daily falling wedge take-profit target at 0.9297, converging with the next upside target on the H4: the 0.93 handle.
Those currently long off 0.9255 have likely reduced risk to breakeven and banked partial profits heading into the week’s end. With the weekly timeframe indicating further buying, any reaction off 0.93 is unlikely to be anything to write home about. As a result, a H4 close above 0.93 might be on the cards this week, a move likely to encourage buying to the 161.8% H4 Fibonacci extension point at 0.9326 and H4 Quasimodo resistance at 0.9334. Additional buying to the 38.2% Fibonacci retracement ratio at 0.9388 on the daily timeframe is also certainly not out of the question.
Dow Jones Industrial Average:
Weekly gain/loss: -2.05%
Weekly close: 27158
Weekly perspective:
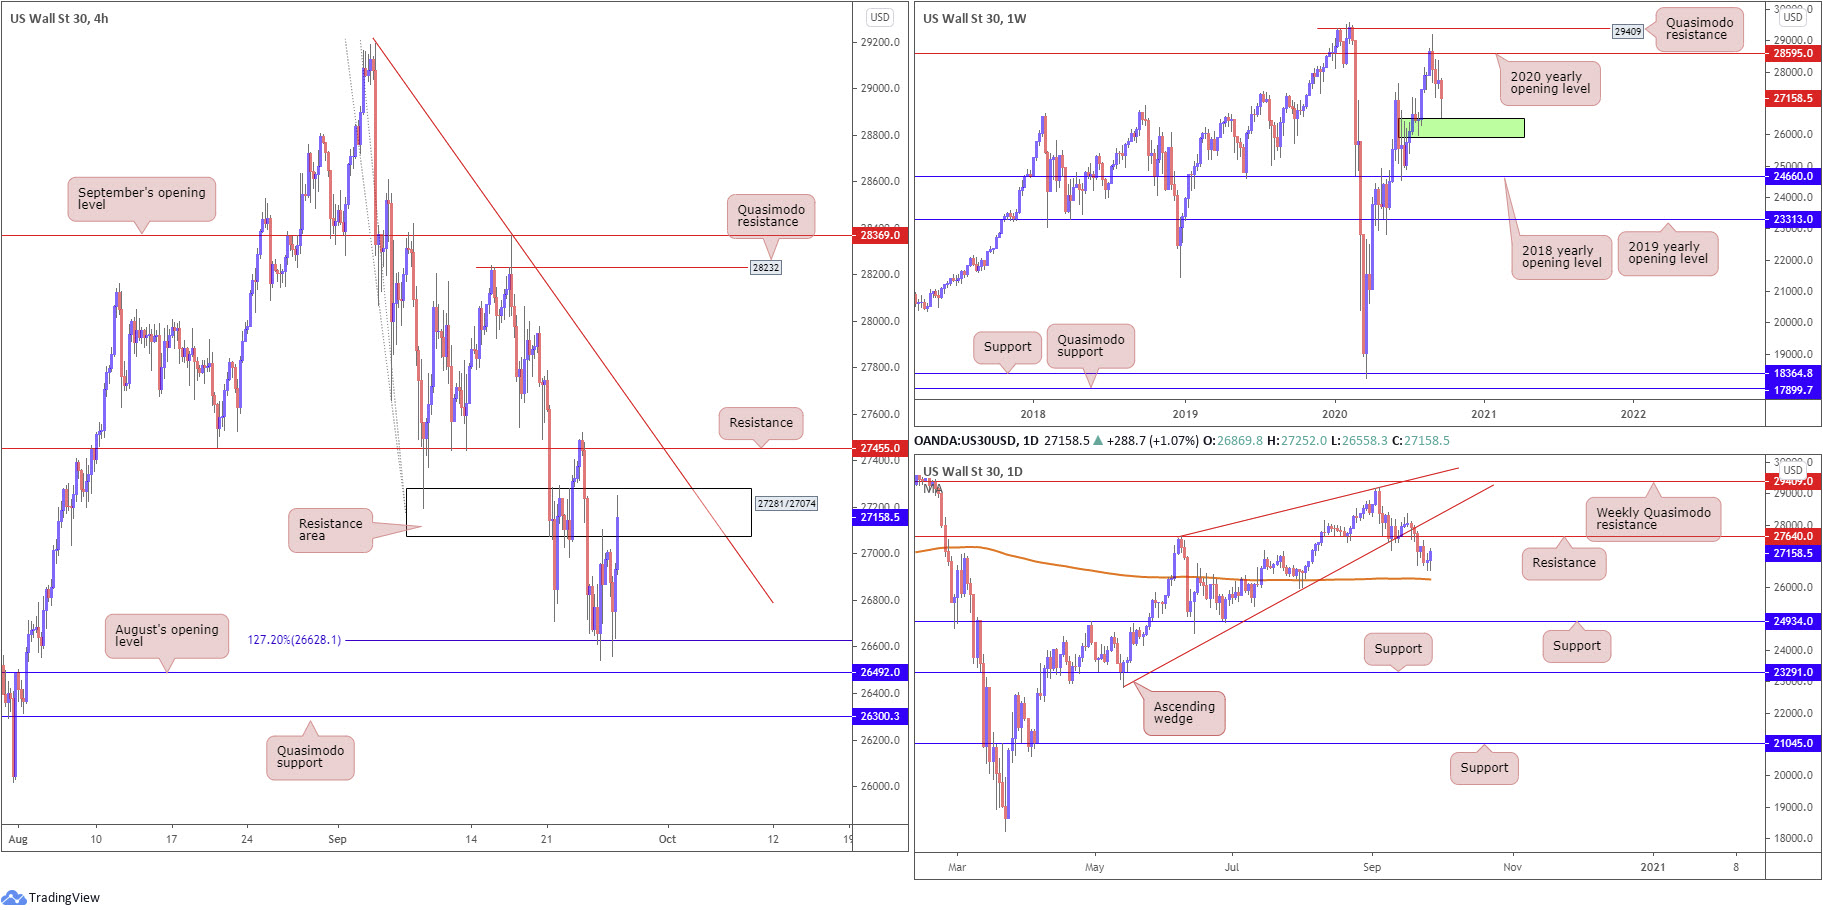
The technical landscape on the weekly timeframe reveals price movement recently spiked to within touching distance of demand (green) at 25916-26523, an area active buyers may try and defend.
This follows a recent attempt to overrun the 2020 yearly opening value at 28595, sited under Quasimodo resistance at 29409.
Daily perspective:
Trading on the daily timeframe elbowed through an ascending wedge last week, taken from the low 22803, and also took out support from 27640 (now a serving resistance).
Leaving the 200-day SMA (orange – 26270) unopposed, buyers made a stronger-than-expected comeback heading into the second half of the week, with price now poised to retest resistance at 27640.
Support priced in at 24934 is another level worthy of note, should the equity index press through the 200-day SMA this week.
H4 perspective:
US stock indexes ended Friday higher, elevated on the back of additional recovery gains in technology shares. The Dow Jones Industrial Average added 358.52 points, or 1.34%; the S&P 500 gained 51.87 points, or 1.60% and the Nasdaq traded higher by 241.30 points, or 2.26%.
Traders who read Friday’s technical briefing may recall the following (italics):
H4 resistance at 27455 side-lined hopes of additional recovery gains on Wednesday, as price aggressively turned to lower levels. Engulfing Monday’s low at 26708, Thursday crossed swords with a 127.2% Fibonacci extension point at 26628, which, as you can see, held firm and motivated a mild recovery play to a resistance area at 27281/27074. Traders will also acknowledge August’s opening value at 26492 is situated just south of the current Fib. Additional downside seen through the aforementioned support levels points to an approach towards Quasimodo support at 26300. An additional point of resistance to consider is the trend line formation, extended from the high 29193.
Areas of consideration:
Similar outlook to Friday’s report.
The weekly and daily timeframes suggest additional losses until weekly demand at 25916-26523 makes an appearance.
While the 127.2% Fibonacci extension point at 26628 welcomed buyers on the H4 in the second half of the week, the H4 resistance area priced in at 27281/27074 has proved difficult to overcome.
On the basis of the above, bearish scenarios from either 27281/27074 or 27455 on the H4 may materialise this week, targeting August’s opening value at 26492. This level serves as a solid support target and could encourage buying, given the base resides within weekly demand at 25916-26523. H4 Quasimodo support at 26300 is equally likely to entice buying should we reach this low, due to it residing within weekly demand and merging with the 200-day SMA.
XAU/USD (GOLD):
Weekly gain/loss: -4.56%
Weekly close: $1,861
Weekly perspective:
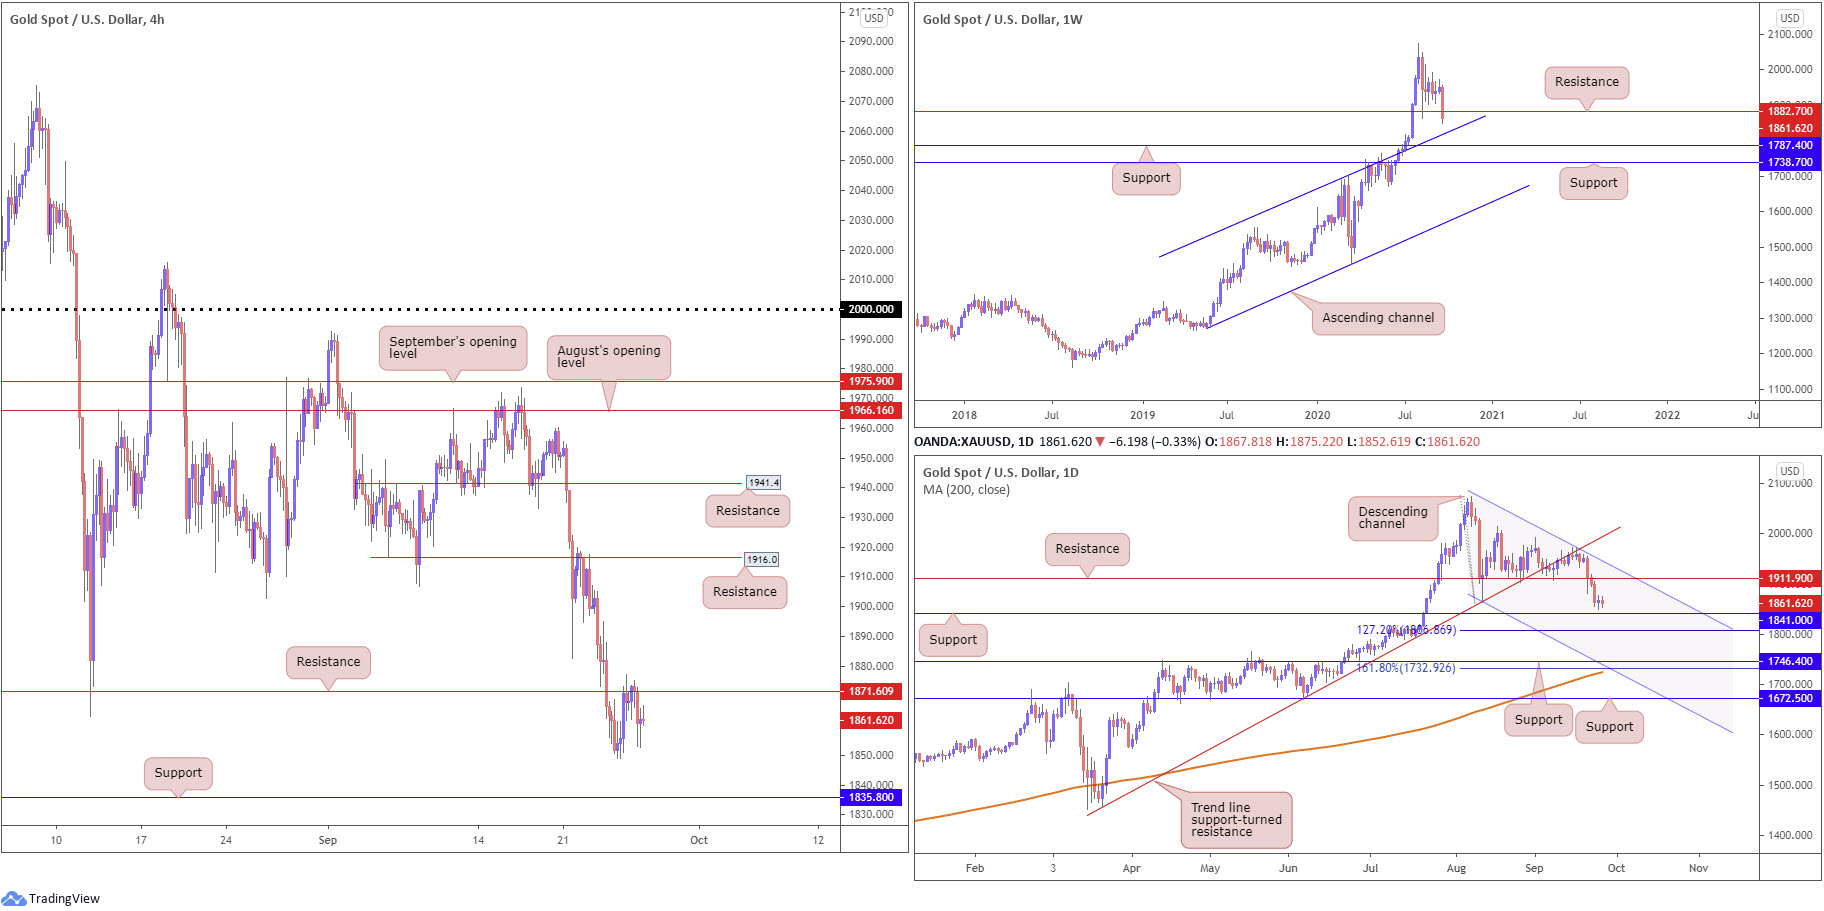
Support at $1,882 ceded ground last week (now serving as a potential resistance), extending the retracement slide from all-time peaks at $2,075 and shifting focus to channel resistance-turned support, etched from the high $1,703.
A favourable USD wind this week may also nudge support at $1,787 and $1,738 into reality.
Daily perspective:
Support from $1,911 vacated its position early last week, following the prior week’s action gripping trend line support-turned resistance, taken from the low $1,455.
Mid-week trading, however, observed downside pressure slow considerably, stationed ahead of support at $1,841, closely shadowed by another layer of support in the form of a 127.2% Fibonacci extension point at $1,806.
H4 perspective:
Friday’s technical briefing noted the following (italics):
H4 support at $1,871 was taken out on Wednesday, consequently directing the technical radar to support at $1,835 and unlocking the possibility of $1,871 establishing resistance, which, as you can see, is what occurred in recent hours.
As visible from the H4 chart, $1,871 resistance served sellers on Friday, though was unable to overrun Thursday’s low at $1,848.
Areas of consideration:
As aired in recent reports, sellers still appear to have the advantage until connecting with daily support at $1,841, closely shadowed by H4 support at $1,835 and then the weekly channel support (around $1,825ish).
Recently retesting $1,871 as resistance on the H4, therefore, has unearthed a bearish theme. Should a H4 bearish candle form around current price, this may be interpreted as a signal we’re heading for the supports underlined above.
The accuracy, completeness and timeliness of the information contained on this site cannot be guaranteed. IC Markets does not warranty, guarantee or make any representations, or assume any liability regarding financial results based on the use of the information in the site.
News, views, opinions, recommendations and other information obtained from sources outside of www.icmarkets.com.au, used in this site are believed to be reliable, but we cannot guarantee their accuracy or completeness. All such information is subject to change at any time without notice. IC Markets assumes no responsibility for the content of any linked site.
The fact that such links may exist does not indicate approval or endorsement of any material contained on any linked site. IC Markets is not liable for any harm caused by the transmission, through accessing the services or information on this site, of a computer virus, or other computer code or programming device that might be used to access, delete, damage, disable, disrupt or otherwise impede in any manner, the operation of the site or of any user’s software, hardware, data or property.


