
A note on lower timeframe confirming price action…
Waiting for lower timeframe confirmation is our main tool to confirm strength within higher timeframe zones, and has really been the key to our trading success. It takes a little time to understand the subtle nuances, however, as each trade is never the same, but once you master the rhythm so to speak, you will be saved from countless unnecessary losing trades. The following is a list of what we look for:
- A break/retest of supply or demand dependent on which way you’re trading.
- A trendline break/retest.
- Buying/selling tails/wicks – essentially we look for a cluster of very obvious spikes off of lower timeframe support and resistance levels within the higher timeframe zone.
- Candlestick patterns. We tend to stick with pin bars and engulfing bars as these have proven to be the most effective.
We search for lower timeframe confirmation between the M15 and H1 timeframes, since most of our higher-timeframe areas begin with the H4. Stops are usually placed 5-10 pips beyond confirming structures.
EUR/USD:
Weekly gain/loss: + 7 pips
Weekly closing price: 1.0590
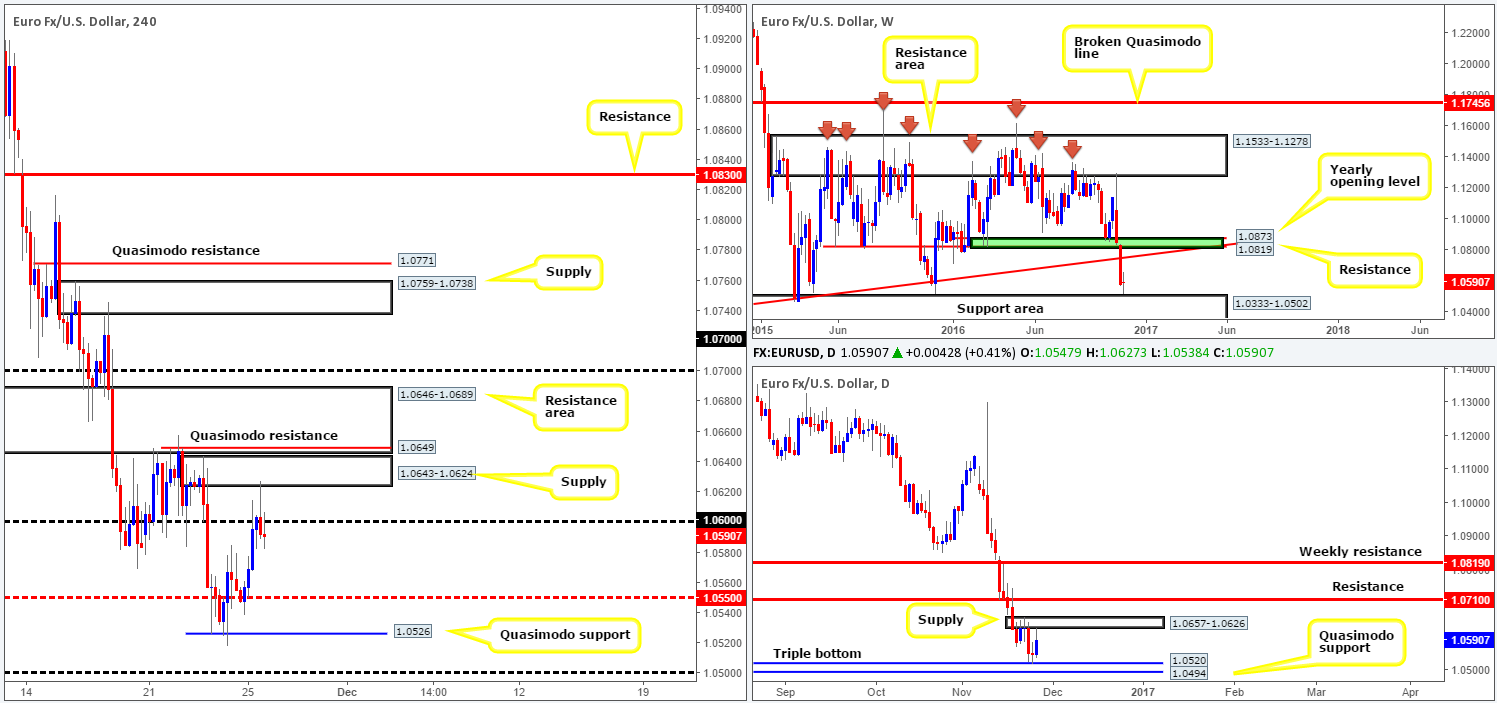
Weekly view: Price action took on more of a subdued tone last week, consequently chalking up an indecision candle by the close. Despite this, the shared currency did, however, come within a whisker of connecting with a major support area coming in at 1.0333-1.0502. The next upside objective from this angle falls in at a trendline resistance extended from the low 0.8231, shadowed closely by resistance at 1.0819 and the 2016 yearly opening level at 1.0873.
Daily view: In conjunction with weekly price hovering above a support zone, the daily candles recently formed a beautiful triple bottom support formation around the 1.0520 neighborhood, stretching as far back as Apr 2015. While further buying is a strong possibility from this support, there’s a minor supply barrier shaped by four beautiful selling wicks at 1.0657-1.0626 to contend with first. The other key thing to watch for this week is a fakeout through the triple bottom level to the Quasimodo support at 1.0494, which is conveniently positioned around the top edge of the above noted weekly support area!
H4 view: Underpinned by the mid-way support barrier at 1.0550, the H4 bulls managed to find their feet early on in Friday’s trading. This, as you can see, propelled the EUR up to the 1.06 handle, which held firm into the week’s close, but not before suffering a rather aggressive fakeout going into US trading up to supply at 1.0643-1.0624.
Direction for the week: Despite weekly upside looking relatively clear, the daily’s structure is, as we mentioned above, somewhat challenging. Until we see a daily close above the aforementioned daily supply, as well as a close above the daily resistance at 1.0710, our desk has stamped medium-term direction as ‘restricted’ this week.
Direction for today: In view of the H4 closing the week beneath the 1.06 barrier, and given daily price recently touched base with the underside of the above said minor supply, price may continue to extend lower from here down to 1.0550, followed closely by the Quasimodo support coming in at 1.0526 and maybe even the 1.05 barrier.
Our suggestions: Given that higher-timeframe flow is slightly cramped at the moment (see above), we feel there’s equal opportunity to trade this pair both long and short today:
Longs:
- On the account that 1.05 molds beautifully with the daily Quasimodo support at 1.0494 and also the top edge of the weekly support area at 1.0502, the 1.05 handle is, at least in our book of technical setups, stable enough to permit a pending buy order at 1.0495 with a stop placed below the head of the current daily Quasimodo formation at 1.0459.
- The H4 Quasimodo support at 1.0526 is interesting, but is slightly more precarious than option 1, since this level is liable to be faked in order to reach the 1.05 neighborhood given how close it is.
Shorts:
- 1.06 could be a potential barrier to short today given the last two H4 bearish candles printed prior to the close.
- The Quasimodo resistance at 1.0649 is even better than 1.06, in our opinion. This is due to the level being housed within the extremes of the above noted daily supply, and also positioned around the lower edge of a H4 resistance area drawn from 1.0646-1.0689.
Data points to consider: ECB President Draghi speaks at 2pm GMT.
Levels to watch/live orders:
- Buys: 1.0495 ([pending order] stop loss: 1.0459). 1.0526 region ([waiting for lower timeframe confirming action is preferred – see the top of this report] stop loss: ideally beyond the trigger candle).
- Sells: 1.06 region ([waiting for lower timeframe confirming action is preferred – see the top of this report] stop loss: ideally beyond the trigger candle). 1.0649 area ([waiting for lower timeframe confirming action is preferred – see the top of this report] stop loss: ideally beyond the trigger candle).
GBP/USD:
Weekly gain/loss: + 130 pips
Weekly closing price: 1.2473
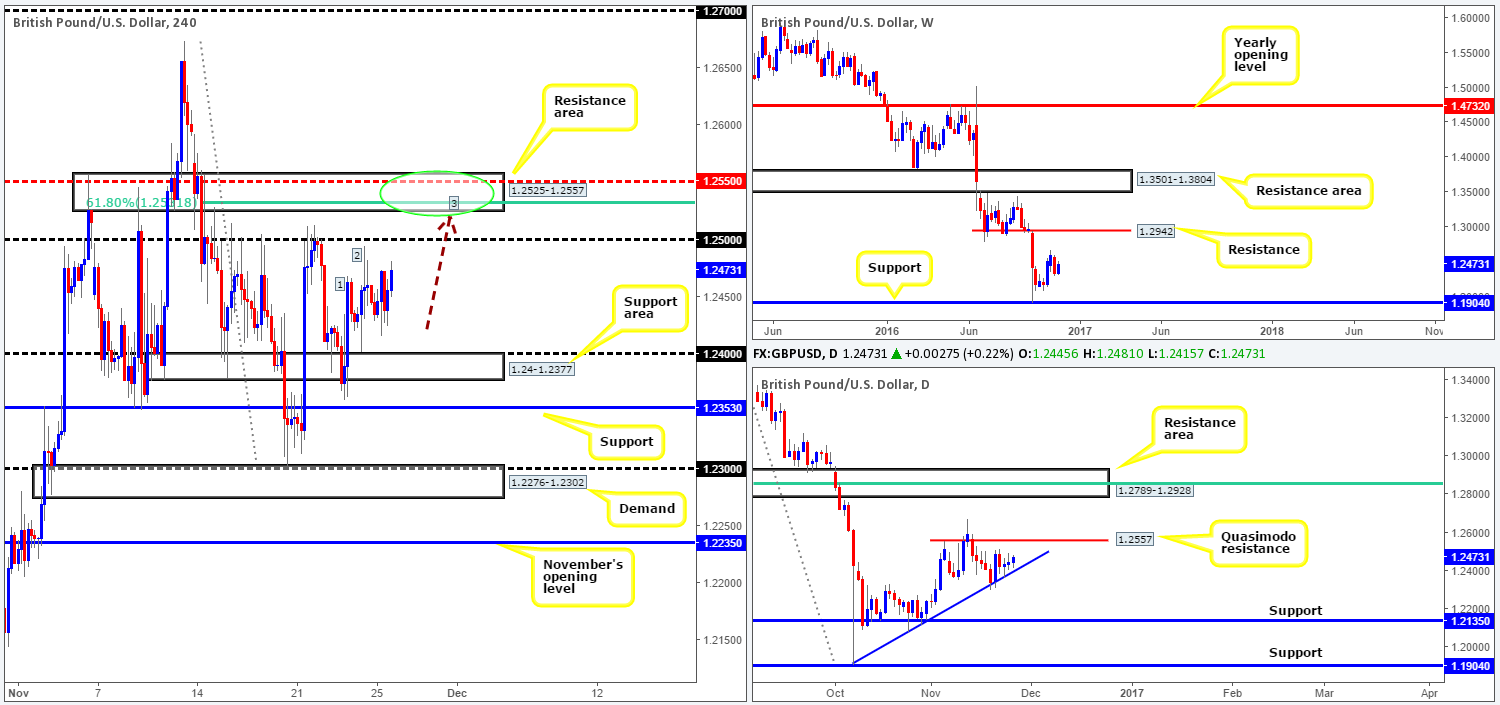
Weekly view: Although sterling managed to record a gain last week, the overall structure places the unit mid-range between resistance penciled in at 1.2942 and support carved from 1.1904.
Daily view: From the daily chart, however, price remained bid last week off the trendline support taken from the low 1.1904. To the upside, the next area to keep an eyeball on this week is the Quasimodo resistance line seen at 1.2557. Beyond this barrier, nevertheless, we’re looking at the resistance area at 1.2789-1.2928 that fuses nicely with a 61.8% Fib resistance at 1.2853 (green line), which happens to be positioned just ahead of the aforementioned weekly resistance level.
H4 view: Friday’s UK growth data (second estimate) came in as expected and was, as far as we can see, largely ignored by the market, as the pair spent the day chewing through orders around the mid-way level 1.2450.
Direction for the week: Medium-term direction is a little challenging to forecast this week. Daily action is somewhat restricted by the current trendline support and the Quasimodo resistance, while weekly flow is floating in no-man’s-land right now (see above). Although the longer-term bias remains negative, we would feel uncomfortable acting on any medium-term sell signals before the current daily trendline is taken out.
Direction for today: The H4 resistance zone drawn from 1.2525-1.2557 is especially striking and could potentially be brought into the action today. The area boasts a H4 61.8% Fib resistance at 1.2531, a H4 mid-way resistance at 1.2550, a potential H4 three-drive approach (waves 1 and 2 are labeled, with the black arrow denoting the next potential third leg) and the top edge of the H4 zone represents the daily Quasimodo resistance mentioned above at 1.2557. Now, in view of the last point, this does mean there’s a chance that price could fake through our H4 resistance zone, so traders need to be prepared for that. The final key thing to note here is the 1.25 handle. The majority of the market watches these levels, and are, on a regular basis, run for stops, which is exactly what we’re looking to see in this instance.
Our suggestions: While a fakeout above the aforementioned H4 resistance barrier is a possibility, we can still trade from here. Instead of placing a pending sell order and positioning stops just above the zone (not a good idea when a fakeout is likely), waiting for a reasonably sized H4 bearish candle to form within the walls of this region is by far, the safer, more conservative route to take here. This will, of course, not guarantee a winning trade, but will show that sellers have taken an interest here, before we pull the trigger!
Levels to watch/live orders:
- Buys: Flat (stop loss: N/A).
- Sells: 1.2557-1.2525 ([reasonably sized H4 bearish close required prior to pulling the trigger] stop loss: ideally beyond the trigger candle).
AUD/USD:
Weekly gain/loss: + 107 pips
Weekly closing price: 0.7438
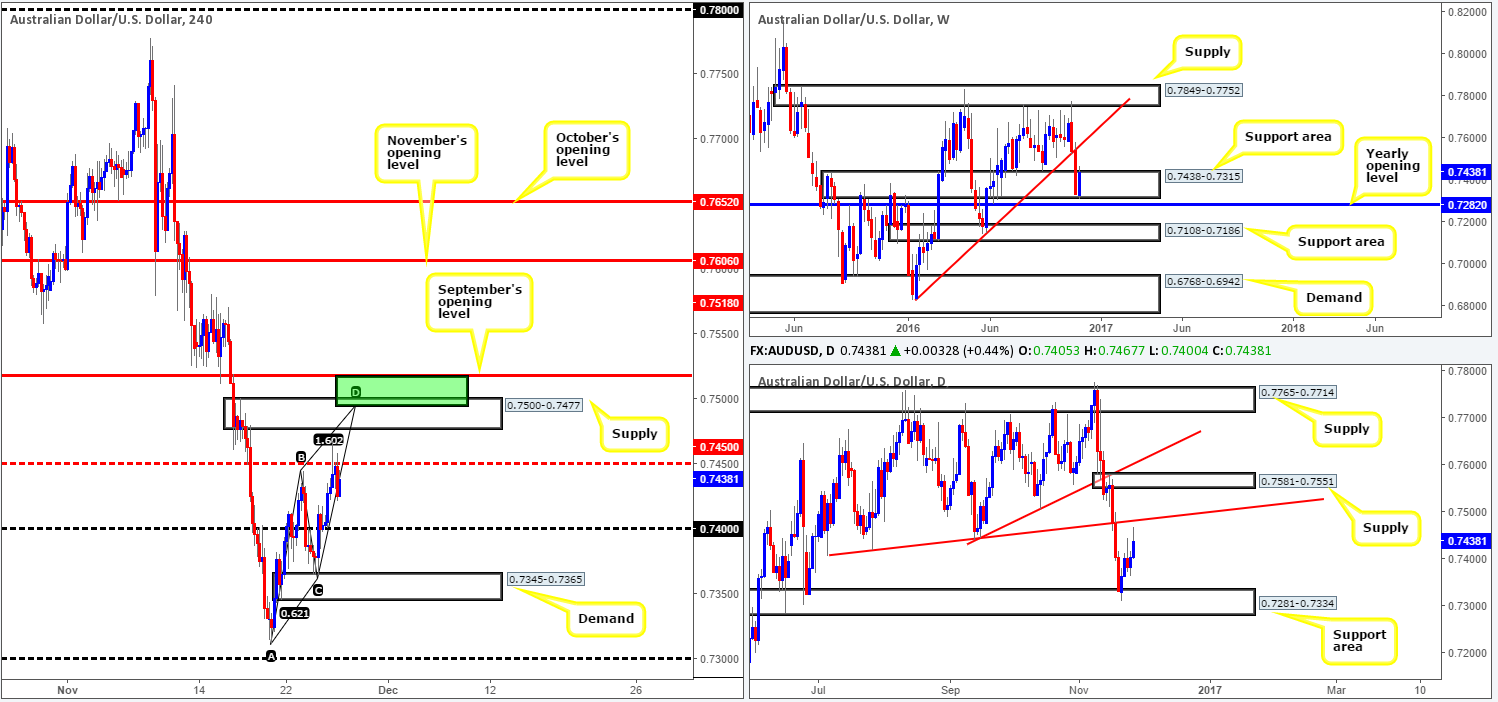
Weekly view: After slightly breaching the lower edge of the support area at 0.7438-0.7315, and leaving the 2016 yearly opening level at 0.7282 unchallenged, the Aussie rallied higher last week. Erasing around 50% of the prior week’s losses, the pair looks, at least from the weekly chart, to be on course to connect with a trendline resistance extended from the low 0.6827.
Daily view: From this viewpoint, nonetheless, we can see that price was reinforced by a daily support area coming in at 0.7281-0.7334. Other than Wednesday’s session, the bulls were in fine form throughout the week, closing the week just ahead of a daily trendline resistance taken from the low 0.7407.
H4 view: A quick recap of Friday’s trade on the H4 shows that price extended Thursday’s retest off 0.74 and clocked a high of 0.7467 as we ran into the early hours of the London segment. However, as you can see, price was unable to sustain gains beyond the mid-way resistance point at 0.7450, and spent the London session, as well as a good chunk of the US session, grinding lower.
Direction for the week: Weekly action suggests further buying may be on the cards this week. Though, with the bulls only managing to claw back 50% of the prior week’s losses, and the fact that there’s a nearby daily trendline resistance seen within striking distance, we’re hesitant buying this market at the moment.
Direction for today: We feel the current daily trendline resistance will be a bit of a magnet to price today, potentially dragging the commodity currency above the 0.7450 hurdle into a H4 supply base registered at 0.7500-0.7477, which is likely to hold firm.
Our suggestions: The H4 supply is very interesting. It not only intersects with the aforementioned daily trendline resistance, it also houses a H4 AB=CD bearish completion point at 0.7494 along with the top edge of the supply also representing a round number (0.75).
With the 0.75 handle being a potential target here, traders will need to be prepared for the possibility that a fake through the H4 supply zone may be seen. We believe this is highly possible given that only 18 pips above this level sits September’s opening barrier at 0.7518.
In light of the above points, we have a sell zone chalked in from 0.7518/0.7494 (green rectangle). To avoid an unnecessary loss from a fakeout here, we would not advise setting pending orders. Rather, be patient and wait for a reasonably sized H4 bearish candle to take shape, prior to pulling the trigger.
Levels to watch/live orders:
- Buys: Flat (stop loss: N/A).
- Sells: 0.7518/0.7494 ([reasonably sized H4 bearish close required prior to pulling the trigger] stop loss: ideally beyond the trigger candle).
USD/JPY:
Weekly gain/loss: + 231 pips
Weekly closing price: 113.16
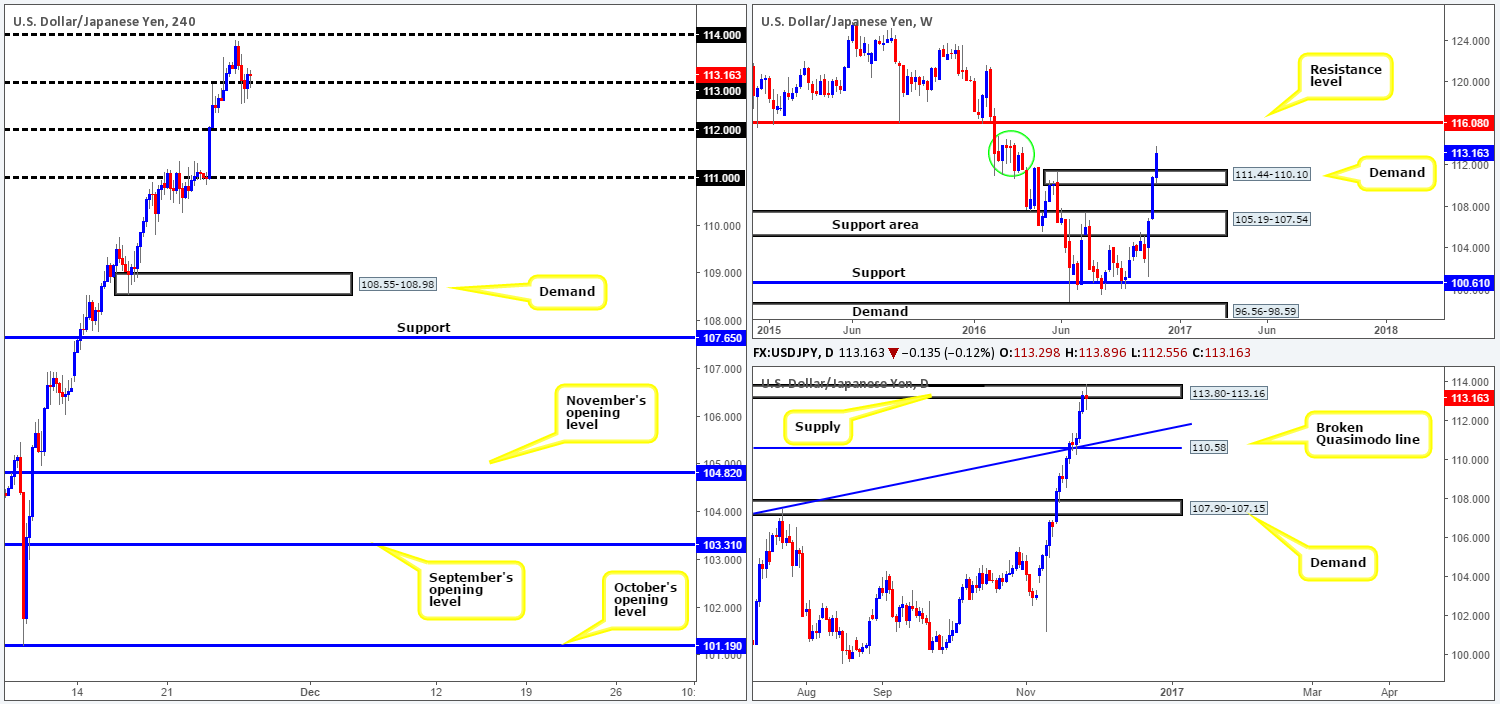
Weekly view: The US dollar continued to soar last week, pressuring the couple to close above supply at 111.44-110.10 (now acting demand). Assuming that the bulls remain in the driving seat for a fourth consecutive week, it’s possible that the resistance level at 116.08 may be drawn into the action. Nevertheless, it is certainly not plain sailing from here as there’s a lot of wood seen to chop through between the 114.87/111.44 area (green circle).
Daily view: The story on the daily chart shows that price ended the week chalking up an indecision candle around the supply zone at 113.80-113.16. To our way of seeing things, this supply is the last fresh area before price is (technically) free to advance to the above noted weekly resistance level.
H4 view: Early on in Friday’s session, the unit topped ahead of the 114 handle and proceeded to decline in value, eventually closing below the 113 barrier. Despite this, the bulls managed to recover and end the day closing back above 113 which could portend bullish strength going into today’s sessions.
Direction for the week: Until the current daily supply is consumed, our team is reluctant to commit to any medium-term longs. Conversely, selling from current price would, in our opinion, be asking for trouble given weekly flow looks poised to test the weekly resistance level.
Direction for today: According to the H4 candles, the bulls may push on to the 114 neighborhood today.
Our suggestions: Buying from 113 is just too risky for our desk. The current daily supply could potentially throw a spanner in the works here and force price down to the 112 vicinity. Similarly, selling is just as risky in light of the recent dollar strength (see weekly chart) and current psychological handle 113.
As you can see, there’s not much of a tradable setup on this pair today, well, not one that we’d agree with anyway. As such, we’ll remain flat for the time being.
Data points to consider today: Japanese Household spending data at 11.30pm GMT.
Levels to watch/live orders:
- Buys: Flat (stop loss: N/A).
- Sells: Flat (stop loss: N/A).
USD/CAD:
Weekly gain/loss: + 17 pips
Weekly closing price: 1.3513
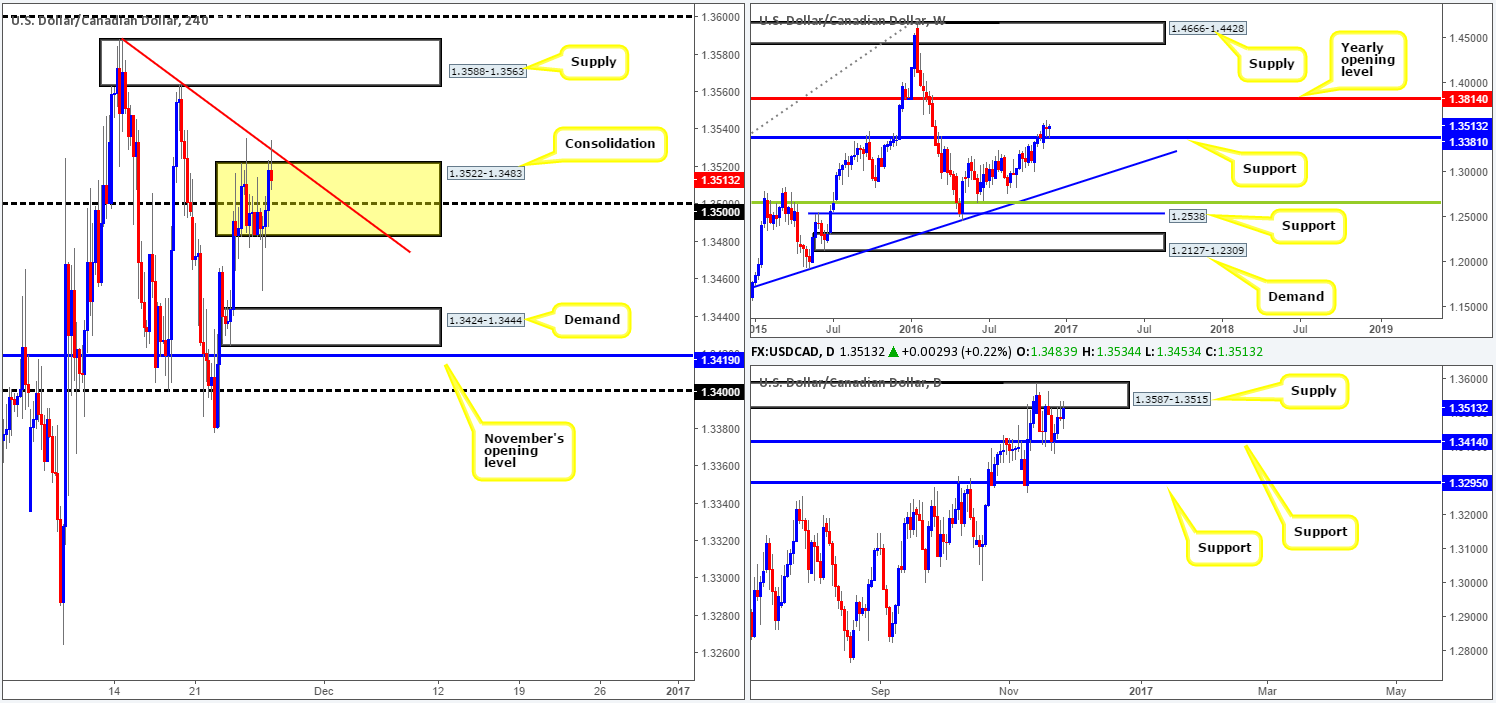
Weekly view: As you can see, price remained relatively unchanged by last week’s close. From a weekly standpoint, however, the overall tone remains biased to the upside, with the path north looking clear for a run up to the 2016 yearly opening level at 1.3814. Perhaps the most compelling factor here is the weekly buying tail that printed off the current support barrier at 1.3381.
Daily view: Since the 9th Nov, the pair has been trading in a sideways formation between supply found at 1.3587-1.3515 and a support at 1.3414. If the above supply is violated, supply at 1.3859-1.3765, which holds the aforementioned yearly opening level within, would likely be the next objective to reach. Conversely, a break below the current support could spark a downside move towards support at 1.3295.
H4 view: Amid Thursday and Friday’s sessions, the pair begun chiseling out a consolidation zone anchored around the 1.35 handle at 1.3522-1.3483. A break above the top edge of this formation (as well as the H4 trendline resistance taken from the high 1.3588) could lead to a continuation move north up to supply at 1.3588-1.3563, followed closely by the 1.36 barrier. A push lower on the other hand, has the demand at 1.3424-1.3444 to target that sits just ahead of November’s opening level at 1.3419.
Direction for the week: Without a daily close above the current daily supply, upside is somewhat limited, despite what the weekly structure is suggesting. Ultimately, for medium-term direction to be confirmed, we need to see the daily candles break free from its current range between 1.3414/1.3587-1.3515 (see above).
Direction for today: With an incredibly light docket today, the H4 candles may remain within its current range.
Our suggestions: Should price breakout above the current H4 range, buying is risky since you’re effectively entering long directly into daily supply! However, selling the breakout beyond this range is just as risky, in our opinion, since you’re essentially planting yourself against weekly flow (see above).
For us to be confident buyers in this market, a decisive H4 close is required above the 1.36 handle. This move would, as far as we can see, highly likely clear stops from above the daily supply and open the pathway north to H4 resistance at 1.3662.
With the above in mind, our team will remain on the sidelines today and wait for further developments.
Levels to watch/live orders:
- Buys: To become buyers, we would ideally like to see 1.36 consumed.
- Sells: Flat (stop loss: N/A).
USD/CHF:
Weekly gain/loss: + 33 pips
Weekly closing price: 1.0131
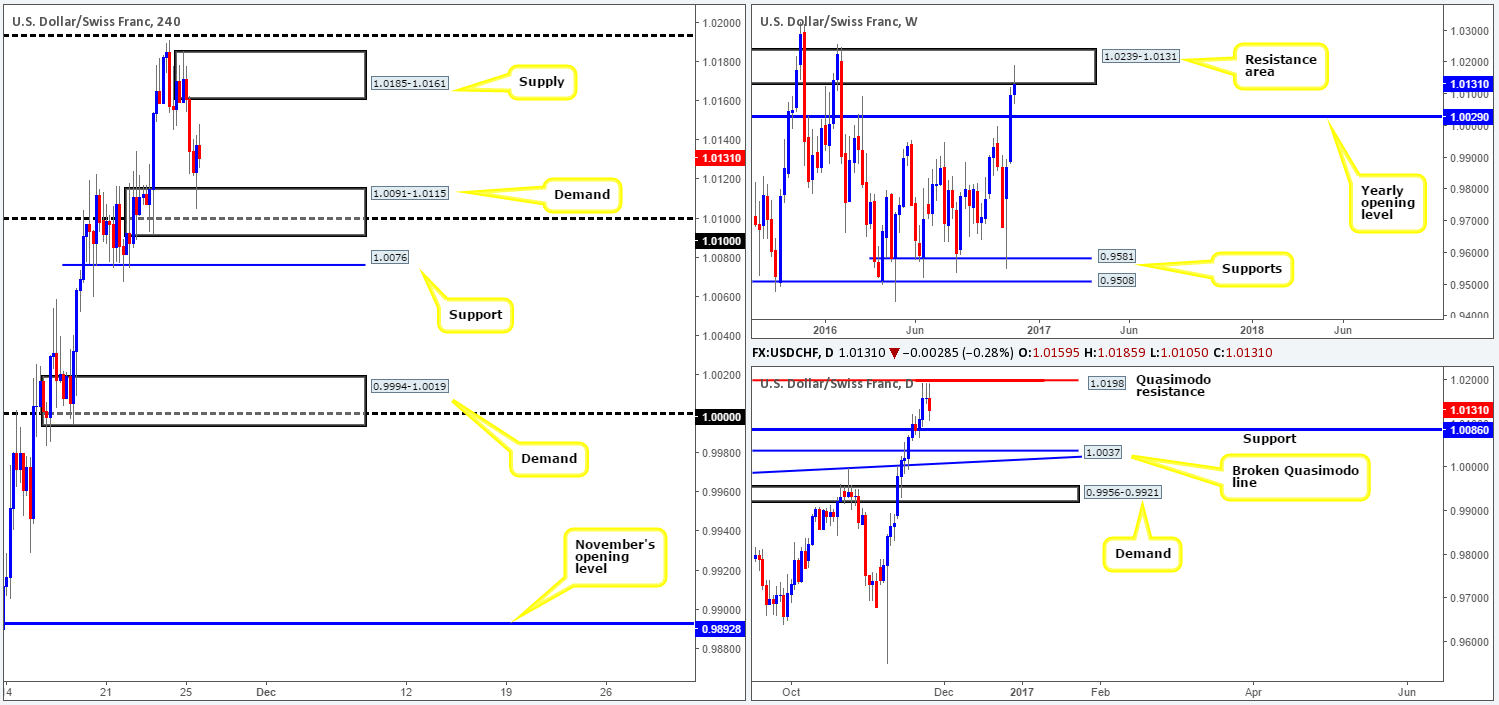
Weekly view: The USD/CHF enjoyed another relatively successful session last week, bidding price to highs of 1.0191. Be that as it may, upside momentum may be on the verge of drying up given that price nudged into a resistance area penciled in at 1.0239-1.0131. On the assumption that the bears continue to defend this zone, the next objective to reach is seen at 1.0029: the 2016 yearly opening level.
Daily view: Shaped by three beautiful selling wicks, we can see that the daily candles topped just ahead of a Quasimodo resistance level drawn from 1.0198. In that price ended the week settling between the above noted Quasimodo and a support at 1.0086, both hurdles will be noted in our watchlist for the upcoming week.
H4 view: A brief look at recent dealings on the H4 chart shows price sold off going into the early hours of London and touched ground with demand seen at 1.0091-1.0115. Leaving the psychological handle 1.01 unchallenged (seen fixed within the demand), the Swissy did manage to catch a bid from the demand zone amid the US open and rallied to highs of 1.0148 by the week’s end.
Direction for the week: Well, according to the weekly chart, there is a good chance that we may see a pullback this week. However, the current daily support at 1.0086 is certainly not a level one can ignore. Technically speaking, downside can only be confirmed once this daily support has been consumed. Even then however, there is not a lot of room to play with due to how close the next target support is: a daily broken Quasimodo line at 1.0037, which converges with a daily trendline support carved from the high 0.9956.
Direction for today: Seeing as how there’s absolutely no US data on the docket today, as well as this pair being a notably slow mover, we’d be surprised to see a breach of the current H4 supply/demand zones.
Our suggestions: To become sellers, a H4 close below the H4 support at 1.0076 is needed. This would, according to H4 structure, clear the runway south down to the H4 demand at 0.9994-1.0019 (holds parity). Nonetheless, should one find themselves short below 1.0076 this week, do make sure to note the oncoming daily broken Quasimodo line at 1.0037 and also the yearly opening level at 1.0029, as this base could potentially stop price from reaching the aforementioned H4 demand. This is why it is SO important to know where one is in the bigger picture at all times!
Levels to watch/live orders:
- Buys: Flat (stop loss: N/A).
- Sells: To become sellers, a H4 close below the H4 support at 1.0076 is needed, followed by a retest to the underside of this level as resistance along with a lower timeframe confirming sell signal (see the top of this report).
DOW 30:
Weekly gain/loss: + 277 points
Weekly closing price: 19151
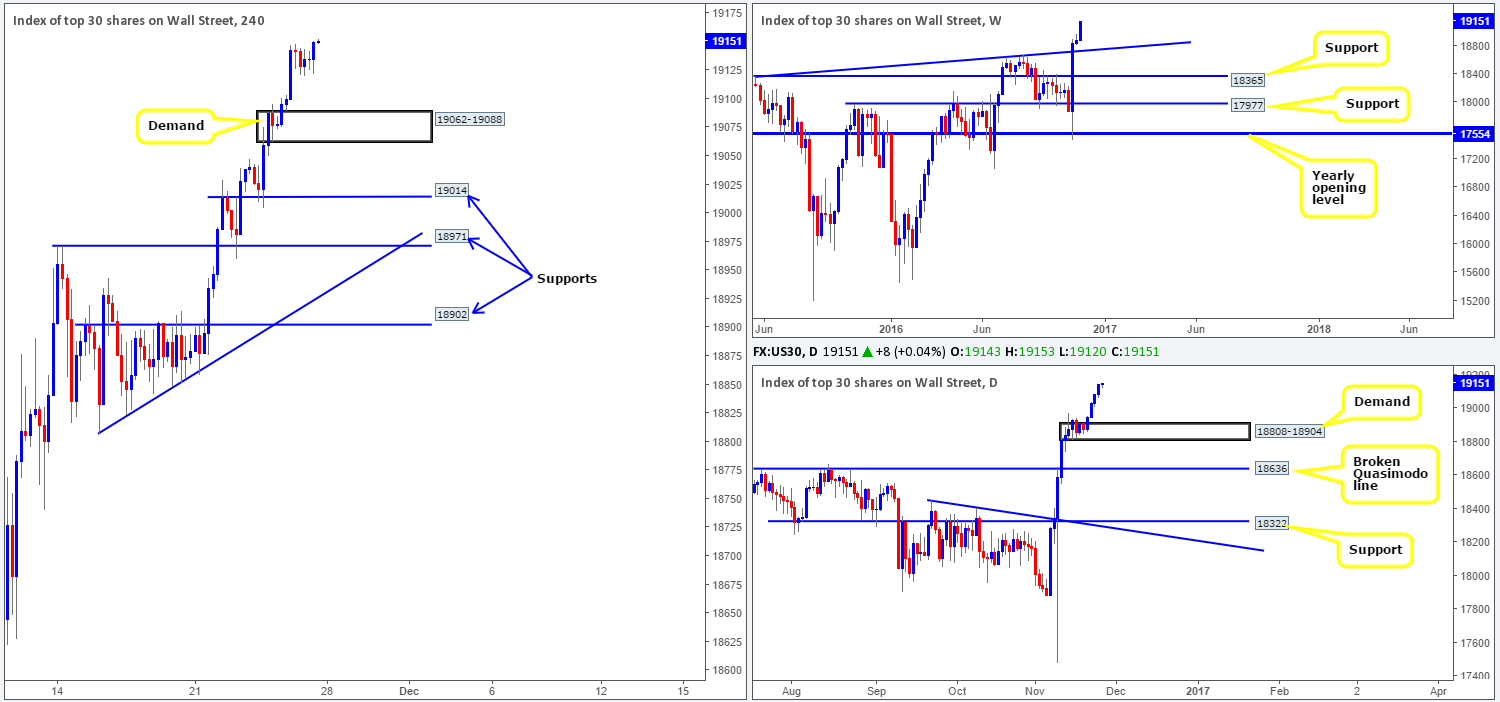
Weekly view: Equities continued to advance last week, punching to fresh all-highs of 19153. Should one be looking to join this current trend on the DOW, the closest support seen on the weekly chart is a trendline support taken from the high 18365.
Daily view: Apart from Friday’s lethargic candle, Monday through to Thursday printed near-full-bodied bullish candles! This has, as you can see, formed a nice-looking demand base to keep an eye on this week coming in at 18808-18904. While this area has a good chance of rebounding price, one needs to remain cognizant of the weekly trendline support mentioned above, which lingers just below this zone.
H4 view: As already stated above in the daily section Friday’s sessions were sluggish, managing to range only 33 points on the day. Seeing as there’s absolutely no higher-timeframe resistance seen on the horizon (see weekly and daily charts), today’s spotlight will remain focused on the following barriers for possible long positions should the market choose to pullback:
- The newly-formed H4 demand at 19062-19088.
- The H4 support at 19014, which held beautifully on Wednesday.
- The H4 support at 18971 that converges with a H4 trendline support carved from the low 18808 and also held steady on Tuesday.
- The only H4 area that has any connection to the higher timeframes is the lowest of the three supports at 18902, which forms the top edge of the current daily demand base at 18904.
Direction for the week: Although a pullback is a possibility, the overall tone remains biased to the upside given the lack of clear resistance ahead.
Direction for today: This is difficult to judge. Ultimately we’re looking for a pullback in price today, which may come to fruition considering upside momentum diminished going into Friday’s close.
Our suggestions: In light of our four chosen buy zones, it is challenging to know which will react, if any. Therefore, we need to see evidence that the bulls are interested. One could simply wait for a reasonably sized H4 bull candle to form to confirm this. Or, failing that, you may want to drill down to the lower timeframes and hunt for confirmation there (see the top of this report for ideas on how to pin down an entry using the lower timeframes).
Levels to watch/live orders:
- Buys: 19062-19088 ([reasonably sized H4 bullish close required prior to pulling the trigger] stop loss: ideally beyond the trigger candle). 19014 ([reasonably sized H4 bullish close required prior to pulling the trigger] stop loss: ideally beyond the trigger candle). 18971 ([reasonably sized H4 bullish close required prior to pulling the trigger] stop loss: ideally beyond the trigger candle). 18902 ([in light of its connection with the daily timeframe, one could, dependent on the time of day, consider entering here at market] stop loss: below the H4 candle tail of 18859).
- Sells: Flat (stop loss: N/A).
GOLD:
Weekly gain/loss: – $26
Weekly closing price: 1182.4
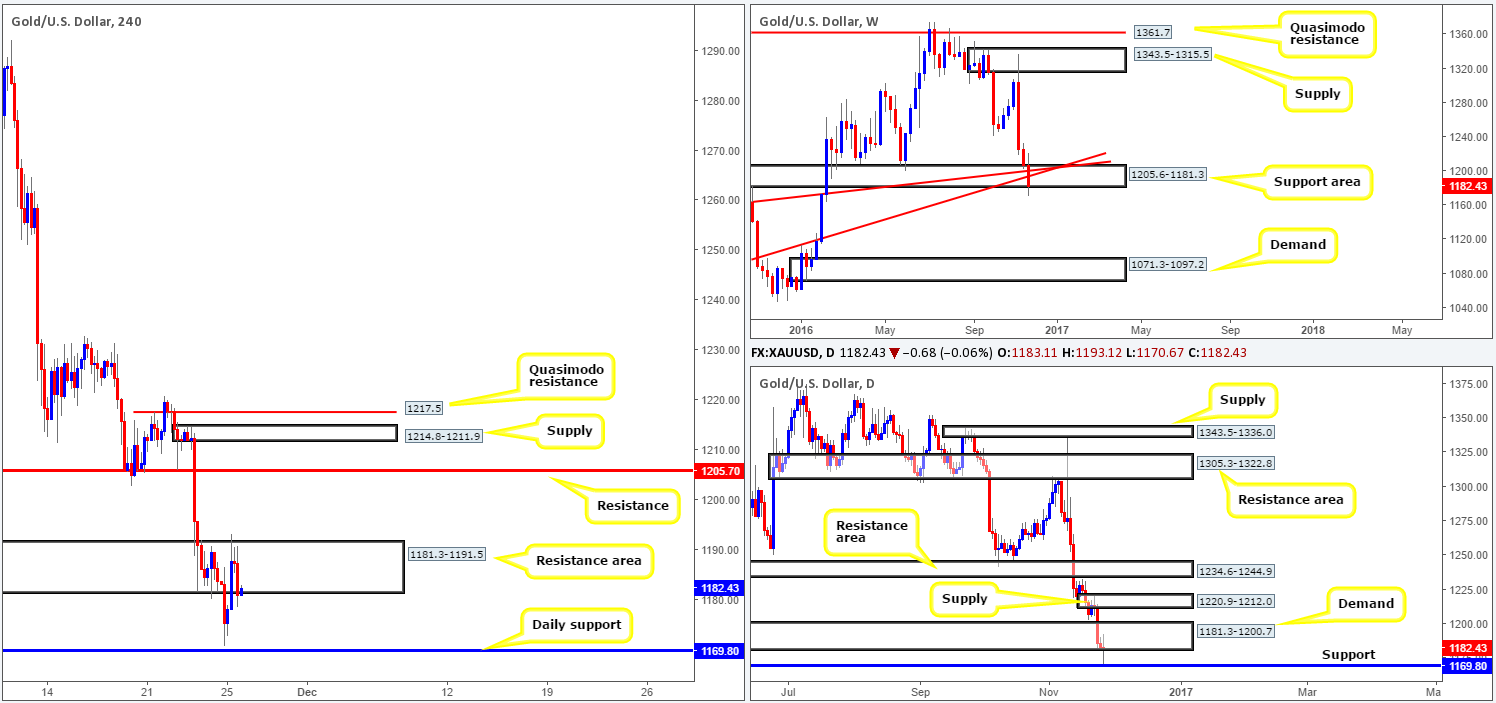
Weekly view: Last week’s sharp run to the downside pushed the metal into further losses, consequently stripping $26 off its value. As a result, two weekly trendline supports (1130.1/1071.2) were wiped out (now acting resistances). In addition to this, price also pierced though the lower edge of a support area at 1205.6-1181.3, but failed to print a close beyond the zone.
Daily view: Zooming in and looking at the daily picture, we can see that gold penetrated demand at 1181.3-1200.7 (located within the lower extremes of the above noted weekly support area), and came within reaching distance of support fixed at 1169.8, which boasts strong history. Friday’s session also ended printing an indecision candle, suggesting market participants were hesitant going into the week’s end.
H4 view: Stepping over to the H4 candles, price established a resistance around the top edge of a resistance area coming in at 1181.3-1191.5 as London opened its doors for business. From thereon, the metal trickled south, recording a low of 1178.5 a few hours ahead of the week’s close.
Direction for the week: weekly direction is problematic. Although weekly price failed to close beyond the current support area, we’re sure you’ll agree with us in saying that the bears look incredibly strong here. Conversely, daily support at 1169.8 was also very nearly brought into the picture on Friday. This – coupled with Friday’s indecision candle, could lead to a possible recovery from current price.
Essentially, the yellow metal is trading in a very sensitive position right now and to say price will likely head one way over another would be no more than a rough finger-in-the-wind assessment.
Direction for today: A violation of the current H4 resistance area at 1181.3-1191.5 would likely open the trail north up to 1205.7: a H4 resistance. Meanwhile, further selling is somewhat capped by the aforementioned daily support level.
Our suggestions: On the condition that a decisive H4 close is seen above the current H4 resistance, we may look to buy gold, targeting the above noted H4 resistance level, followed closely by a H4 supply zone at 1214.8-1211.9 and a H4 Quasimodo resistance at 1217.5 (both areas boast a connection with a daily supply zone seen at 1220.9-1212.0).
To trade this move, however, we’d want to see a retest to the top edge of the H4 resistance area as support as well as a reasonably sized H4 bullish reaction.
Levels to watch/live orders:
- Buys: Watch for a H4 close above the H4 resistance area at 1181.3-1191.5 and then look to trade any retest seen thereafter ([H4 bullish close required] stop loss: ideally beyond the trigger candle).
- Sells: Flat (stop loss: N/A).


