
- UK banks are closed in observance of the Spring Bank Holiday.
- US banks are also closed in observance of Memorial Day.
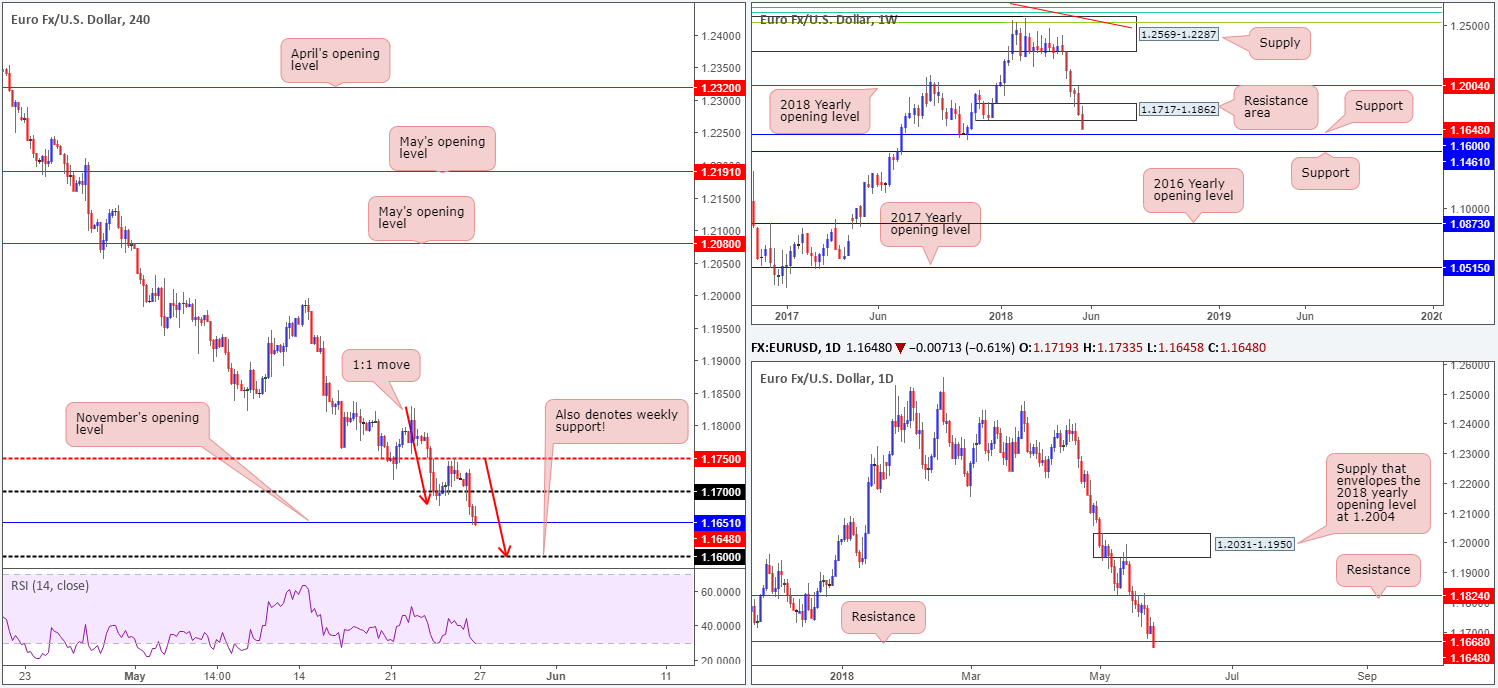
EUR/USD:
Weekly Gain/Loss: -1.09%
Weekly Closing price: 1.1648
Over the course of last week the single currency continued to spiral south. In the shape of a near-full-bodied weekly bearish candle the pair recorded its sixth consecutive losing week, eliminating weekly demand at 1.1717-1.1862 (now acting resistance area) and consequently exposing weekly support priced in at 1.1600. We feel price is likely to find support from here with it having been a strong barrier of resistance in past and also serving as stiff support back in November 2017.
Looking at daily action, we can see price retested the underside of resistance at 1.1824 beautifully on Tuesday, which clearly excited the sellers. The week concluded closing beneath daily support marked at 1.1668 in strong fashion, potentially freeing downside to a daily Quasimodo support line at 1.1574 (not seen on the screen).
A quick look at recent dealings on the H4 scale shows us that price action rid itself of 1.17 amid Friday’s trade and went on to test fresh 2018 lows around November’s opening level seen at 1.1651. Well done to any of our readers who hopped in short around the 1.1730s as this was a noted move to watch for in Friday’s report.
With both weekly and daily support out of the picture (see above), H4 price may look to complete its 1:1 move (see red arrows) lower which terminates at the 1.16 handle (effectively weekly support). That is assuming that November’s opening level at 1.1651 does not put up much of a fight!
Areas of consideration:
The euro continues to be gripped by political woes. The situation in Italy as well as political troubles in Spain, combined with diminishing data surprises has led analysts to believe the currency could be heading much lower.
Though we expect some bullish activity to be present around 1.1651ish, the real test for shorts will likely be at the current weekly support level drawn from 1.1600. Therefore, for those who remain short this may serve well as a final take-profit target.
Those who missed the initial call to sell, intraday (retest) plays below November’s opening level may be an option today, targeting the 1.16 handle.
Today’s data points: Limited.
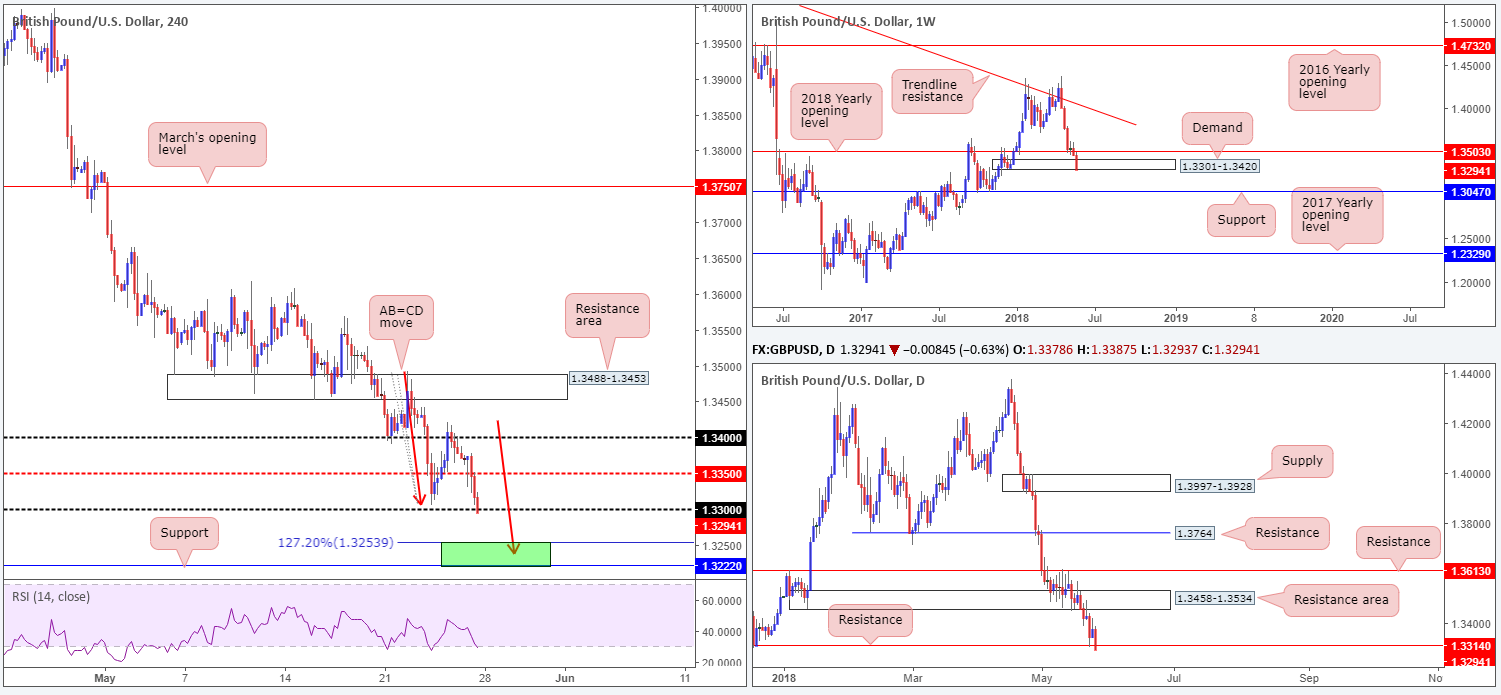
GBP/USD:
Weekly Gain/Loss: -1.32%
Weekly Closing price: 1.3294
After firmly nudging through the 2018 yearly opening level seen on the weekly timeframe at 1.3503 two weeks back, the British pound experienced additional losses last week. Molded in the form of a near-full-bodied weekly bearish candle, price finished the week closing marginally outside the walls of a nearby weekly demand at 1.3301-1.3420. The next support target on this scale can be found at 1.3047.
The story on the daily timeframe emphasizes just how severe selling pressure has been of late. Note that although we’ve dropped in excess of 1000 pips since mid-April, the unit has been unable to correct with any substance. In addition to this, the week ended with price slightly closing below daily support fixed at 1.3314. This is interesting since beneath here we do not see a whole lot of support until reaching 1.3063: a daily support that’s sited just north of the aforementioned weekly support.
Across on the H4 candles, it’s clear to see that the mid-level support 1.3350 was taken out amid early London trade on Friday. This, in turn, activated selling interest, closing out the day a touch beneath the 1.33 handle. What’s also notable from a technical perspective here is below 1.33 we have clean H4 support visible at 1.3222 and a nearby H4 AB=CD (red arrows) 127.2% Fib ext. completion point at 1.3253 (green zone).
Areas of consideration:
All three timeframes, at least according to our analysis, point to further depreciation: marginal closes below weekly demand, daily support and the 1.33 handle on the H4 scale. Further adding to this, we absolutely love the H4 AB=CD formation in play and believe it will eventually complete.
As such, intraday shorts beyond 1.33 are an option going forward, targeting the green H4 zone mentioned above at 1.3222/1.3253. In addition to being a take-profit zone, 1.3222/1.3253 could also be considered a buy zone. Yes, by entering long from here you’d effectively be trading into higher-timeframe flow, but a pullback up to 1.33 is certainly not out of the question, as far as we can see.
Today’s data points: Limited.
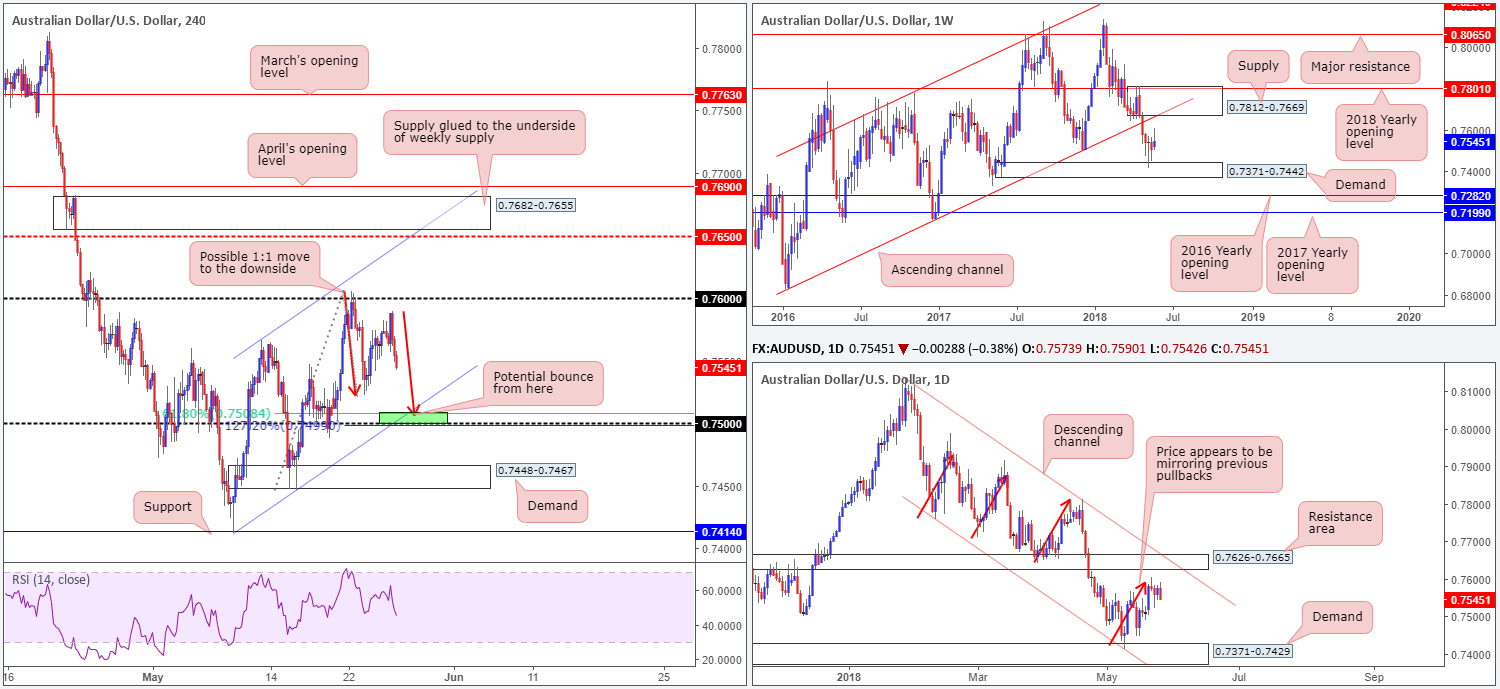
AUD/USD:
Weekly Gain/Loss: +0.47%
Weekly Closing price: 0.7545
Following back-to-back weekly bullish buying tails printed off/near weekly demand at 0.7371-0.7442, price made an earnest attempt to advance last week, clocking highs of 0.7605. Should the buyers come back in force this week, it’s possible the weekly supply zone at 0.7812-0.7669 and its intersecting weekly channel support-turned resistance (taken from the low 0.6827) are going to be brought into play.
Turning the focus down to the daily timeframe, price is clearly seen compressing within a descending channel formation (0.8135/0.7758) right now. Areas also worthy of note are the daily demand base at 0.7371-0.7429 and daily resistance area plotted at 0.7626-0.7665. It may also be worth penciling in that price is finding resistance around the 0.7590 mark, mirroring previous pullbacks (see red arrows), which could potentially spark a selloff as a result.
A quick recap of Friday’s trade on the H4 timeframe shows us that price came under renewed selling pressure just south of the 0.76 handle, weighed down by a resumption of greenback buying. Technically, this has set the stage for a possible 1:1 move down to a H4 127.2% Fib ext. point at 0.7508, which, as you can see, is also bolstered by a H4 channel support taken from the low 0.7412 and the 0.75 handle.
Areas of consideration:
Although 0.75 on the H4 timeframe has limited confluence off the higher timeframes, H4 confluence remains of interest. A H4 full or near-full-bodied bull candle printed from 0.75 would, in our technical view, be enough evidence to suggest that the buyers are interested in taking things higher.
Stop-loss orders are best placed beyond the confirming candle’s low. As for take-profit targets, the 38.2% H4 Fib resistance value of legs A-D can be used as a breakeven trigger, and the 61.8% H4 retracement value of legs A-D for the final take-profit target.
Today’s data points: Limited.
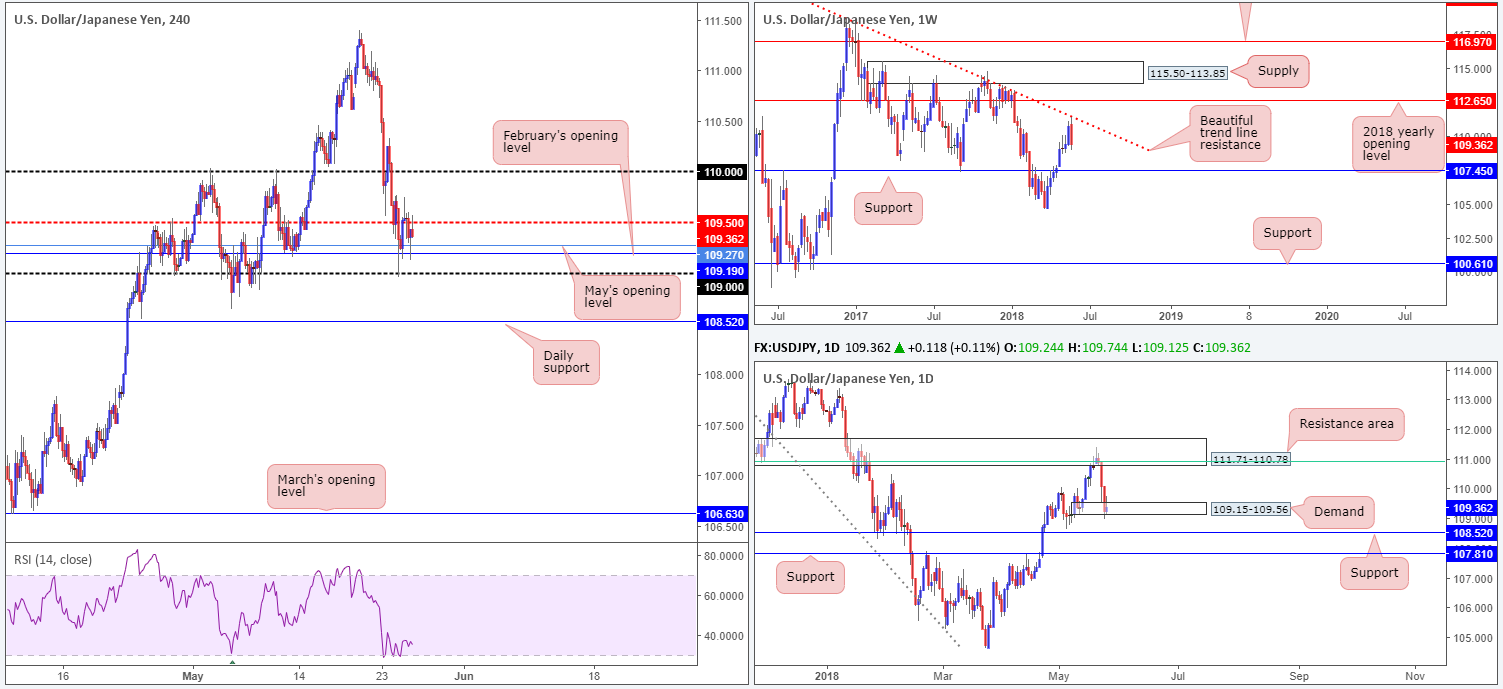
USD/JPY:
Weekly Gain/Loss: -1.24%
Weekly Closing price: 109.36
Over the course of last week’s movement, the sellers certainly brought their A game! Weekly price, as you can probably see, formed a nice-looking bearish engulfing candle off the underside of a particularly interesting weekly trend line resistance extended from the high 123.67. Continued selling from this point may bring weekly support penciled in at 107.45 into the fray this week.
Coming off a dominant selloff from a daily resistance area at 111.71-110.78, which happens to hold a 61.8% daily Fib resistance at 110.89 (drawn from the high 114.73), daily price remains engaging with demand printed at 109.15-109.56. Judging by the lack of enthusiasm seen here from the buyers, traders may want to prepare for the possibility that price wants to test nearby daily support plugged in at 108.52.
Looking at Friday’s action on the H4 timeframe reveals that price was reasonably subdued. After establishing support off both the 109 handle and its closely associated monthly opening levels (February and May) at 109.19/109.27, the nearby H4 mid-level number at 109.50, as expected, provided resistance.
Areas of consideration:
Having seen the week end printing a weekly bearish engulfing candle (breaking a strong bullish phase), alongside price currently trading around a reasonably fragile daily demand, we feel further selling could be in store. As such, shorting on the break/retest of 109 could be a play to keep an eye out for today/tomorrow, targeting daily support mentioned above at 108.52 as the initial port of call. The ultimate take-profit target should, according to the market’s structure, be set at weekly support brought in from 107.45.
Today’s data points: Limited.
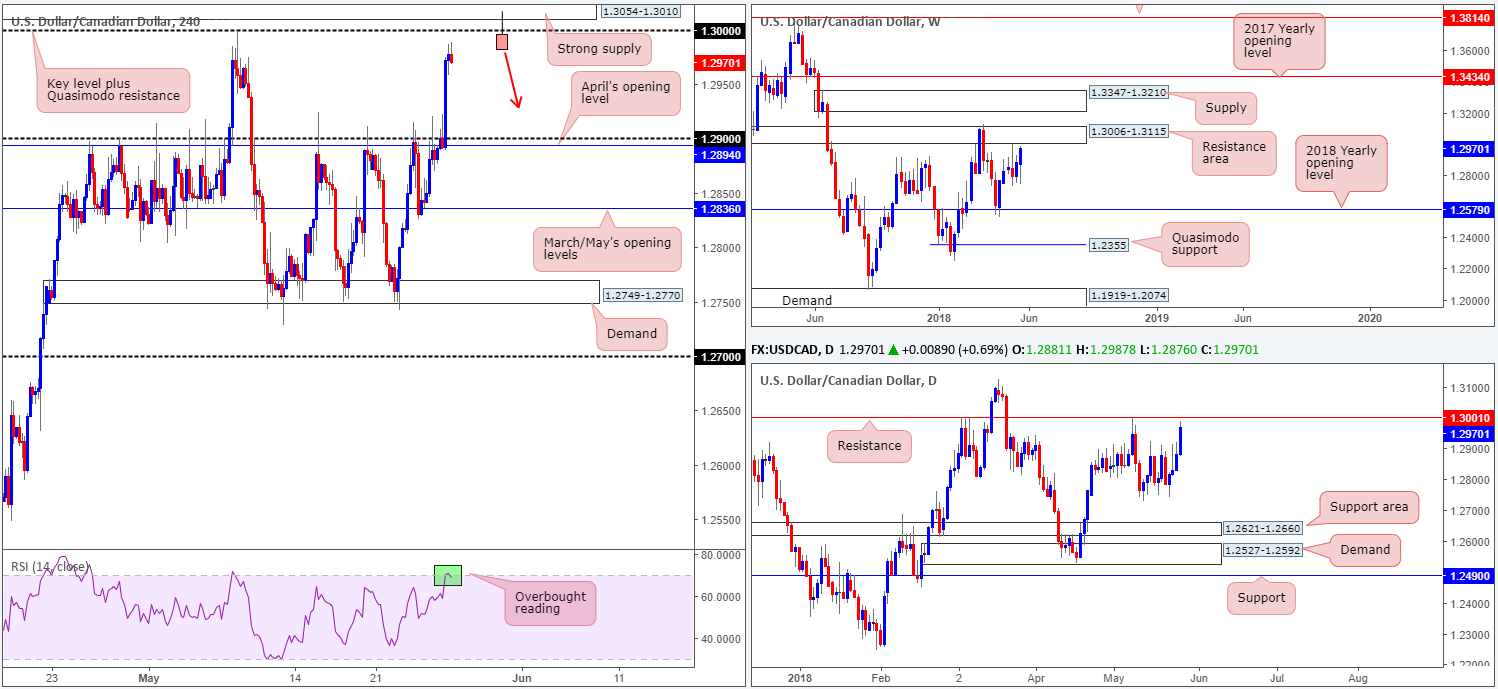
USD/CAD:
Weekly Gain/Loss: +0.71%
Weekly Closing price: 1.2970
The US dollar outperformed against the Canadian dollar last week, resulting in weekly price concluding trade closing just south of a weekly resistance area at 1.3006-1.3115. On that ground, traders should expect this area to be brought into the fight this week. In the event that the buyers continue to dominate, though, the next area of resistance on the weekly scale to be cognizant of is seen at 1.3347-1.3210: a weekly supply zone.
In similar fashion to the weekly scale, daily movement ended the week closing in reasonably strong fashion just ahead of resistance plotted at 1.3001. This level boasts strong historical significance dating back to late 2016, so overlook it at your peril!
On the back of weak oil prices, the H4 candles eventually conquered the 1.29 handle and closed within striking distance of the key 1.30 level, which also happens to be a Quasimodo resistance. Also worth noting is the strong H4 supply zone seen positioned a few pips above 1.30 at 1.3054-1.3010, as well as the H4 RSI indicator currently reading overbought.
Areas of consideration:
From our perspective, a selloff could be imminent.
An ideal sell signal, as far as we can see, would be for H4 price to produce a bearish pin-bar formation that pierces through 1.30 and tags the nearby noted supply (as per the chart drawing). Not only will this trip stop-loss orders above 1.30, creating a pool of liquidity to sell into, it will also bring in sellers from the said H4 supply which happens to be glued to the underside of the current weekly resistance area. Furthermore, let’s also remind ourselves that 1.30 also represents a daily resistance level.
This is some serious confluence at play here, traders!
The first take-profit target, as of current price, can be seen around the 1.29 neighborhood.
Today’s data points: Limited.
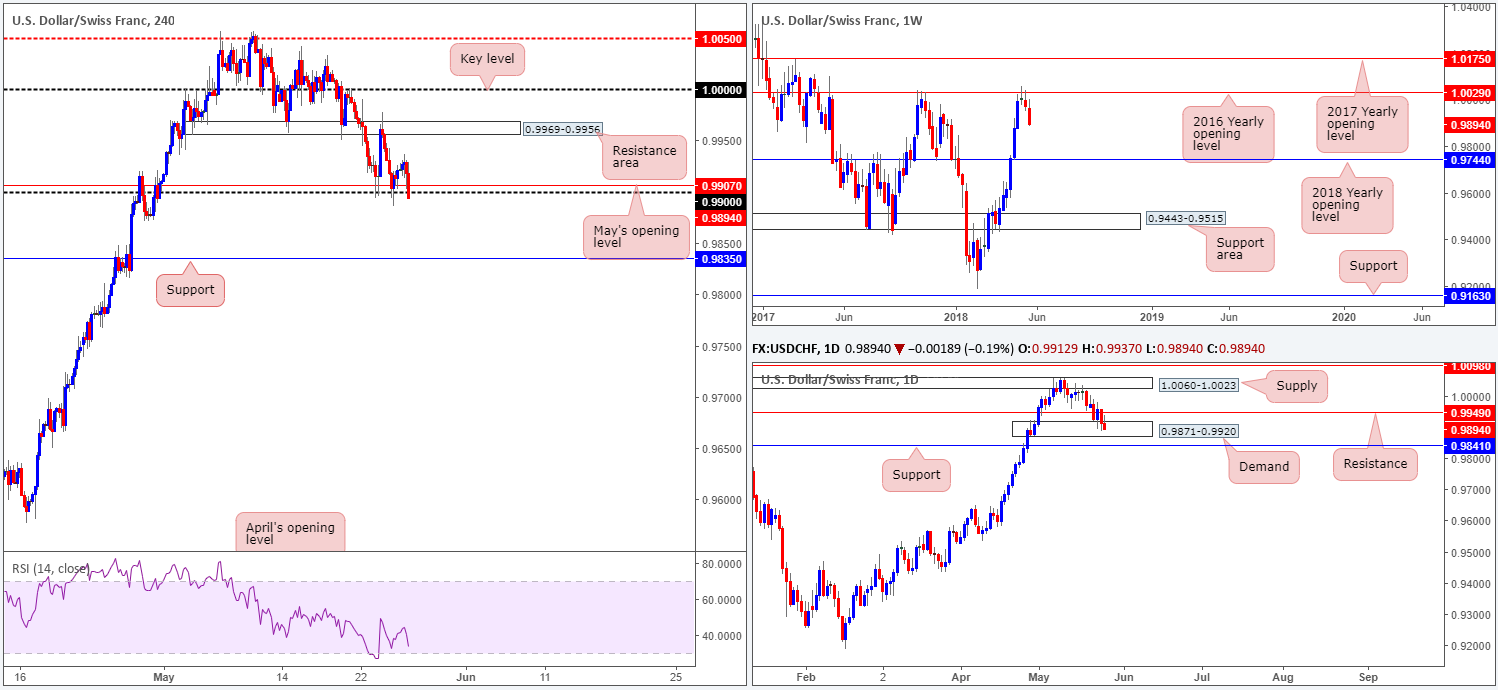
USD/CHF:
Weekly Gain/Loss: -0.73%
Weekly Closing price: 0.9894
Recent activity on the USD/CHF shows the pair extended its losses throughout last week’s movement, closing in the shape of a strong weekly bearish candle. In terms of weekly structure, there’s really not very much support seen in view until the unit reaches the 2018 yearly opening level marked at 0.9744.
On the daily timeframe, however, demand at 0.9871-0.9920 remains intact. Just! The area has unfortunately failed to produce anything meaningful to the upside due to nearby resistance coming in from 0.9949. In case of the current demand base failing to hold ground, nearby support situated at 0.9841 will, almost immediately, be brought into the fray.
Despite a modest bounce seen off 0.99 amid Thursday’s trade on the H4 timeframe, Friday’s action topped at highs of 0.9937 and sold off, taking out 0.99 along the way! Having seen limited effort from the buyers here, and considering there’s room to move lower on the weekly timeframe, as well as daily demand lacking energy, further selling is likely ahead.
Areas of consideration:
As H4 price recently crossed below 0.99 we feel this is a strong enough cue to begin considering shorts. Yes, price is still engaged with the nearby daily demand at 0.9871-0.9920, but overhead pressure from weekly sellers should be enough to overcome buying around this zone.
Therefore, keep eyes out for a solid retest of 0.99 as resistance for possible shorts. The first take-profit target from this point falls in around the daily support mentioned above at 0.9841, followed closely by H4 support noted at 0.9835.
Today’s data points: Limited.
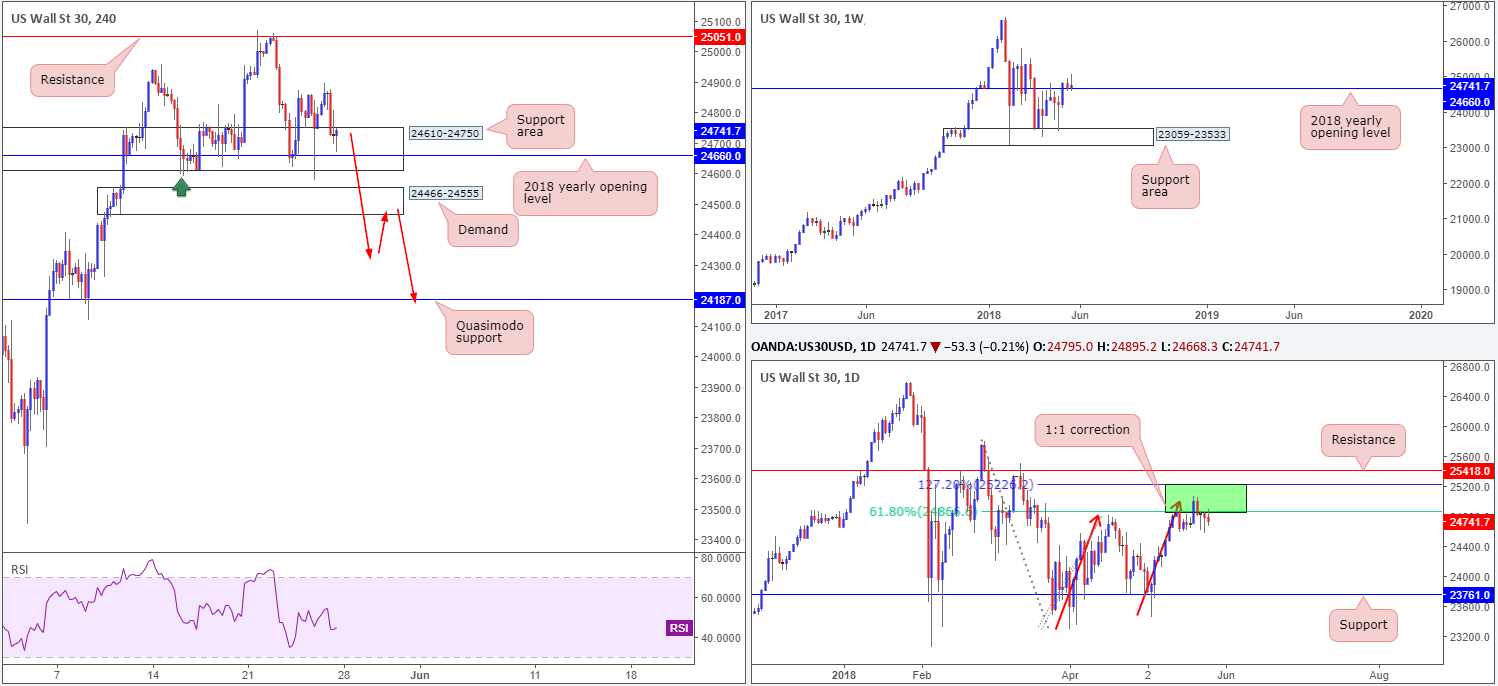
Dow Jones Industrial Average:
Weekly Gain/Loss: +0.15%
Weekly Closing price: 24741
As can be clearly seen on the weekly timeframe, the buyers remain struggling to develop after crossing above the 2018 yearly opening level at 24660. In fact, last week’s action chalked up a reasonably clear bearish pin-bar formation!
The reason behind the buyers struggle on the weekly scale is, technically speaking, likely down to daily sellers currently putting up a strong fight from 25229/24866. The area marked in green is comprised of a 61.8% daily Fib resistance value and a 127.2% 1:1 correction (see red arrows) daily Fib ext. point.
Surrounding the 2018 yearly opening level mentioned above on the weekly timeframe is a H4 support area coming in at 24610-24750. H4 momentum, however, looks somewhat weary as price has struggled to print anything noteworthy from here over the past couple of sessions. Also, the fact that the unit spiked beyond the swing H4 low marked with a green arrow at 24591 is an indication of bullish weakness, in our view. A break of the current support area will likely bring in buyers from a H4 demand base penciled in at 24466-24555.
Areas of consideration:
In essence, this market signifies a potential breakdown on the side of the bulls, despite weekly price remaining above the 2018 yearly opening band.
As a result of this, entering into long positions is not something the team would label as high probability. Shorting, on the other hand, is a possibility on the break of the noted H4 demand area. A H4 close beneath here, followed up with a retest as resistance (as per red arrows), is likely enough evidence to begin considering shorts down to the H4 Quasimodo support level marked at 24187.
As a reminder, limited movement is expected due to US banks being closed in observance of Memorial Day.
Today’s data points: Limited.
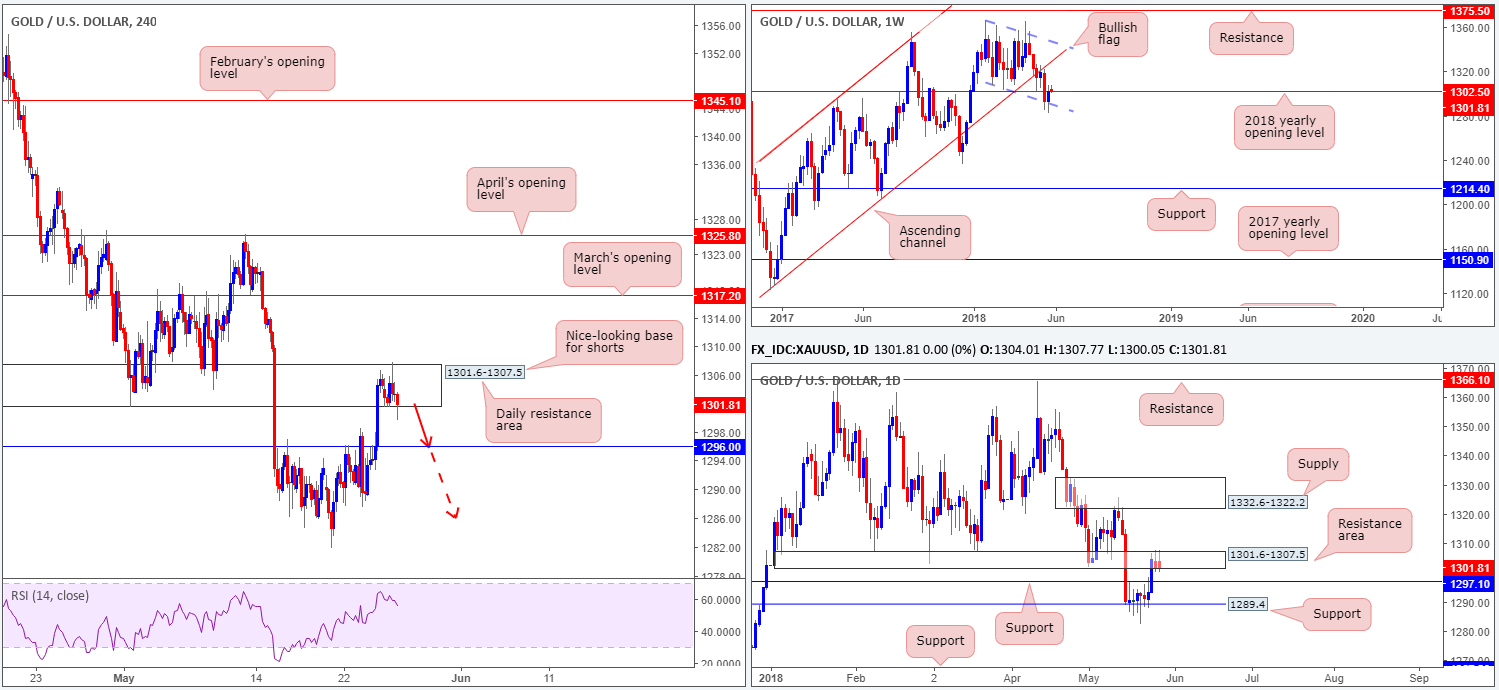
XAU/USD (Gold)
Weekly Gain/Loss: +0.65%
Weekly Closing price: 1301.8
The price of gold established a base of support off the lower edge of a weekly bullish flag formation (taken from the low 1346.1) last week, and ended the segment retesting the underside of the 2018 yearly opening level at 1302.5. Given these yearly numbers tend to hold reasonably well, traders should clear the decks for a potential move lower this week.
Following a modest advance from daily support plugged at 1289.4, in which we observed a break of daily resistance at 1297.1 (now acting support), the pair shook hands with a daily resistance area at 1301.6-1307.5 and formed a particularly interesting daily bearish candle. A notable point from here is the fact that the 2018 yearly opening level mentioned above on the weekly timeframe resides within this area.
Moving across to the H4 structure, it quickly becomes apparent that Friday’s movement was somewhat stale. Price spent the day consolidating within the confines of the noted daily resistance area. Despite this, we still favor an eventual push lower from this area, at least until H4 support notched in at 1296.0, which is actually positioned a touch beneath the daily support mentioned above at 1297.1.
Areas of consideration:
For those who remain short this market from the current daily resistance area, holding tight and waiting for price to reach its first port of call: H4 support at 1296.0 is likely the best path to take, as so far the H4 candles continue to reflect a bearish stance. Ultimately you should be on the lookout for a H4 close beneath 1296.0. This would, in our opinion, be an ideal signal to consider reducing risk to breakeven and taking partial profits off the table. The next area of interest beneath this point can be found at the daily support mentioned above at 1289.4.
The use of the site is agreement that the site is for informational and educational purposes only and does not constitute advice in any form in the furtherance of any trade or trading decisions.
The accuracy, completeness and timeliness of the information contained on this site cannot be guaranteed. IC Markets does not warranty, guarantee or make any representations, or assume any liability with regard to financial results based on the use of the information in the site.
News, views, opinions, recommendations and other information obtained from sources outside of www.icmarkets.com.au, used in this site are believed to be reliable, but we cannot guarantee their accuracy or completeness. All such information is subject to change at any time without notice. IC Markets assumes no responsibility for the content of any linked site. The fact that such links may exist does not indicate approval or endorsement of any material contained on any linked site.
IC Markets is not liable for any harm caused by the transmission, through accessing the services or information on this site, of a computer virus, or other computer code or programming device that might be used to access, delete, damage, disable, disrupt or otherwise impede in any manner, the operation of the site or of any user’s software, hardware, data or property.


