
DXY:
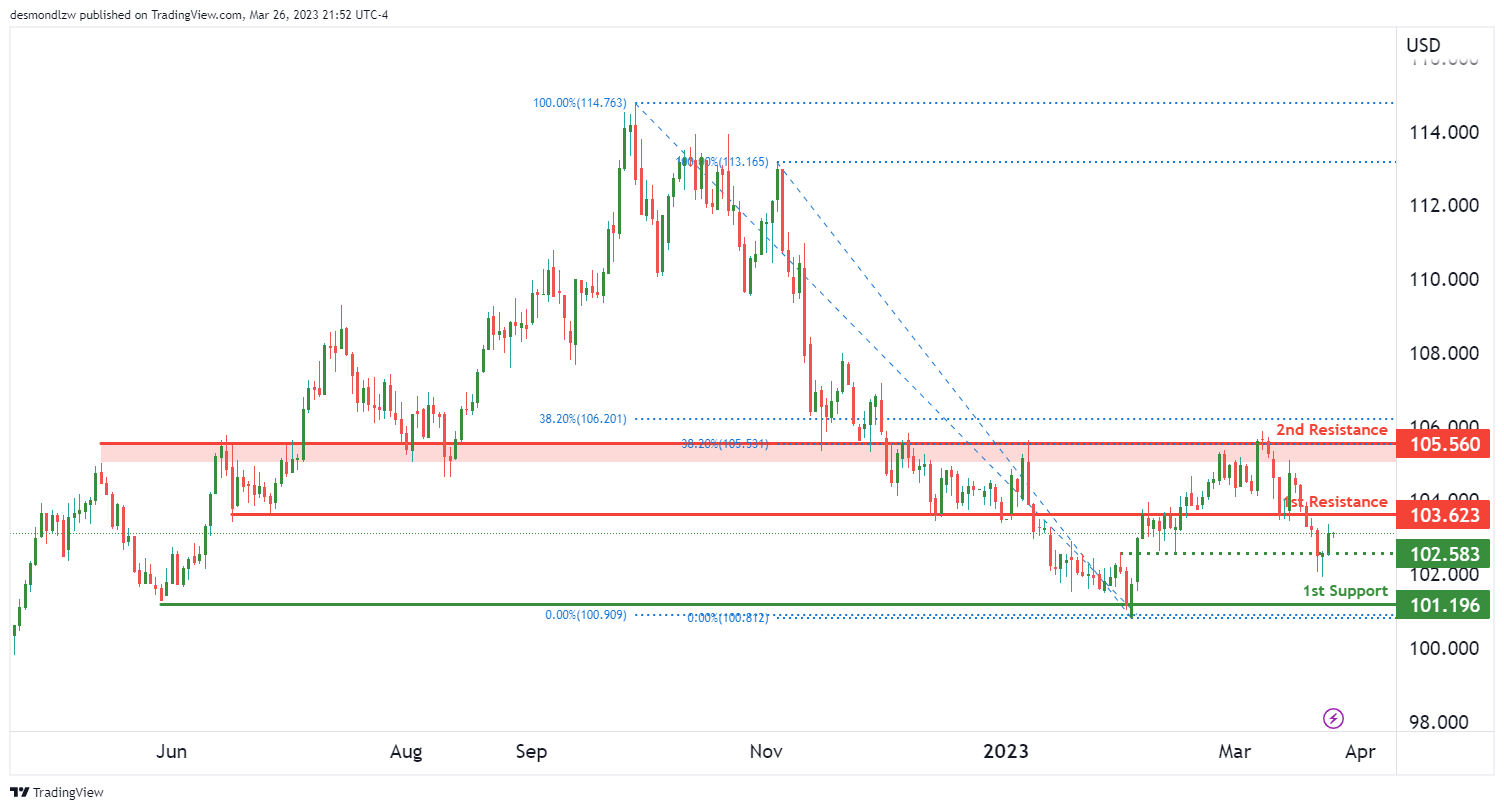
Looking at the DXY chart, the overall momentum is bullish, suggesting that prices may continue to rise. Price could potentially make a bullish continuation towards the 1st resistance level at 103.62.
On the support side, the 1st support level is at 101.19, which is a multi-swing low support level. This level has held prices up in the past, making it a strong level of buying interest. Additionally, there is an intermediate support level at 102.58, which is an overlap support level.
On the resistance side, the 1st resistance level is at 103.62, which is an overlap resistance level. If the price were to break through this resistance, it could potentially rise towards the 2nd resistance level at 105.56. This level is also an overlap resistance level and has a 38.20% Fibonacci retracement lining up with it.
EUR/USD:
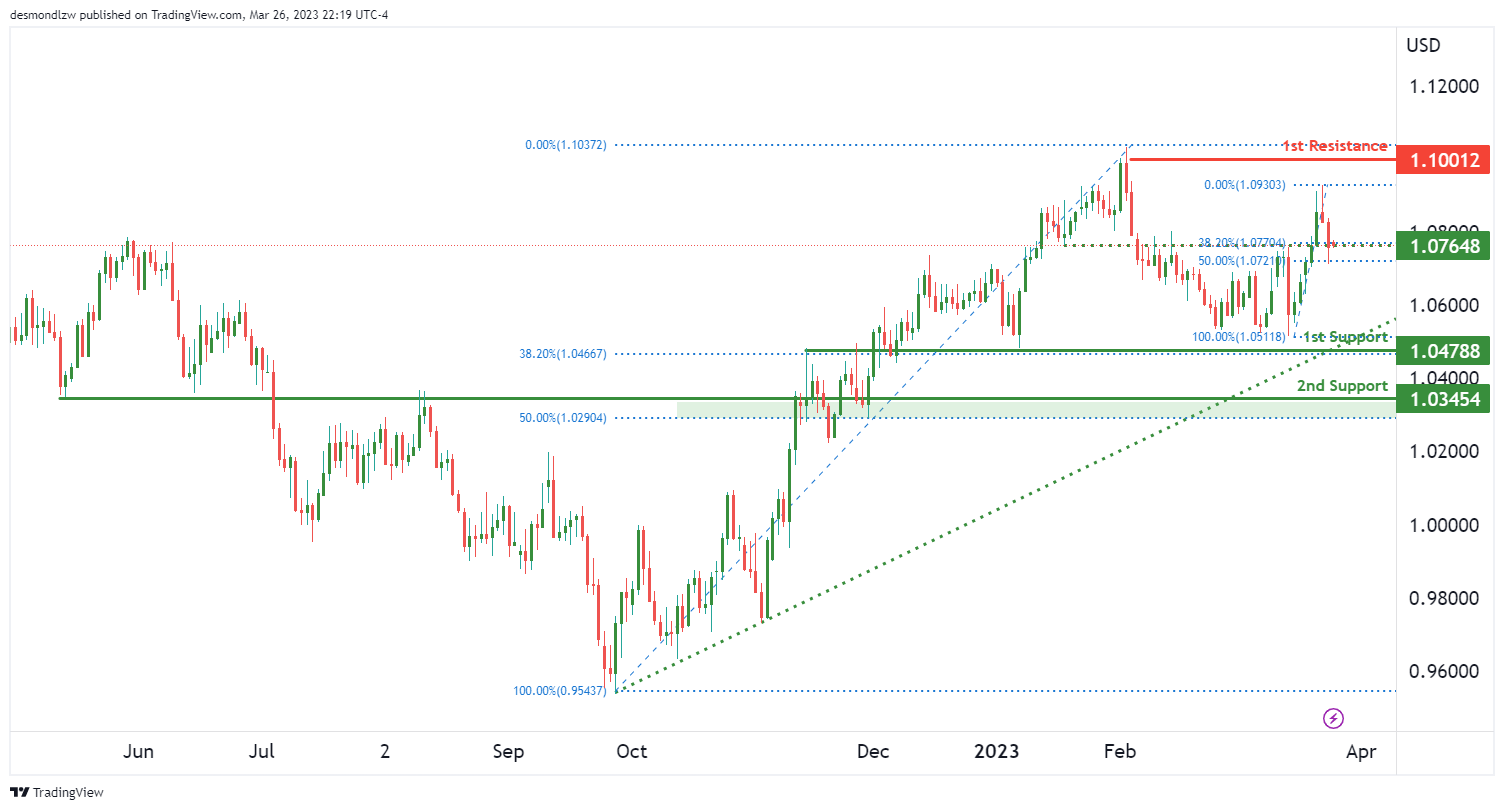
Looking at the EUR/USD chart, the overall momentum appears to be bearish. As such, price could potentially make a bearish continuation towards the 1st support level at 1.0478. This level is an overlap support and also has a 38.20% Fibonacci retracement lining up with it, which makes it a strong level of support. If the price were to break below this level, it could drop further towards the 2nd support level at 1.0345. This level is also an overlap support and has a 50% Fibonacci retracement lining up with it.
On the resistance side, the 1st resistance level is at 1.1001. This level is a swing high resistance and could provide strong selling pressure. There is also an intermediate support level at 1.0764, which is an overlap resistance and has a 38.20% Fibonacci retracement lining up with it. If the price were to break above this level, it could potentially rise towards the 1st resistance level.
GBP/USD:
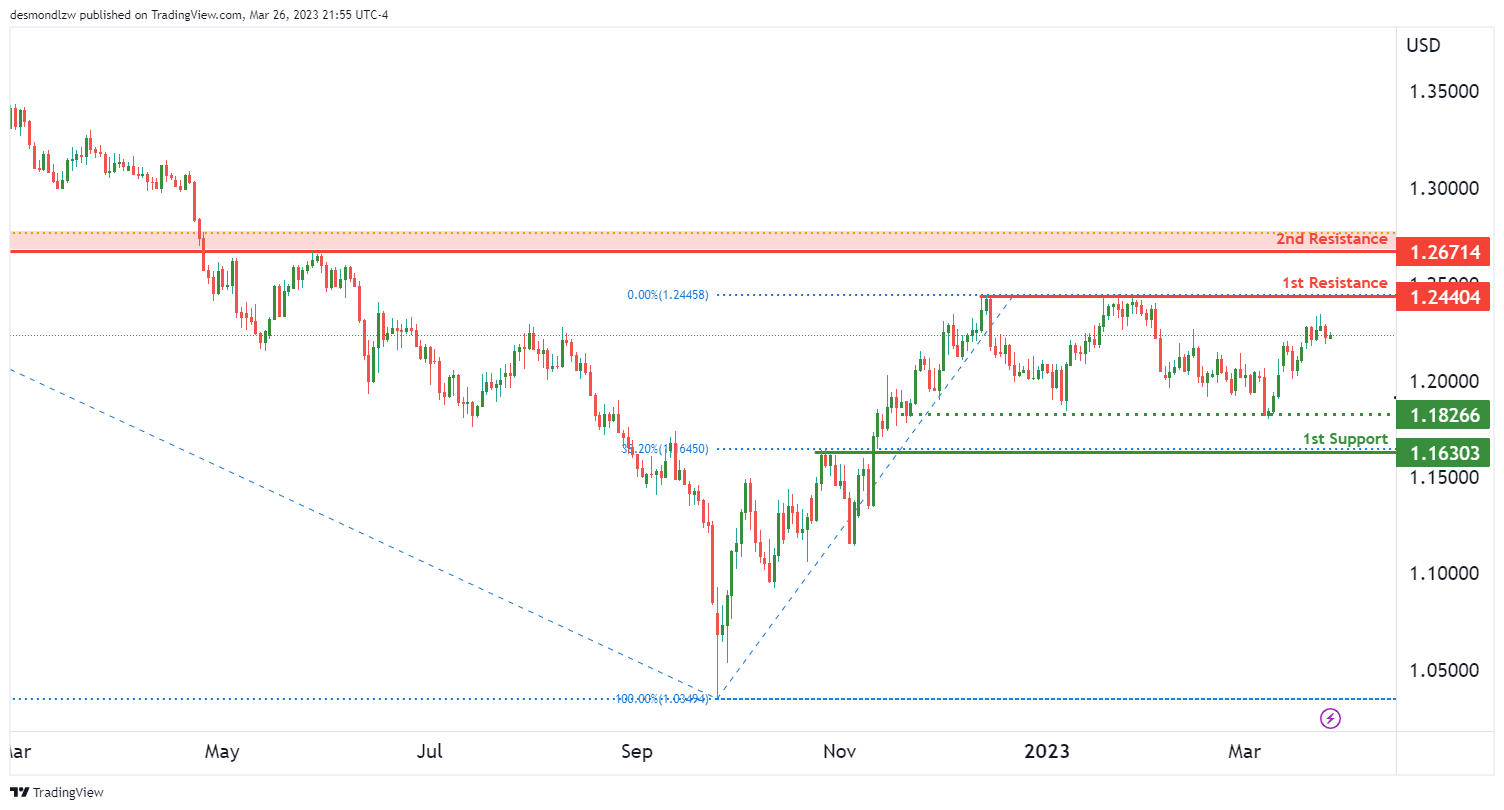
The GBP/USD chart’s overall momentum is currently neutral, suggesting that the price may fluctuate between the 1st resistance and 1st support levels.
The 1st support level is at 1.1630, and it’s an overlap support with a 38.20% Fibonacci retracement lining up with it. This level may act as a strong buying interest area. Additionally, there is an intermediate support level at 1.1826, which could act as a pullback support if price were to drop from the current level.
On the resistance side, the 1st resistance level is at 1.2440, and it’s a swing high resistance. If price were to rise from the current level, it could face selling pressure at this level. The 2nd resistance level is at 1.2671, which is also an overlap resistance.
USD/CHF:
The USD/CHF chart is currently showing bullish momentum, suggesting that prices may continue to rise. The first support level is at 0.9083, which is a swing low support level. This support level is a good level to watch as it could potentially provide a bullish bounce towards the first resistance level at 0.9428. This resistance level is an overlap resistance and has a 38.20% Fibonacci retracement lining up with it. If price were to break above this resistance level, it could potentially rise towards the second resistance level at 0.9605, which is a swing high resistance level.
On the downside, if the price were to break below the first support level at 0.9083, it could potentially drop further towards the second support level at 0.8937, which is a multi-swing low support level.
It’s worth noting that there is an intermediate resistance level at 0.9373, which could act as a pullback resistance if price were to rise from the current level. Conversely, there is an intermediate support level at 0.9230, which could act as a pullback support if price were to drop from the current level.
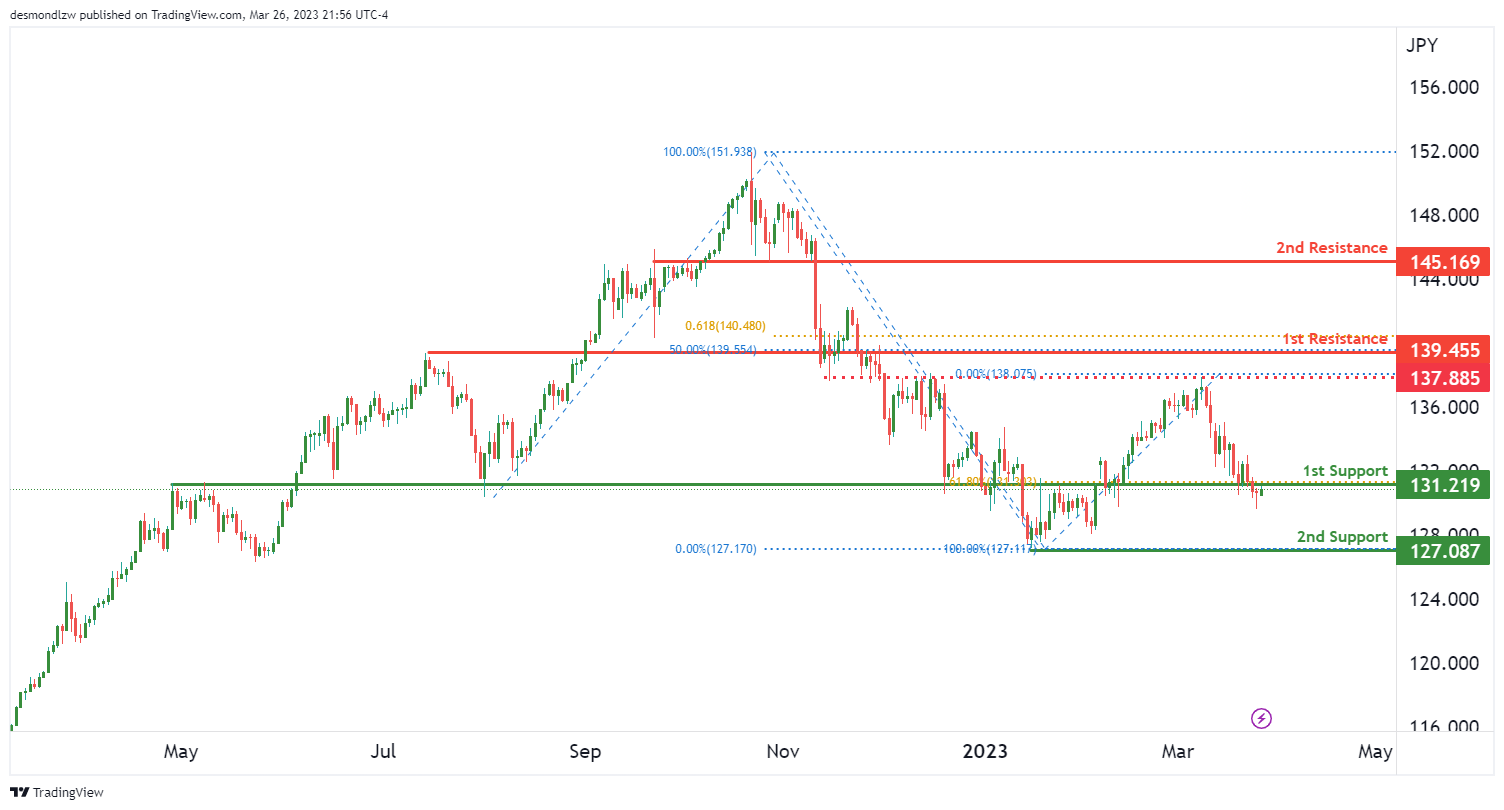
USD/JPY:
The USD/JPY chart currently shows bullish momentum, suggesting that prices may continue to rise further. The price could potentially make a bullish bounce off the 1st support level at 131.2100, which is an overlap support level and has a 61.80% Fibonacci retracement lining up with it. If the price were to bounce from this level, it could head towards the 1st resistance level at 139.4500, which is also an overlap resistance level and coincides with a 50% Fibonacci retracement.
It’s worth noting that there is an intermediate resistance level at 137.8800, which is an overlap resistance level that price could face before heading towards the 1st resistance level. On the support side, the 2nd support level at 127.0800 is a multi-swing low support level that price has bounced off multiple times in the past.
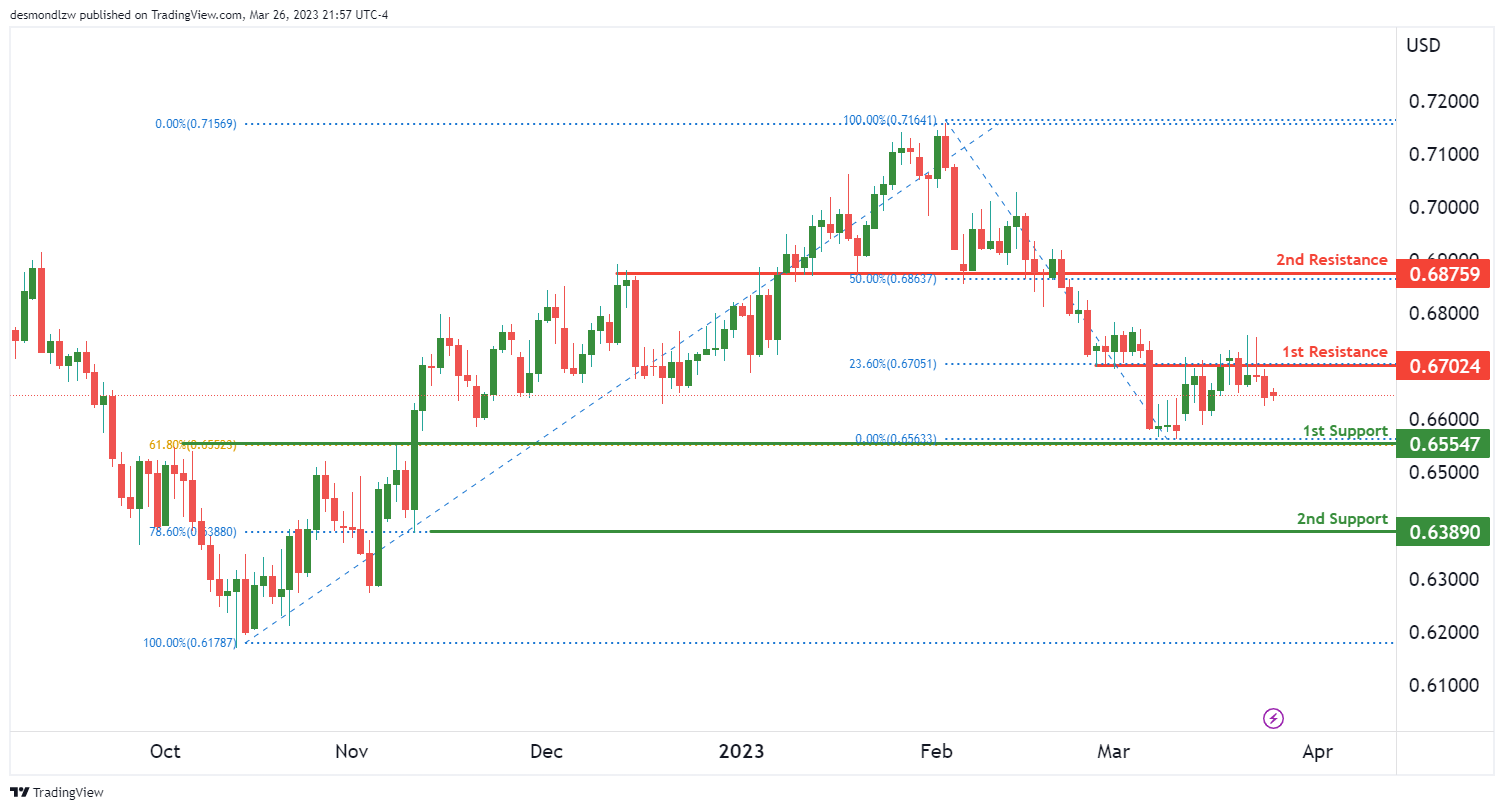
AUD/USD:
The overall momentum of the AUD/USD chart is currently bearish. This means that there is a higher likelihood of prices decreasing in the future. The price of AUD/USD could potentially make a bearish continuation towards the first support level.
The first support level is located at 0.6554, which is a strong overlap support and coincides with a 61.80% Fibonacci retracement level. This level has held as support in the past, making it a good potential target for a bounce.
If the price were to continue to drop, the second support level is located at 0.6389, which is an overlap support and lines up with a 78.60% Fibonacci retracement level. This level has also held as support in the past, further supporting its potential as a target for a bounce.
On the other hand, if the price were to increase, the first resistance level is located at 0.6702, which is an overlap resistance and coincides with a 23.60% Fibonacci retracement level. If the price were to break above this level, it could potentially push the price up towards the second resistance level at 0.6875. This level is also an overlap resistance and lines up with a 50% Fibonacci retracement level.
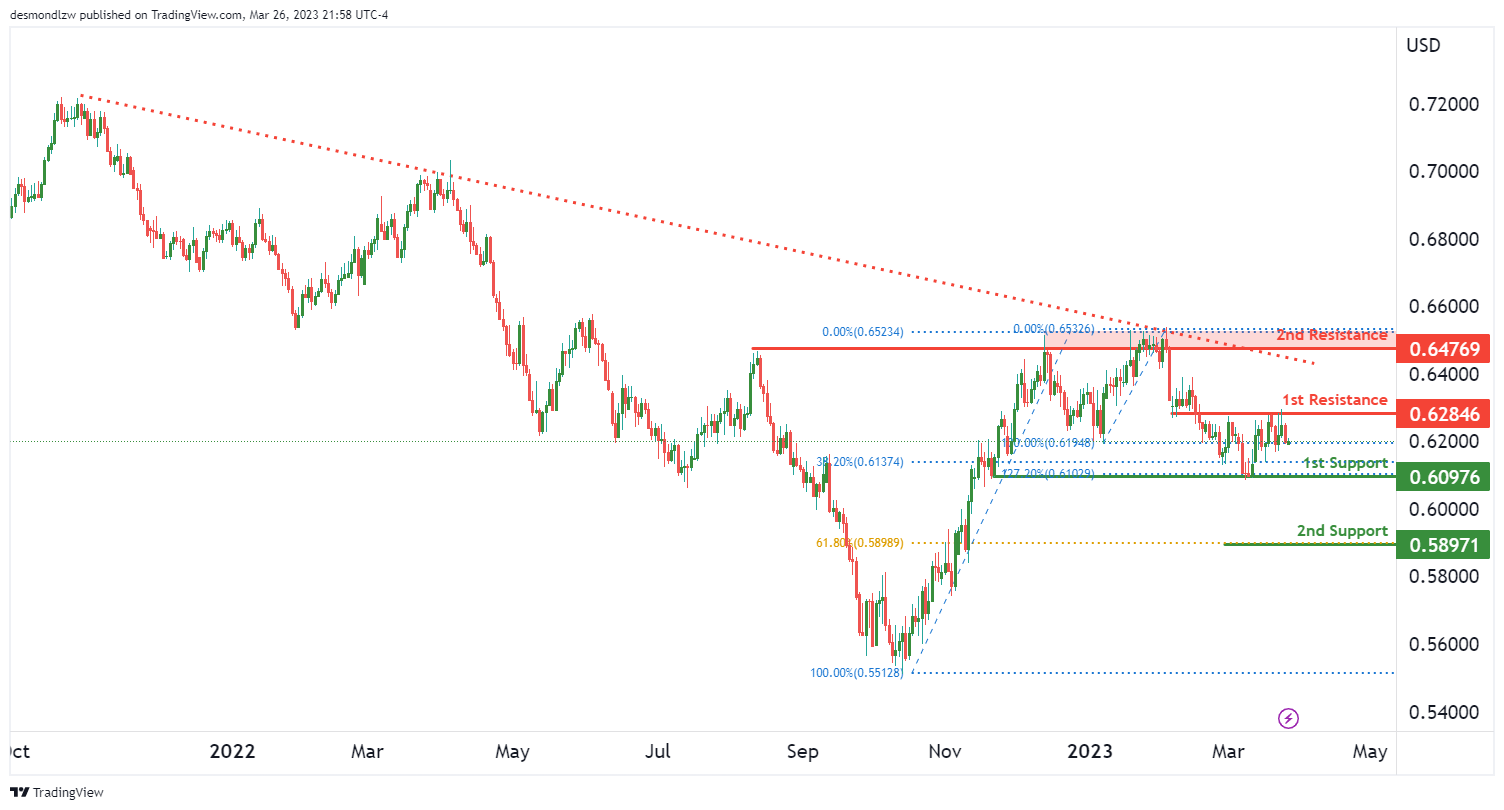
NZD/USD:
The overall momentum of the NZD/USD chart is currently neutral. As the price fluctuates between the 1st resistance and 1st support levels, it’s unclear which direction the momentum will ultimately take.
For support, the 1st support level is at 0.6097, which is a multi-swing low support level and coincides with a 38.20% Fibonacci retracement level. If the price were to drop below this level, the next level of support would be at 0.5897, which is a swing low support level and coincides with a 61.80% Fibonacci retracement level.
On the other hand, for resistance, the 1st resistance level is at 0.6284, which is an overlap resistance level. If the price were to rise above this level, the next level of resistance would be at 0.6476, which is also an overlap resistance level.
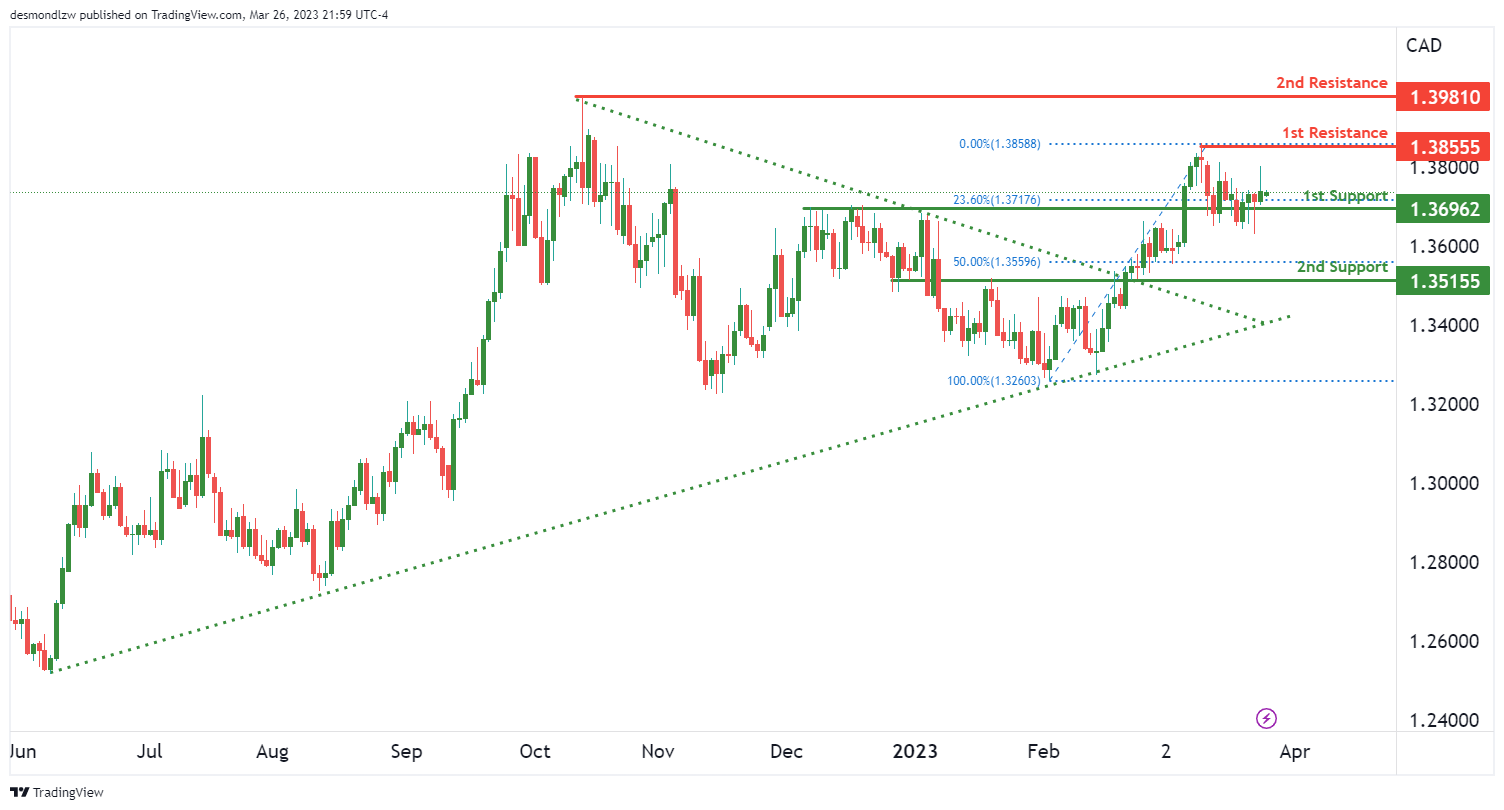
USD/CAD:
The USD/CAD chart is showing bullish momentum as the price has broken above a descending resistance line, suggesting a potential bullish move. This could potentially lead to a bullish bounce off the 1st support level towards the 1st resistance level. The 1st support level is located at 1.3696, which is an overlap support and has a 23.60% Fibonacci retracement lining up with it. The 2nd support level is at 1.3515, which is also an overlap support and coincides with a 50% Fibonacci retracement. The 1st resistance level is at 1.3855, which is a swing high resistance. Lastly, the 2nd resistance level is at 1.3981, which is another swing high resistance level. These levels could potentially act as key areas for the price to react and should be watched closely.
DJ30:
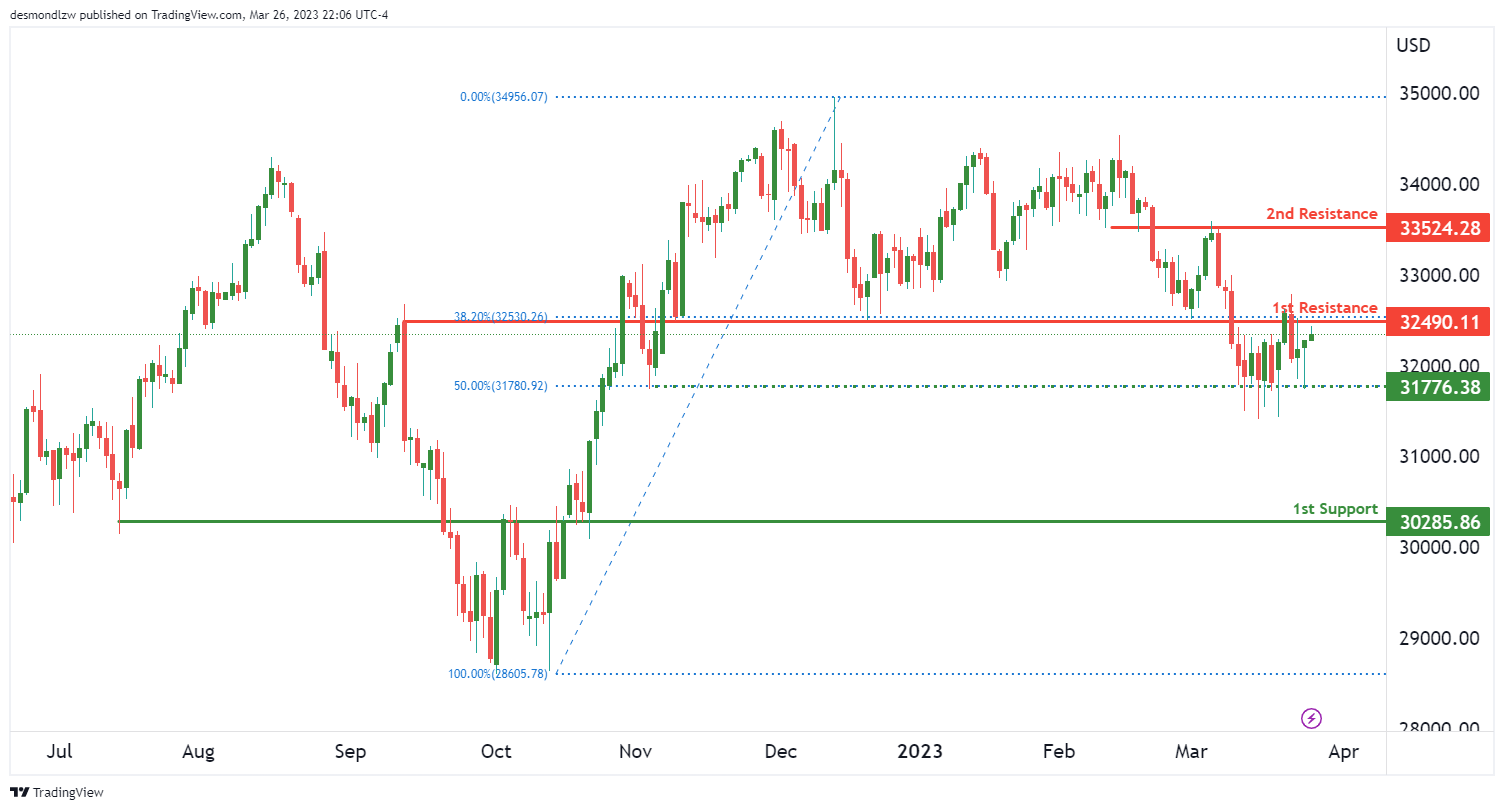
The overall momentum of the chart is bullish, indicating that we may see a continuation of an uptrend. Price could potentially make a bullish break through the first resistance and rise towards the second resistance.
The first support level is at 30285, which is an overlap support level that may provide some price support if the price were to drop. The intermediate support level is at 31776, which is a multi-swing low support level and is also at the 50% Fibonacci retracement level.
The first resistance level is at 32490, which is an overlap resistance level and is also at the 38.20% Fibonacci retracement level. If the price were to break through this resistance, it could potentially rise towards the second resistance level at 33524, which is also an overlap resistance level.
It’s worth noting that the price may fluctuate between these levels before breaking out. However, the bullish momentum suggests that there is a higher probability of a breakout towards the upside.
GER30:
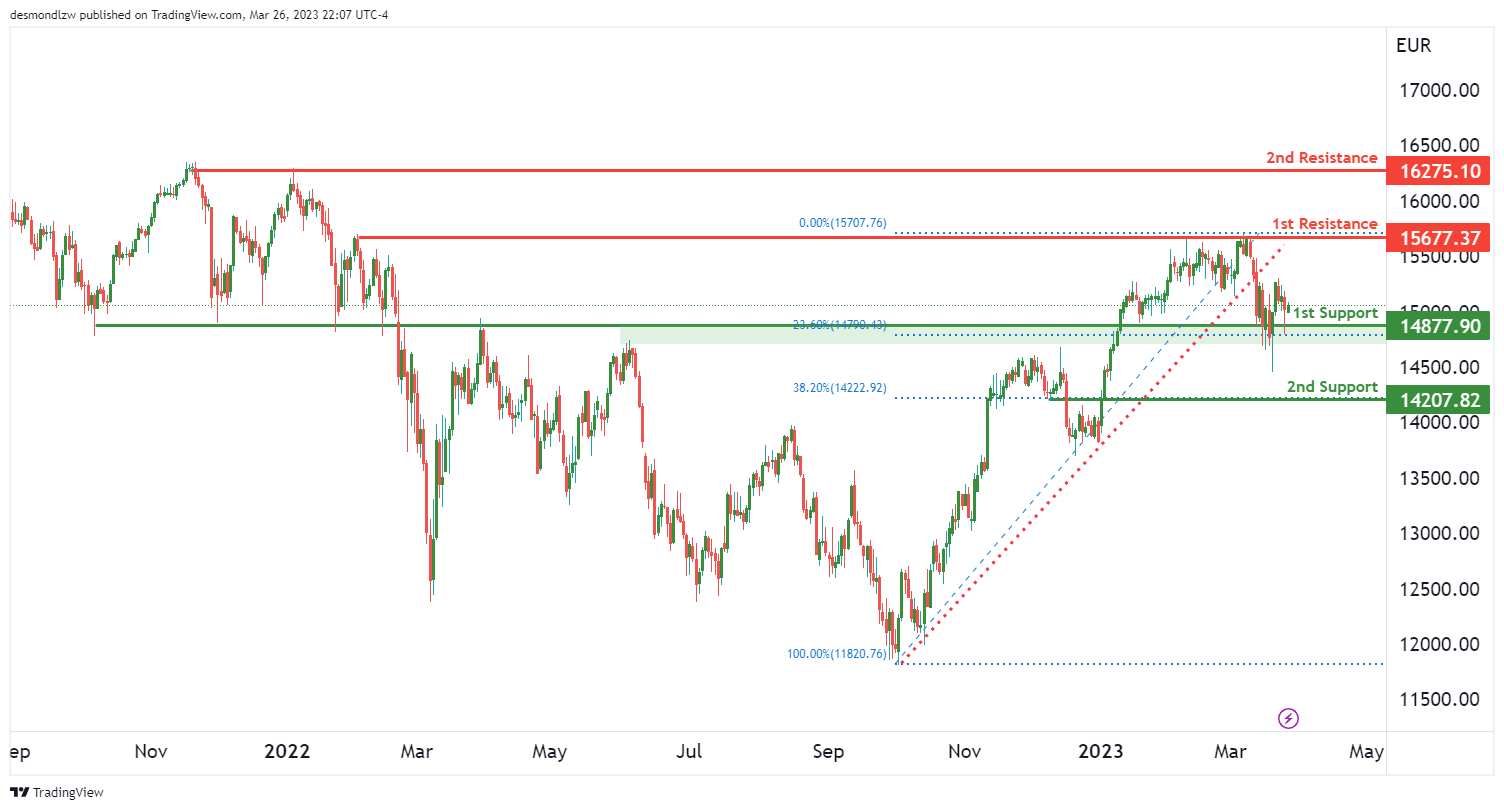
The GER30 chart is currently showing bearish momentum, as it broke below an ascending support line. The overall momentum of the chart is bearish, which suggests that the price may continue to fall.
At the moment, the price could potentially make a bearish break off the first support level at 14877 and drop towards the 2nd support level at 14207. The 1st support level is a good level as it is an overlap support level and has a 23.60% Fibonacci retracement level lining up with it. The 2nd support level is also a good level as it is an overlap support level and has a 38.20% Fibonacci retracement level lining up with it.
On the upside, the 1st resistance level at 15677 is a good level to watch as it is a swing high resistance level. The 2nd resistance level at 16275 is also a good level to watch as it is a multi-swing high resistance level.
BTC/USD:
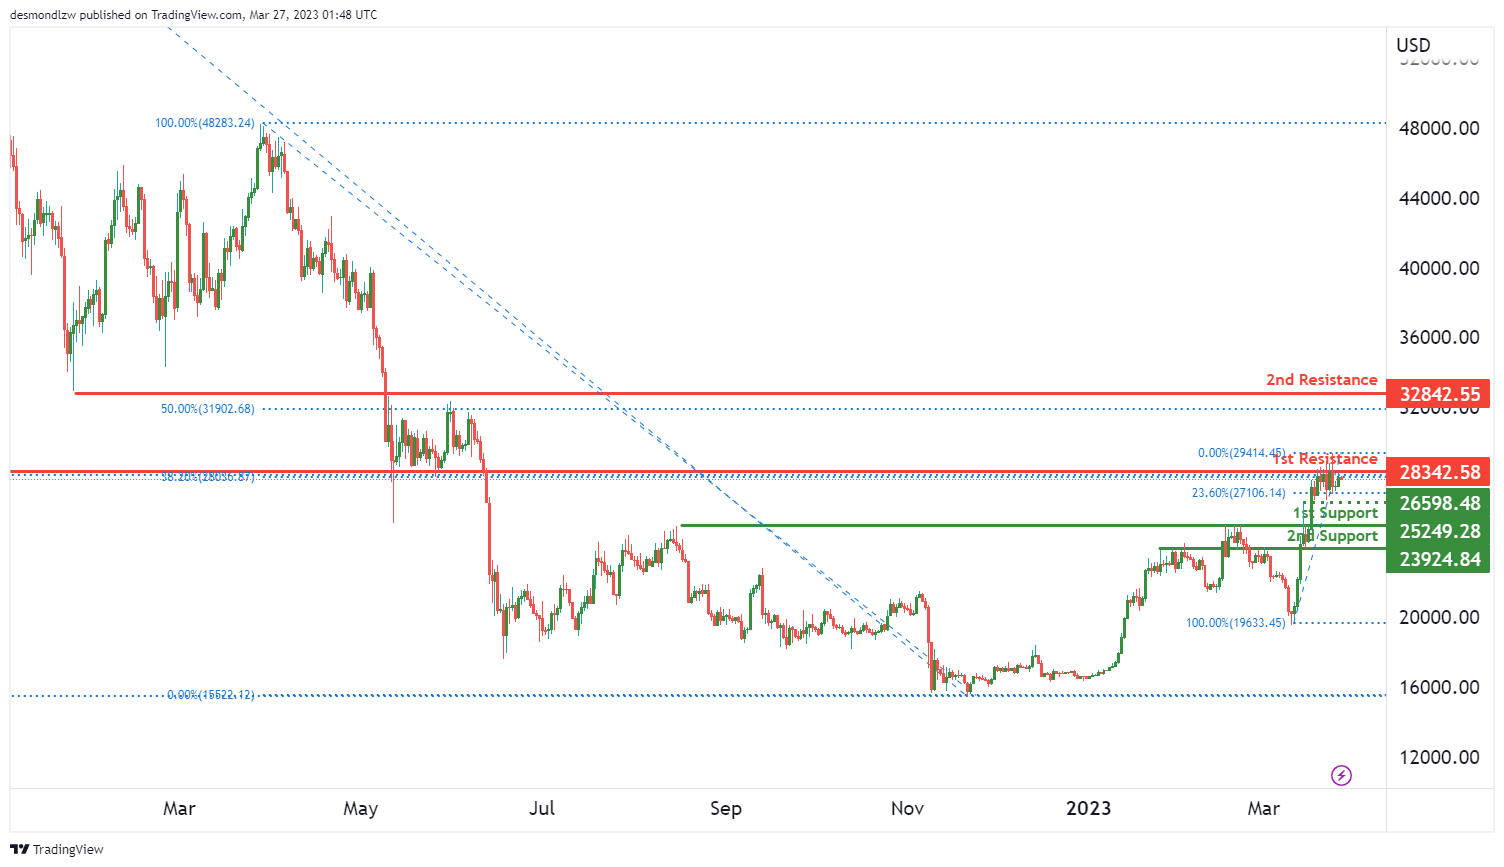
BTC/USD Shows Bearish Momentum with Potential for Drop to Support
Bitcoin has been showing bearish momentum on its chart against the US dollar, with potential for a drop to the first support level. The overall momentum of the chart is bearish, suggesting that prices may continue to fall in the near future.
At the moment, BTC/USD could potentially make a bearish reaction off the first resistance level, dropping down to the first support. The first support level is at 25249, which is an overlap support level. If prices were to break through this support, they could drop down to the second support at 23924, which is another overlap support level.
On the other hand, the first resistance level is at 28342, which is an overlap resistance level with a 38.20% Fibonacci retracement. If prices were to break through this resistance, they could rise up to the second resistance level at 32842, which is also an overlap resistance level and a 50% Fibonacci retracement.
It’s worth noting that there is an intermediate support level at 26598, which is a swing low support. If prices were to drop to this level, it could potentially trigger a rebound towards the first resistance level.
US500
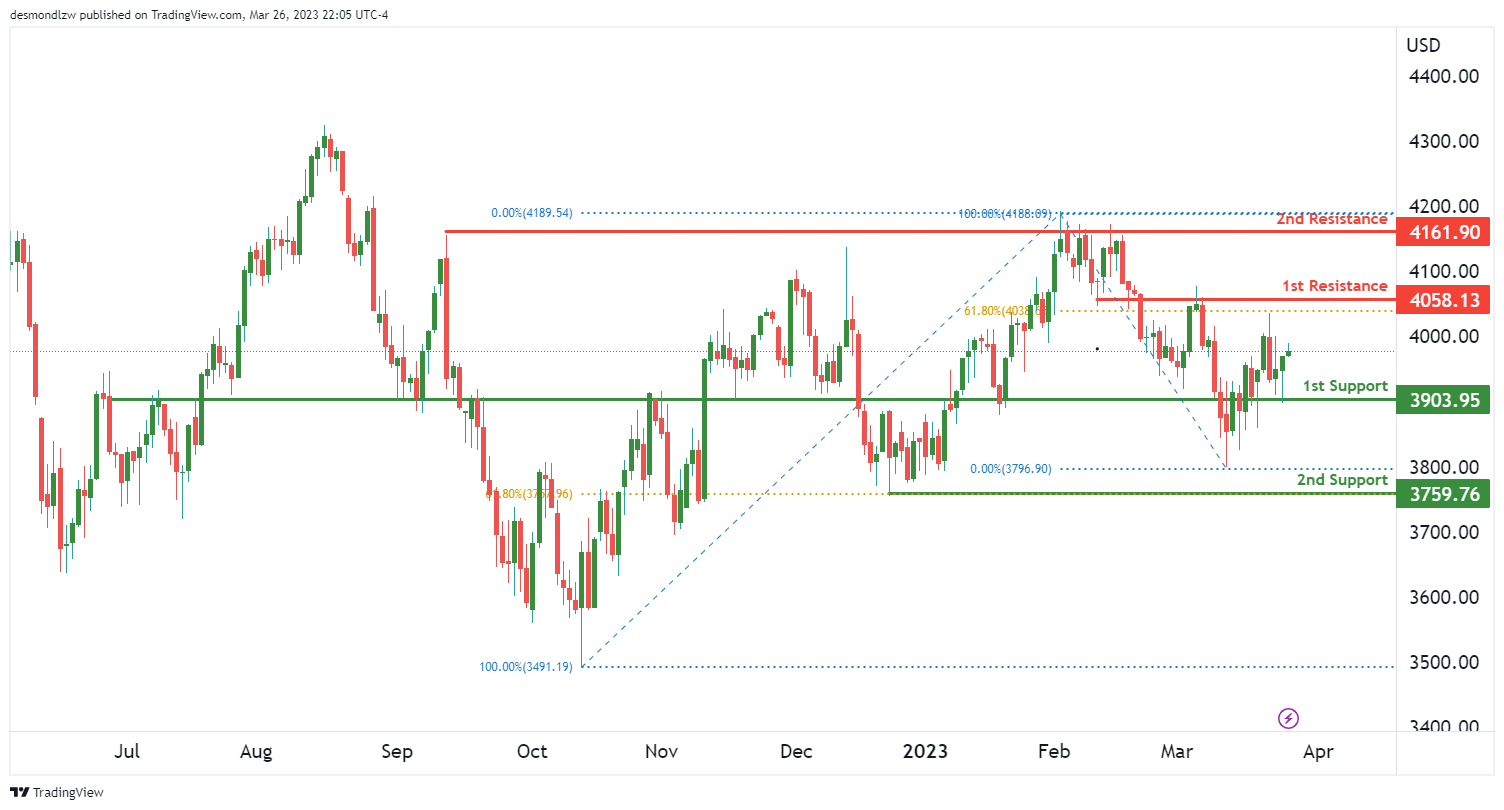
The US500 index is currently exhibiting bullish momentum, and it could potentially continue its upward trend towards the first resistance level. The first support level is at 3903.95 and it is a good level because it has acted as an overlap support in the past. The second support level at 3759.76 is also a good level because it is a swing low support and coincides with the 61.80% Fibonacci retracement level.
On the upside, the first resistance level at 4058.13 is a good level because it has acted as an overlap resistance in the past and coincides with the 61.80% Fibonacci retracement level. The second resistance level at 4161.00 is also a good level because it is a multi-swing high resistance level.
Traders should keep an eye on the price action around these levels to determine potential entry and exit points for trades. If the price breaks above the resistance levels, it could indicate further bullish momentum, while a drop below the support levels could indicate a shift to bearish momentum.
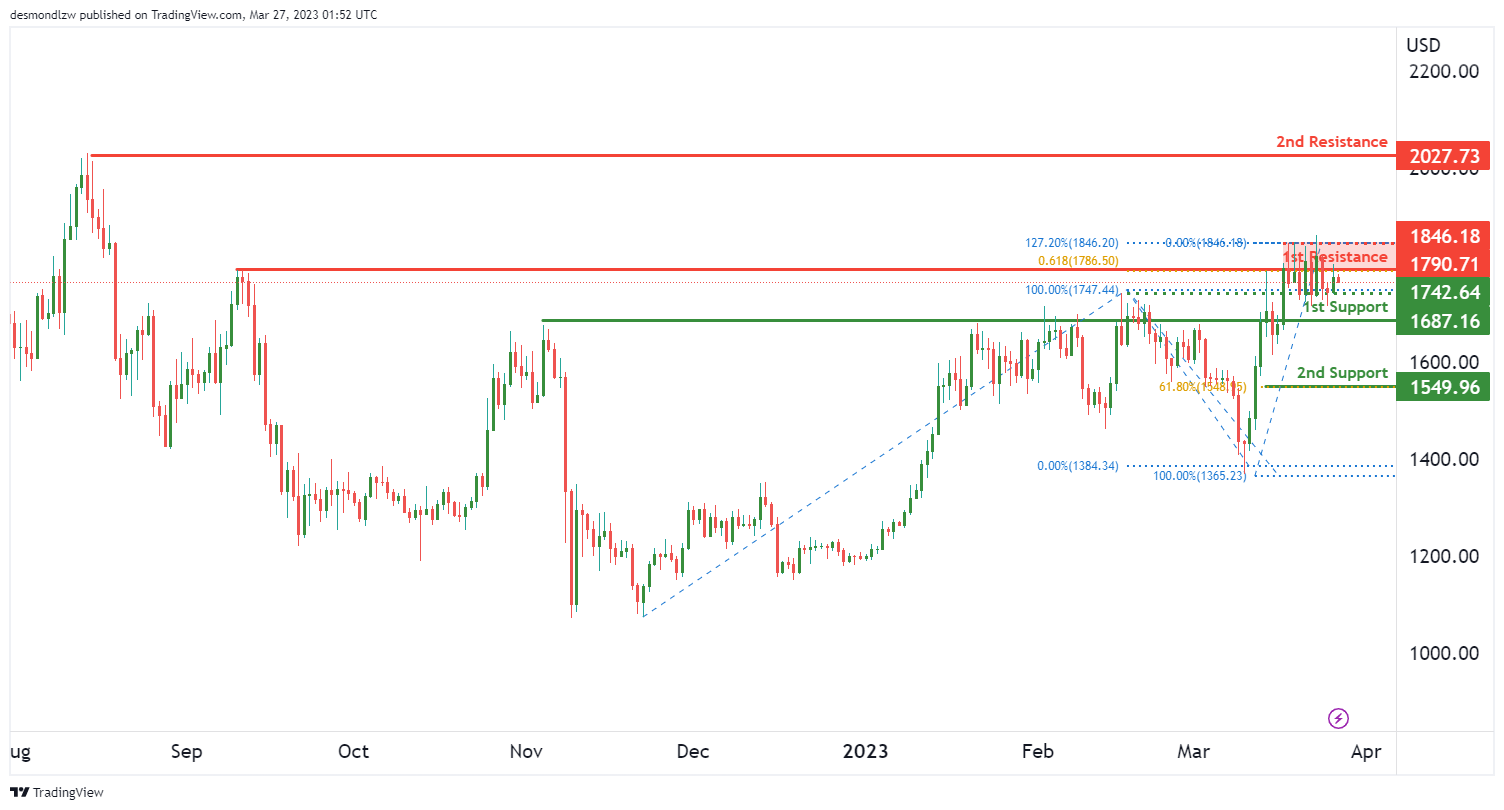
ETH/USD:
According to the analysis, the overall momentum of the ETH/USD chart is bearish. The price is expected to have a bearish reaction off the first resistance level and drop towards the first support level.
The first support level is at 1687.16 and is considered a good support level because it is an overlap support level. The second support level is at 1549.96 and is a swing low support level.
On the other hand, the first resistance level is at 1790.71 and is a swing high resistance level. The second resistance level is at 2027.73 and is a multi-swing high resistance level.
Additionally, there is an intermediate support level at 1742.64 which is an overlap support level.
WTI/USD:
Possible Article:
WTI Oil Prices Fall Below Support as Momentum Turns Bearish
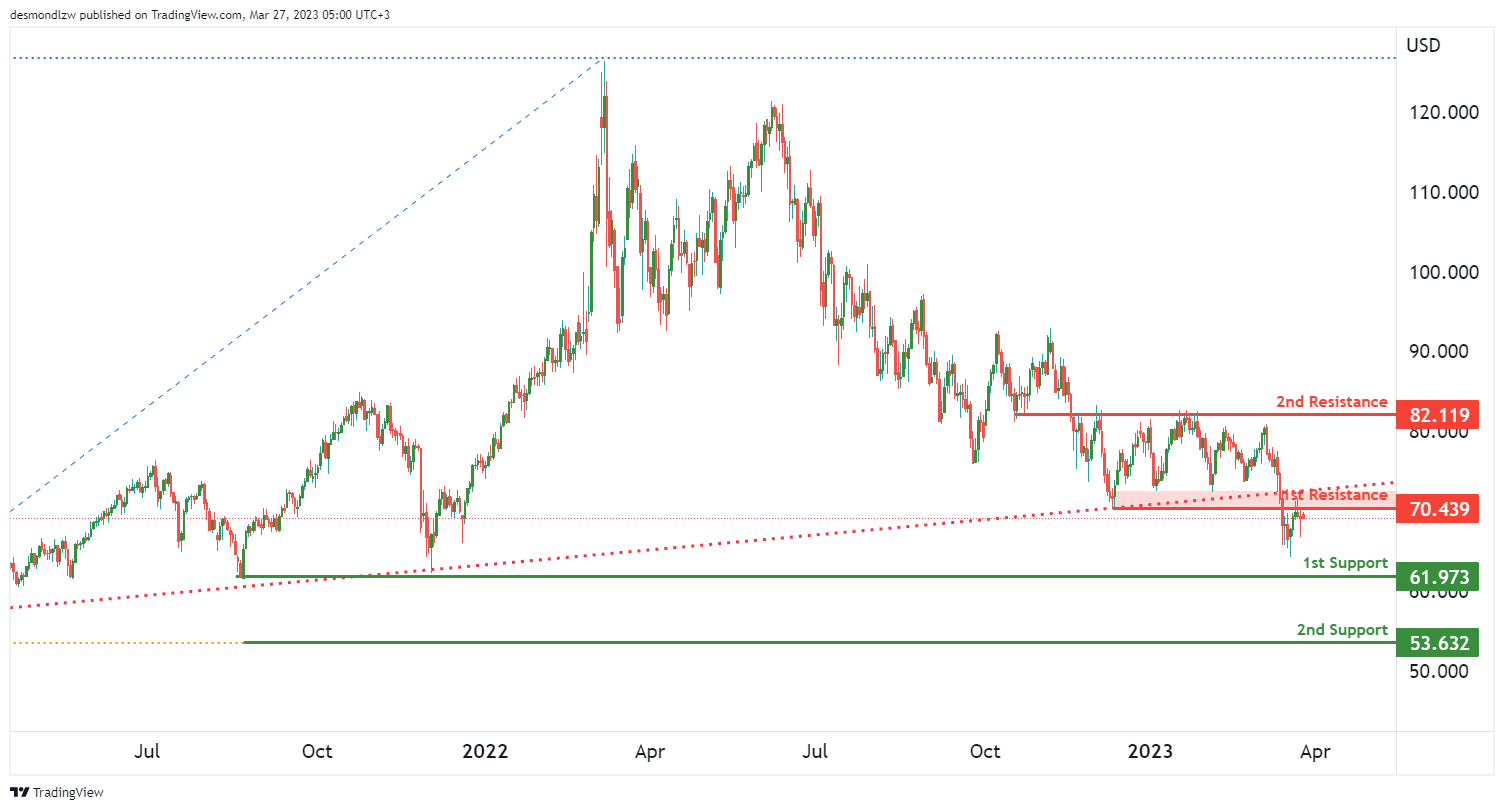
WTI oil prices have been facing bearish pressure recently, as they broke below an ascending support line on the chart. The momentum has turned negative, signalling a potential further decline in prices. The overall bias for WTI oil prices is now bearish.
Currently, prices could potentially make a bearish reaction off the first resistance level and drop to the first support level. The first support level is at 61.97, which is a swing low support. The second support level is at 53.63, which is another swing low support.
On the other hand, the first resistance level is at 70.43, which is an overlap resistance. The second resistance level is at 82.11, which is another overlap resistance.
It is important to note that the recent bearish momentum is due to the break below the ascending support line. This has triggered a potential bearish move
.
XAU/USD (GOLD):
The XAU/USD chart is currently showing bearish momentum, with potential for a continuation towards the first support level at 1948, which is an overlap support level. If prices were to drop further, they could reach the second support level at 1881, which is also an overlap support level and coincides with the 61.80% Fibonacci retracement level.
On the other hand, the first resistance level is at 2000, which is an overlap resistance level with a 127.20% Fibonacci extension. Breaking through this resistance could lead to a rise towards the second resistance level at 2070, which is a swing high resistance level.
It’s worth noting that the recent bearish momentum is contributing to the potential for a continuation towards the first support level.
The accuracy, completeness and timeliness of the information contained on this site cannot be guaranteed. IC Markets does not warranty, guarantee or make any representations, or assume any liability regarding financial results based on the use of the information in the site.
News, views, opinions, recommendations and other information obtained from sources outside of www.icmarkets.com, used in this site are believed to be reliable, but we cannot guarantee their accuracy or completeness. All such information is subject to change at any time without notice. IC Markets assumes no responsibility for the content of any linked site.
The fact that such links may exist does not indicate approval or endorsement of any material contained on any linked site. IC Markets is not liable for any harm caused by the transmission, through accessing the services or information on this site, of a computer virus, or other computer code or programming device that might be used to access, delete, damage, disable, disrupt or otherwise impede in any manner, the operation of the site or of any user’s software, hardware, data or property.


