
A note on lower timeframe confirming price action…
Waiting for lower timeframe confirmation is our main tool to confirm strength within higher timeframe zones, and has really been the key to our trading success. It takes a little time to understand the subtle nuances, however, as each trade is never the same, but once you master the rhythm so to speak, you will be saved from countless unnecessary losing trades. The following is a list of what we look for:
- A break/retest of supply or demand dependent on which way you’re trading.
- A trendline break/retest.
- Buying/selling tails/wicks – essentially we look for a cluster of very obvious spikes off of lower timeframe support and resistance levels within the higher timeframe zone.
- Candlestick patterns. We tend to stick with pin bars and engulfing bars as these have proven to be the most effective.
We typically search for lower-timeframe confirmation between the M15 and H1 timeframes, since most of our higher-timeframe areas begin with the H4. Stops are usually placed 3-5 pips beyond confirming structures.
EUR/USD:
Weekly gain/loss: – 49 pips
Weekly closing price: 1.0559
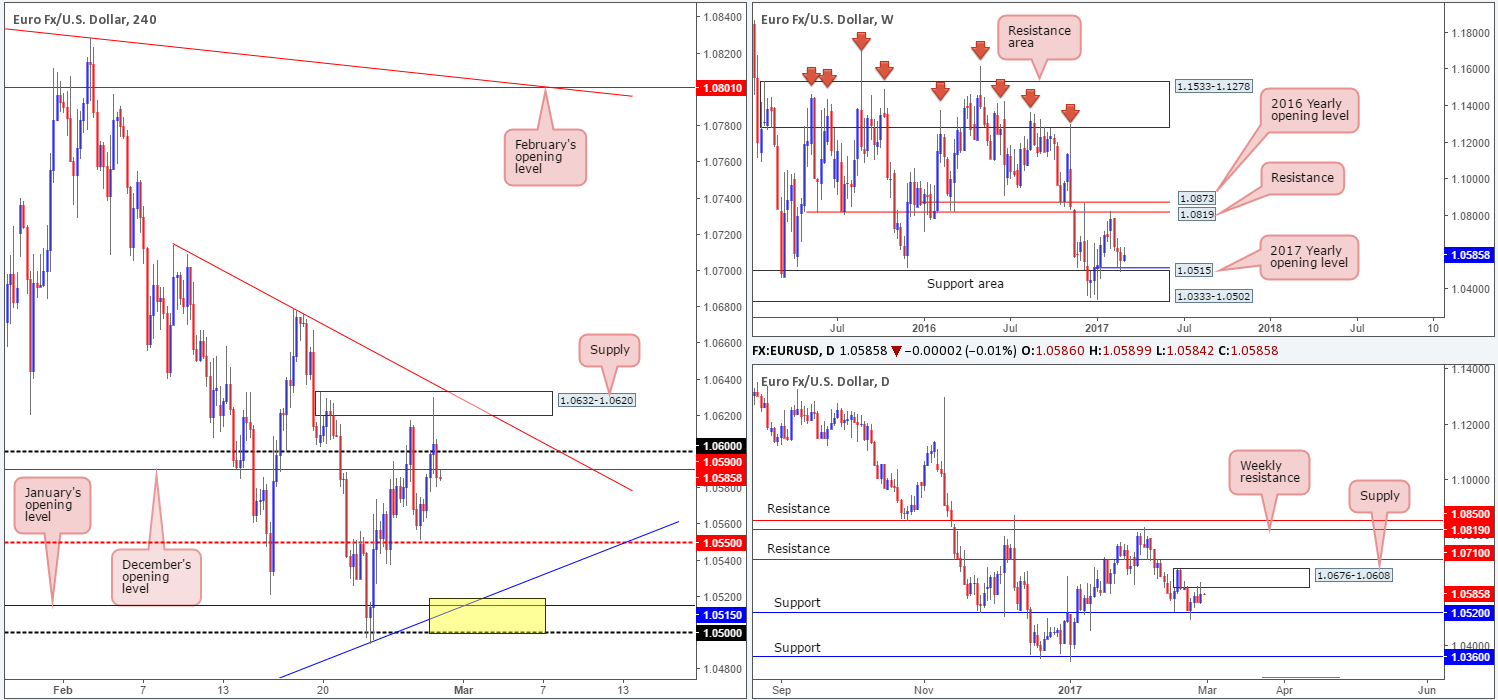
Recent action shows that the single currency managed to record its third consecutive losing week. While this may be true, price has been unable to breach the 2017 yearly opening level at 1.0515, which happens to be bolstered by a major weekly support area coming in at 1.0333-1.0502. Should the bulls make an appearance here, the next upside objective is seen at 1.0819: a weekly resistance level that’s shadowed closely by the 2016 yearly opening base at 1.0873.
Turning our attention to the daily candles, daily supply at 1.0676-1.0608 capped upside beautifully on Friday and could very well end up sending the unit back down to retest a daily support level chalked in at 1.0520. 1.0520, as you can probably see, is located five pips above the aforementioned 2017 yearly opening level.
A quick recap of Friday’s trading on the H4 chart reveals that the pair failed to sustain gains beyond the 1.06 boundary, after missing the underside of a H4 supply drawn from 1.0632-1.0620 by a cat’s whisker. Price ended the day closing just ahead of a H4 mid-way support barrier at 1.0550.
Our suggestions: In light of the above notes, we have our eye on two possible trading zones today/this week:
- The 1.06/1.0590 resistance area, which joins together nicely with a H4 trendline resistance taken from the high 1.0677. Although there is the possibility of a minor fakeout being seen here given the size of the zone and the underside of a daily supply area at 1.0608 seen floating just above it, we still feel it is worthy of attention assuming one is willing to wait for additional confirming price action before pulling the trigger.
- The 1.05/1.0520 area looks great for a bounce. The zone comprises of: a round number at 1.05, a H4 trendline support taken from the low 1.0339, January’s opening level at 1.0515, daily support at 1.0520 and let’s not forget that all of this is further reinforced by the weekly support area mentioned above at 1.0333-1.0502. This area, in our humble opinion, has sufficient confluence to justify a trade without the need for additional confirmation.
Data points to consider: US durable goods orders at 1.30pm, US pending home sales at 3pm, FOMC member Kaplan speaks at 4pm GMT.
Levels to watch/live orders:
- Buys: 1.05/1.0520 ([an area one could possibly trade at market] stop loss: 1.0490).
- Sells: 1.06/1.0590 ([wait for a lower-timeframe confirming signal to form [see the top of this report] before looking to execute a trade] stop loss: dependent on where one confirms this area).
GBP/USD:
Weekly gain/loss: + 49 pips
Weekly closing price: 1.2454
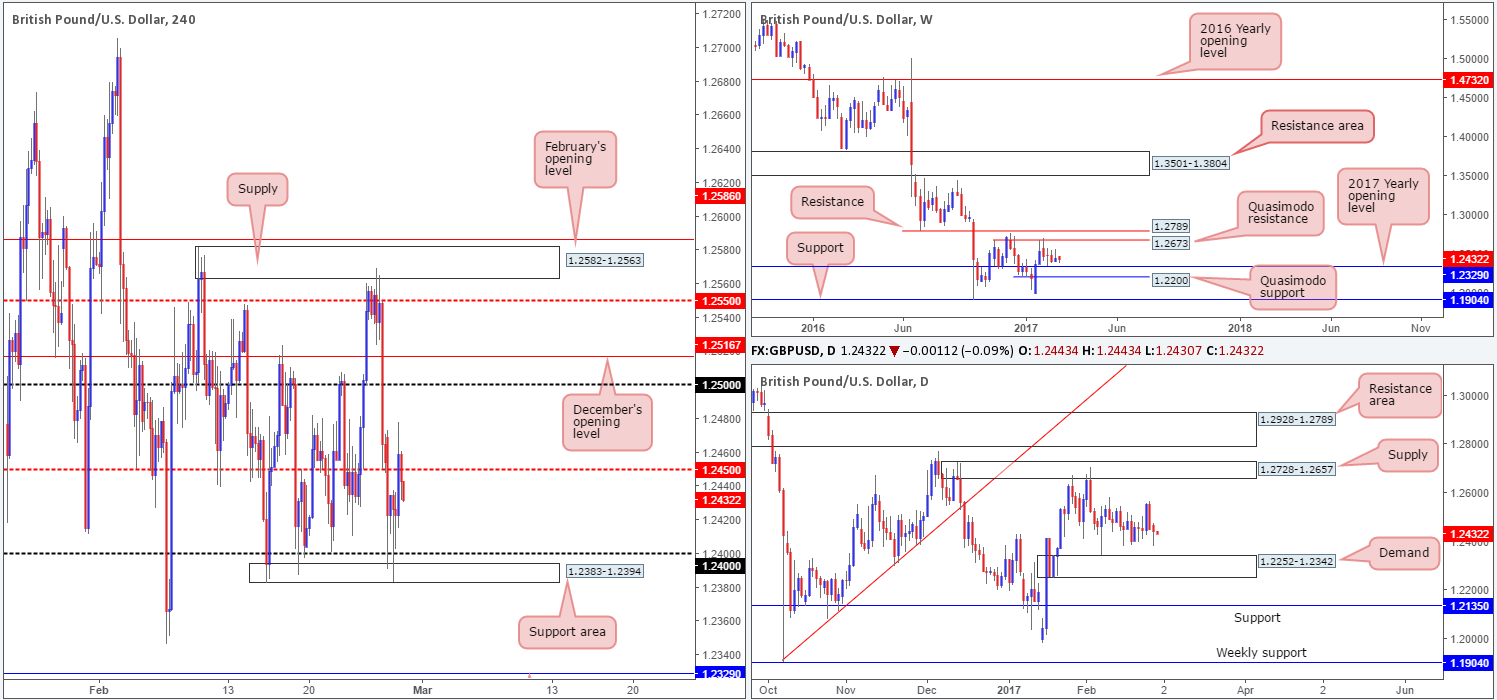
While the unit managed to achieve a weekly gain of around 50 pips, the weekly timeframe’s structure is unchanged. Price remains trading mid-range between the 2017 yearly opening level at 1.2329 and a weekly Quasimodo resistance coming in at 1.2673.
By the same token, a similar pattern is in motion on the daily chart. The daily candles are seen loitering between daily demand at 1.2252-1.2342 (houses the aforementioned 2017 yearly opening level) and a daily supply penciled in at 1.2728-1.2657 (also houses the above noted weekly Quasimodo resistance level).
Looking at the H4 chart, one can see that cable came under fresh pressure going into Friday’s US segment, after catching an offer from the H4 supply fixed at 1.2582-1.2563. The week ended with price shaking hands with a H4 mid-way support level at 1.2450.
Our suggestions: By and large, we do not see much to hang our hat on at the moment. Granted, price could bounce from 1.2450, but it could also bounce from the H4 ascending trendline seen below (1.2346) as well. The point is this pair shows very little confluence at the moment. Without it, trading becomes a challenging task! Therefore, we’ll remain on the sidelines today and reassess going into Tuesday’s session.
Data points to consider: US durable goods orders at 1.30pm, US pending home sales at 3pm, FOMC member Kaplan speaks at 4pm GMT.
Levels to watch/live orders:
- Buys: Flat (stop loss: N/A).
- Sells: Flat (stop loss: N/A).
AUD/USD:
Weekly gain/loss: – 1 pip
Weekly closing price: 0.7666
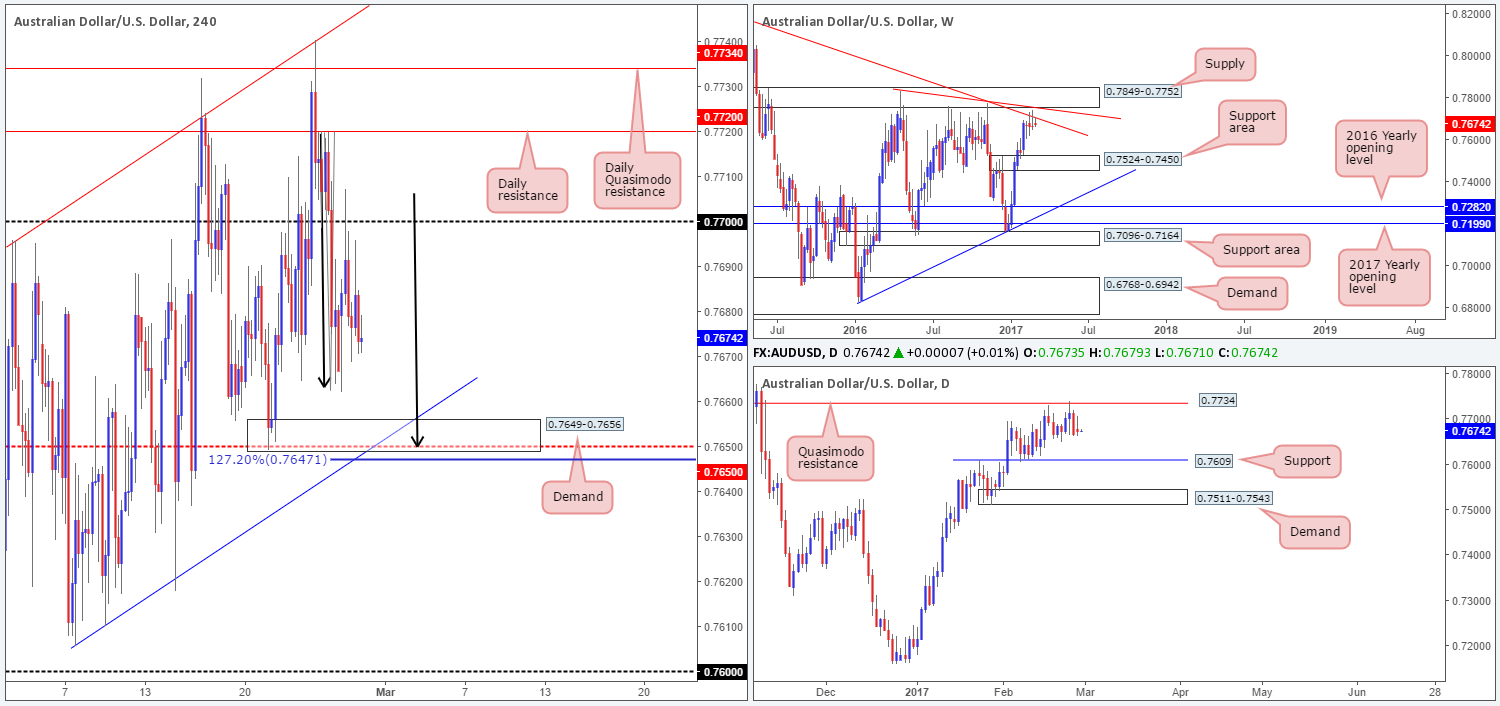
Despite price remaining unchanged going into the week’s closing point, there is some value we can take from last week’s movement. A strong-looking weekly selling wick took shape after price retested the weekly trendline resistance extended from the high 0.8163. In the event that follow-through selling is seen this week, the next area to keep an eye on is the weekly support zone marked at 0.7524-0.7450.
Along the same vein, the daily Quasimodo resistance line at 0.7734 was brought into play on Thursday, which, as you can see, followed through with an extension to the downside on Friday. From this angle, we will expect buying pressure to come into the market once/if price strikes the daily support base pegged at 0.7609.
Swinging over to the H4 chart, we can see that the pair has been entrenched within a rather large H4 ascending channel (0.7605/0.7696) since the beginning of February. Thanks to Friday’s selloff, the unit is now seen trading within touching distance of the channel support, which happens to merge nicely with a H4 mid-way support level at 0.7650 and a H4 demand base coming in at 0.7649-0.7656.
Our suggestions: Although there’s a good chance a reaction may be seen from the 0.7650 neighborhood today, trading from here unfortunately places one in direct conflict with the higher-timeframe structures mentioned above. However, should one be willing to wait for additional confirmation in the form of a reasonably sized H4 bull candle, a trade from here is possible for at least a bounce, in our opinion.
Data points to consider: US durable goods orders at 1.30pm, US pending home sales at 3pm, FOMC member Kaplan speaks at 4pm GMT.
Levels to watch/live orders:
- Buys: 0.7649-0.7656 ([wait for a reasonably sized H4 bull candle to form before looking to execute a trade] stop loss: ideally beyond the trigger candle).
- Sells: Flat (stop loss: N/A).
USD/JPY:
Weekly gain/loss: – 75 pips
Weekly closing price: 112.14
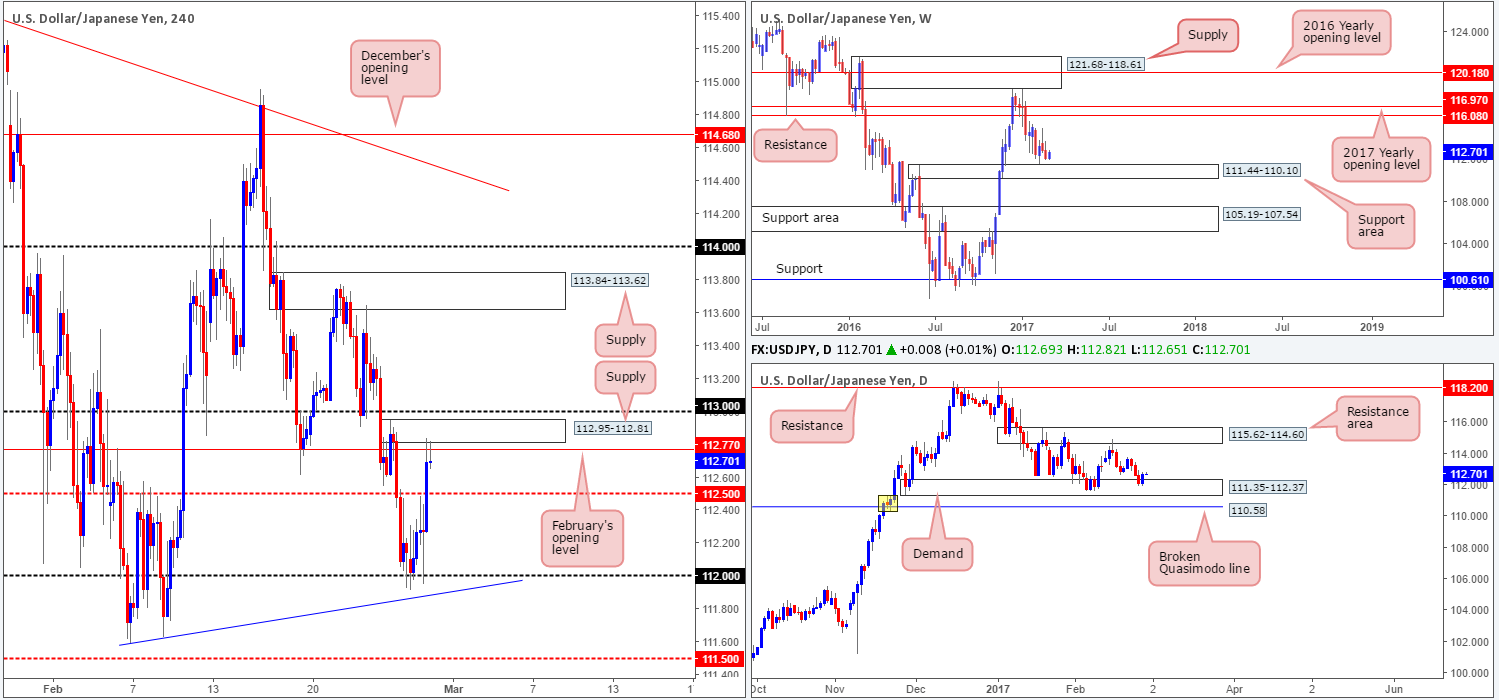
Beginning with the weekly timeframe this morning, price looks to be on course to cross swords with a weekly support area drawn in at 111.44-110.10, which we believe will hold price. The reason for why simply comes from seeing the rather swift retest to the top edge of this zone following the break of this area back in late November 2016 (see black arrow).
Since mid-January, the daily candles have been consolidating between a daily resistance area carved from 115.62-114.60 and a daily demand base seen at 111.35-112.37. While this demand is located around the top edge of the above noted weekly support area, there is a strong possibility that it may experience a fakeout down to the daily broken Quasimodo line at 110.58. This line is beautifully positioned within the aforementioned weekly support area, and intersects with the decision point (see yellow box) area that was used to break through the weekly supply which, as we highlighted above, is now an acting support area.
Switching over to the H4 chart, we can see that the pair clipped a pocket of fresh bids around the 112 handle as price entered into the last few hours of trade on Friday, consequently forming a rather solid-looking H4 buying tail. Strengthening this number we have a H4 trendline support taken from the low 111.59 and a H4 AB=CD 127.7% Fib ext. at 111.96 drawn from the high 114.95.
Our suggestions: Given that 112 is also supported by a daily demand zone mentioned above at 111.35-112.37, further buying could be seen during Asia this morning. However, just below here sits the H4 mid-way support barrier at 111.50 that fuses with the H4 AB=CD symmetrical completion point at 111.42 (black arrows). To that end, both areas are worthy of attention.
For us personally, nevertheless, we will not be looking to buy from 112 since 111.50, alongside the H4 AB=CD symmetrical structure, also converges beautifully with the top edge of the above noted weekly support area at 111.44 and a H4 trendline support etched from the high 116.66!
Data points to consider: US durable goods orders at 1.30pm, US pending home sales at 3pm, FOMC member Kaplan speaks at 4pm GMT.
Levels to watch/live orders:
- Buys: 111.50 ([pending order] stop loss: beyond the 28th Nov low at 111.35 [111.30]).
- Sells: Flat (stop loss: N/A).
USD/CAD:
Weekly gain/loss: + 7 pips
Weekly closing price: 1.3096
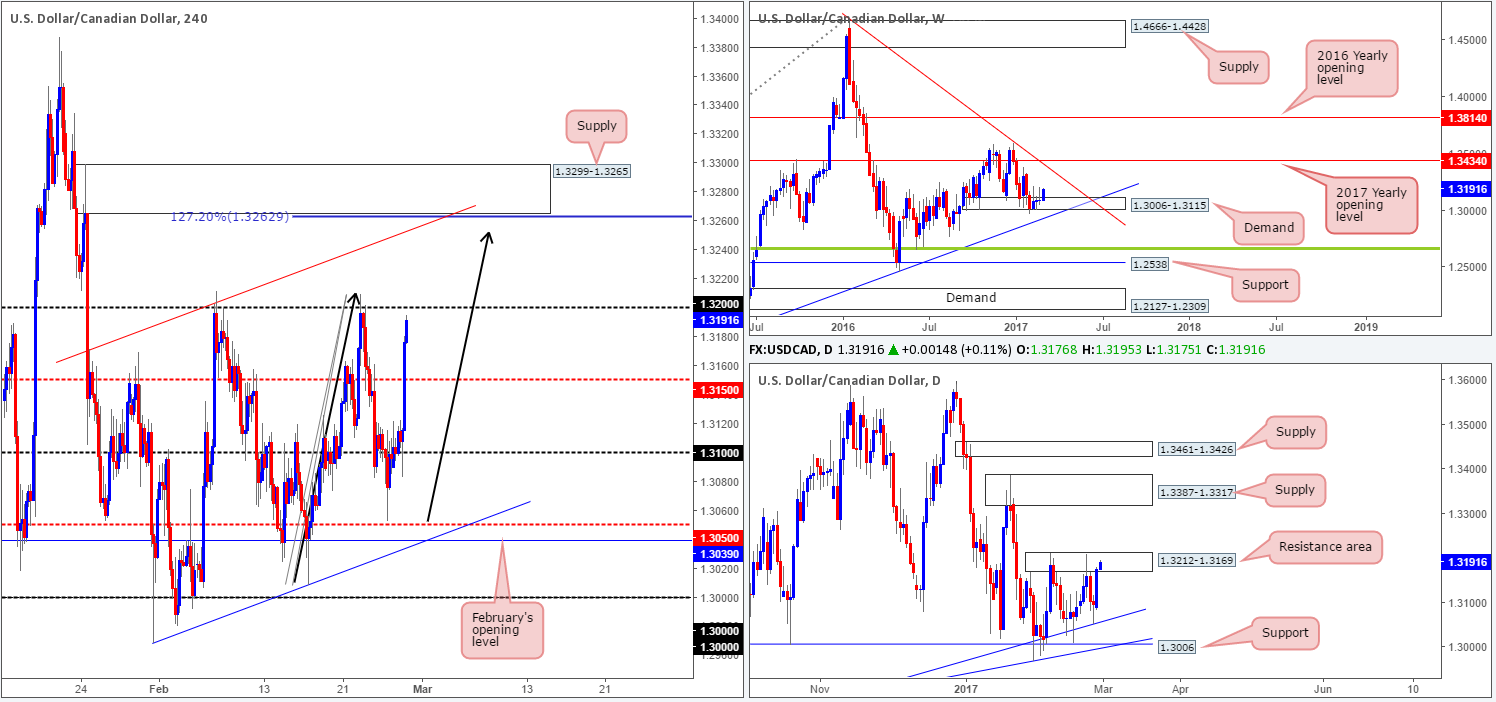
Although weekly demand at 1.3006-1.3115 remains intact, there has been very little noteworthy movement registered from this zone over the last month. Should the bulls regain consciousness here, the next upside hurdle in view is the weekly trendline resistance penciled in from the high 1.4689. On the flip side, a break through this demand will almost certainly lead to a move down to the nearby weekly trendline support penciled in from the high 1.1278.
Looking down to the daily chart, the daily candles are currently seen compressing between a daily resistance zone fixed at 1.3212-1.3169 and a daily ascending trendline support taken from the low 1.2822. Any sustained move beyond the current resistance base would likely place the daily supply at 1.3387-1.3317 in the firing range. A daily close below the aforementioned daily trendline support, nevertheless, could prompt further downside to daily support pegged at 1.3006, which happens to converge with a daily trendline support drawn from the low 1.2654.
A brief look at recent dealings on the H4 chart shows that the pair fell sharply in response to the stronger-than-expected Canadian CPI report on Friday. The selloff, however, was a short-lived one as price managed to tap fresh bids just ahead of the H4 mid-way support line at 1.3050 and bring the unit back up to the underside of the 1.31 handle into the week’s end.
Our suggestions: As can be seen from the H4 chart, price is not only hugging the round number 1.31, it is also shaking hands with a newly-formed H4 supply coming in at 1.3120-1.3103. The only area that really catches our eye at the moment, however, is the 1.3024/1.3039 base seen on the H4 chart (green circle). It consists of a H4 Quasimodo support at 1.3024, February’s opening level at 1.3039, a H4 trendline support stretched from the low 1.2968, positioned within the current weekly demand zone and also has the daily trendline support mentioned above at 1.2822 hovering just above it. Usually, with confluence like this our desk would look to place a pending buy order. In this case, nonetheless, there are two cautionary points to consider here:
- Having seen the weekly candles recently struggle to find direction within demand the past month, the buyers look somewhat fragile at the moment.
- There is a possibility that the H4 candles may fake through our above noted H4 buy zone and tag the 1.30 handle. As we’re sure you’re already aware, 1.30 is a watched number in this market, and thus it could potentially act as a magnet to price.
Given this, we will only consider the 1.3024/1.3039 area valid should a reasonably sized H4 bull candle take shape out of this zone, and preferably close back above the 1.3050 barrier.
Data points to consider: US durable goods orders at 1.30pm, US pending home sales at 3pm, FOMC member Kaplan speaks at 4pm GMT.
Levels to watch/live orders:
- Buys: 1.3024/1.3039 ([wait for a reasonably sized H4 bull candle to form before looking to execute a trade] stop loss: ideally beyond the trigger candle).
- Sells: Flat (stop loss: N/A).
USD/CHF:
Weekly gain/loss: + 46 pips
Weekly closing price: 1.0070
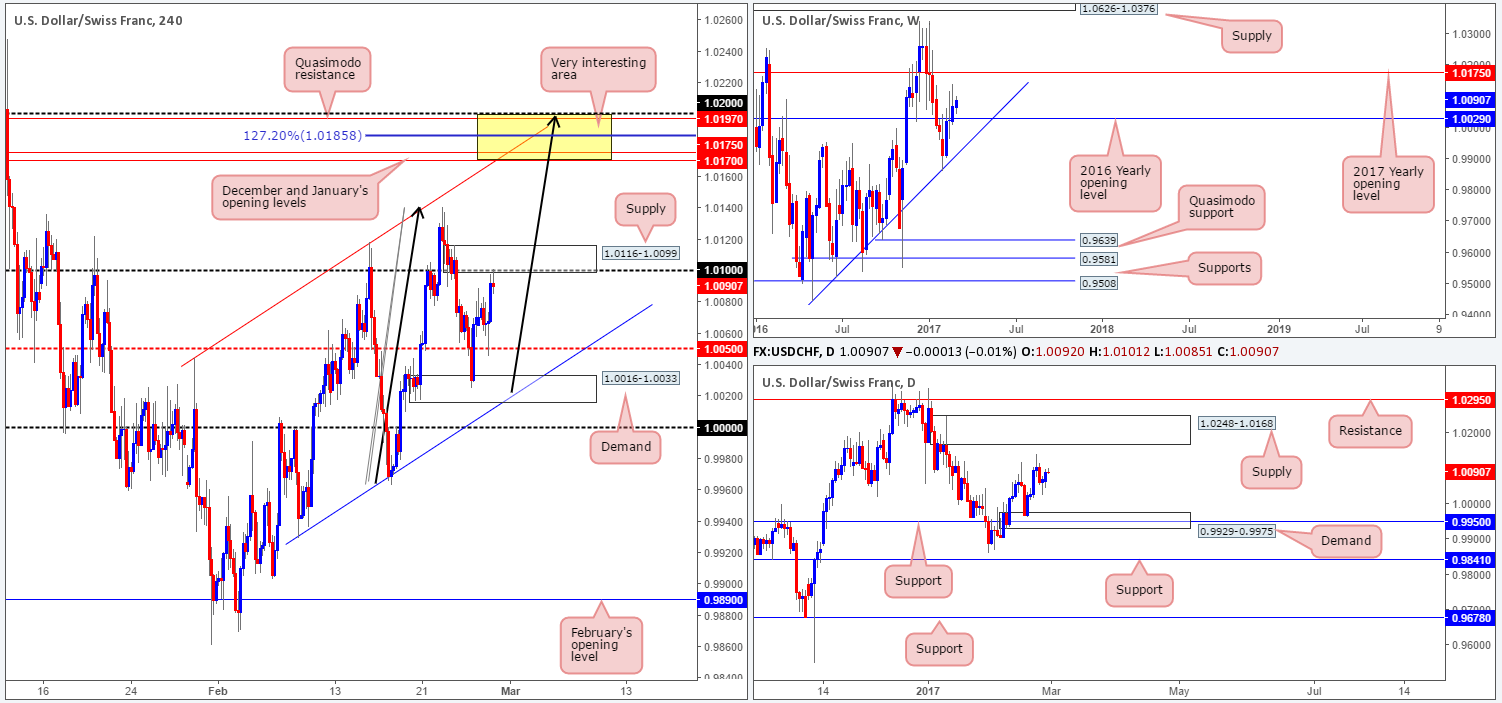
During the course of last week’s session, the unit conquered the 2016 yearly opening level at 1.0029 and has potentially opened up the path north to the 2017 yearly opening level at 1.0175. Looking down to the daily chart, we can see that price is currently loitering mid-range between a daily supply coming in at 1.0248-1.0168 (houses the 2017 yearly opening level mentioned above) and a daily demand base drawn from 0.9929-0.9975. Of particular interest here is Friday’s candle that formed a beautiful-looking buying tail off of the 2016 yearly opening level, suggesting that the Swissy may indeed head higher this week!
Stepping across to the H4 chart, the H4 candles managed to catch a fresh bid from a strong-looking H4 demand base seen at 1.0016-1.0033, and close back above the H4 mid-way level at 1.0050. The next area in view is a H4 supply at 1.0116-1.0099.
Our suggestions: While the aforementioned H4 supply zone could potentially hold this market lower today, we feel it is somewhat vulnerable since the more attractive zone (in yellow) is seen above! Comprised of both December and January’s opening levels at 1.0170/1.0175, a H4 AB=CD 127.2% Fib ext. at 1.0185, an upper H4 channel resistance line pegged from the high 1.0044, a H4 Quasimodo resistance at 1.0197, a 1.02 psychological handle and let’s not forget that all of this is seen housed within the daily supply zone coming in at 1.0248-1.0168. In light of this confluence, our team will, dependent on the time of day, look to sell from the H4 127.2% Fib ext. level with stops placed a few pips above 1.02. In addition to this, we see little reason not to look to buy the break of the current H4 supply zone up to our H4 sell area. However, we would insist on not only a clean H4 close above the supply, but also a retest of the zone as demand followed by a reasonably sized H4 bull candle.
Data points to consider: US durable goods orders at 1.30pm, US pending home sales at 3pm, FOMC member Kaplan speaks at 4pm. Swiss Gov. Board member Zurbrugg speaks today at 12.30pm GMT.
Levels to watch/live orders:
- Buys: Watch for a H4 close above the current H4 supply area and look to trade any retest seen thereafter ([we would also advise waiting for a reasonably sized H4 bull to form following the retest candle before looking to execute a trade] stop loss: ideally beyond the trigger candle).
- Sells: Flat (stop loss: N/A).
DOW 30:
Weekly gain/loss: + 198 points
Weekly closing price: 20803
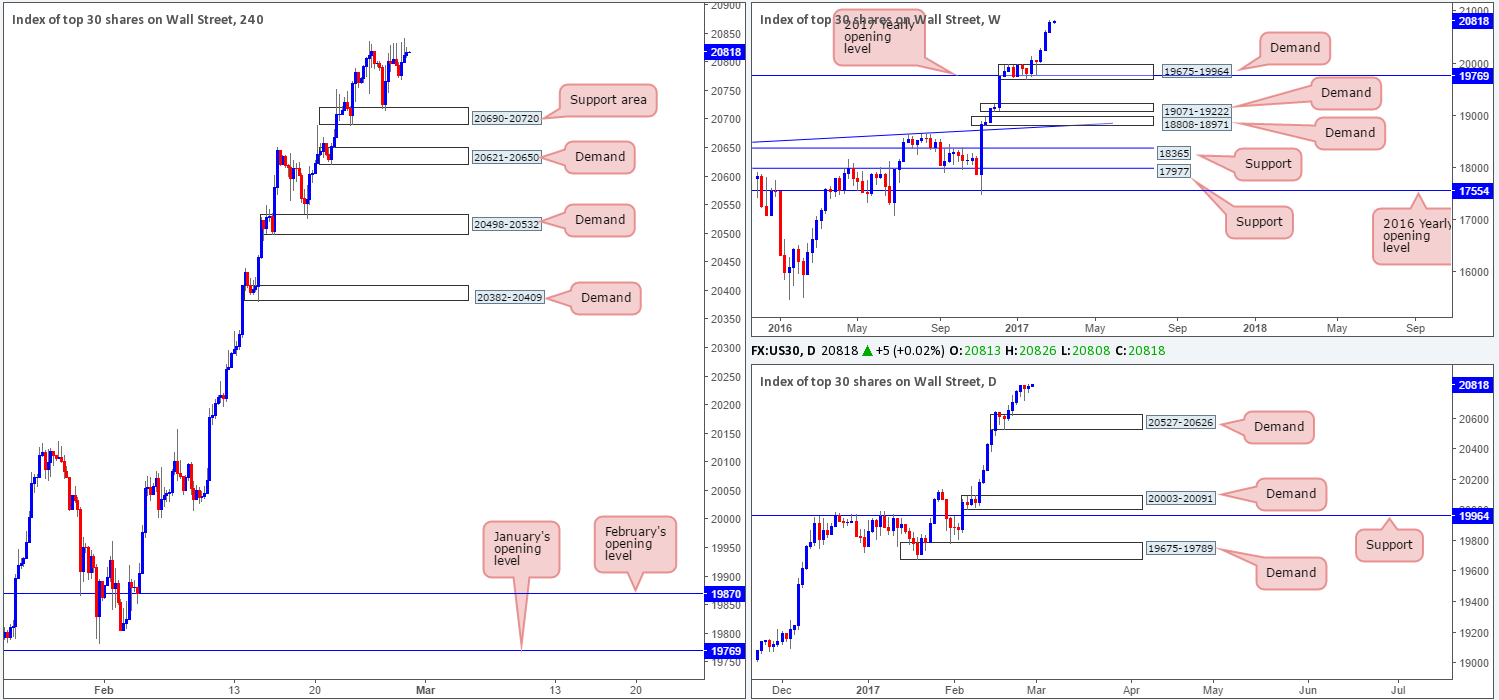
As can be seen from the weekly chart, another healthy round of buy orders flowed into the market last week, consequently registering a third consecutive weekly gain. With equities now trading at record highs, where do we go from here? Well, given that there is absolutely no weekly resistance levels in sight, the best we can do for the time being is continue looking to ‘buy the dips’. The closest higher-timeframe area can be seen at 20527-20626: a daily demand zone.
Over on the H4 chart, price respected the H4 support area at 20690-20720 beautifully on Friday and rallied to a high of 20816. Although this zone boasts no higher-timeframe (structural) convergence, the buyers have already proved its value. Therefore, it remains of interest to our desk today.
Our suggestions: Just to be clear here though, placing pending orders at this zone is not advised, since there’s little stopping price from ignoring this area and heading to the H4 demand zone below at 20621-20650, which happens to be positioned around the top edge of the current daily demand base. Waiting for additional confirmation such as a lower-timeframe buy signal (see the top of this report) or a reasonably sized H4 bull candle is, at least in our opinion, the safer, more logical, path to take.
Data points to consider: US durable goods orders at 1.30pm, US pending home sales at 3pm, FOMC member Kaplan speaks at 4pm GMT.
Levels to watch/live orders:
- Buys: 20690-20720 ([waiting for additional confirmation is advised before looking to execute a trade] stop loss: dependent on how one chooses to confirm the zone).
- Sells: Flat (stop loss: N/A).
GOLD:
Weekly gain/loss: + $22.2
Weekly closing price: 1255.9
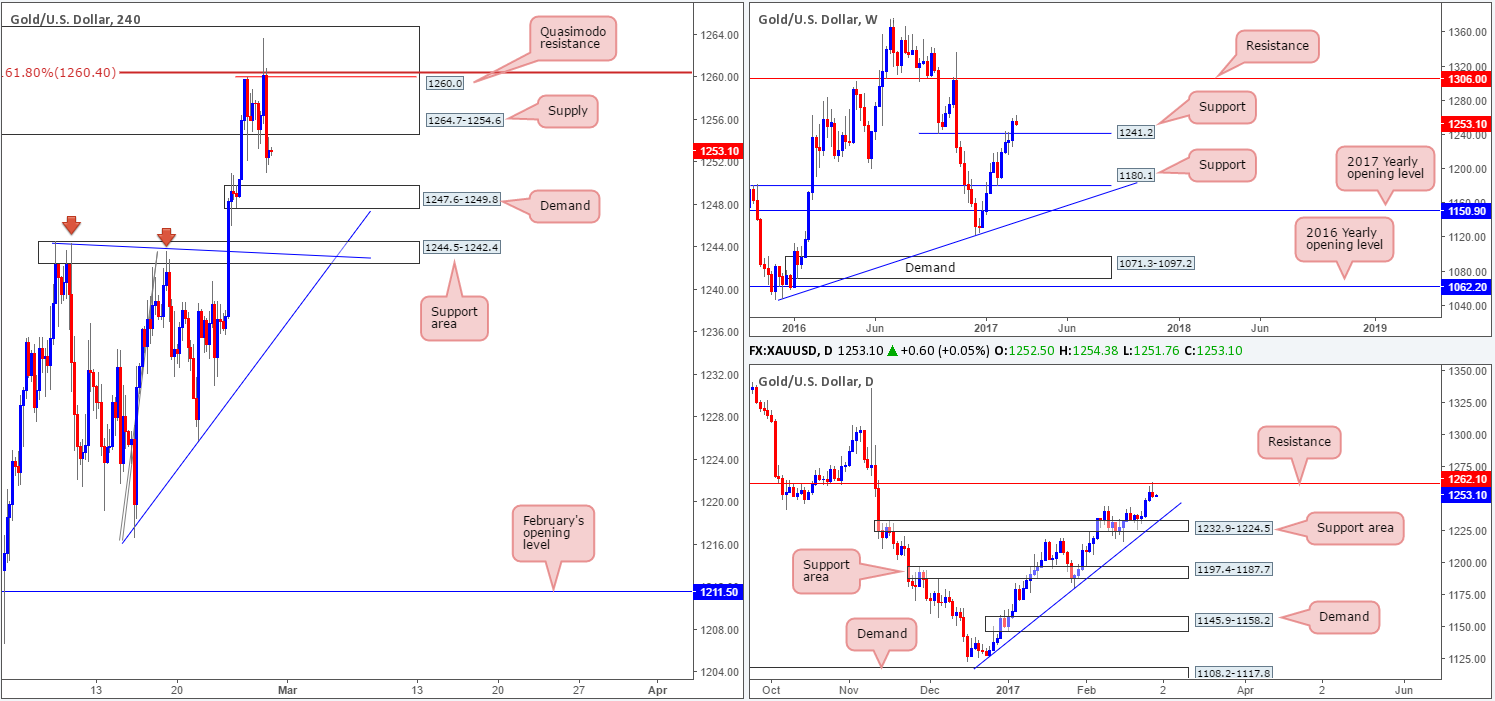
Over the last week the bulls registered their fourth consecutive weekly gain, which saw weekly action close above weekly resistance at 1241.2 (now acting support). Should price remain bolstered above this level, the next line of interest from here falls in at a weekly resistance level drawn from 1306.0.
While the weekly chart shows room to advance further this week, it might be worth noting that just ahead of price sits a daily resistance level seen at 1262.1. This base stretches right back to 2010 so it is not really one to ignore!
The H4 chart on the other hand reveals that price is already trading within a H4 supply zone coming in at 1264.7-1254.6. This zone houses the aforementioned daily resistance level and also a H4 161.8% Fib ext. taken from the low 1216.5 at 1260.4. On account of the confluence seen around this H4 supply zone, we do not picture this area giving way today. In fact, there is a strong possibility that the yellow metal may selloff from here and cross swords with the nearby H4 demand marked at 1247.6-1249.8.
Our suggestions: The distance from the H4 supply to the H4 demand, nevertheless, is really quite small. However, shorting from the H4 161.8% Fib ext. sited within the H4 supply and placing stops above this area could be an option, as this would give one reasonably good risk/reward. To take advantage of this move, we would advise waiting for a lower-timeframe confirming sell signal (see the top of this report) to form before pulling the trigger. This would likely get you in the market at a better price and could even reduce the stop-loss distance.
Levels to watch/live orders:
- Buys: Flat (stop loss: N/A).
- Sells: 1260.54 region ([wait for a lower-timeframe confirming signal to form before looking to execute a trade] stop loss: ideally beyond the current H4 supply).


