
EUR/USD:
Weekly Gain/Loss: +1.6% (183 pips)
Weekly Close: 1.1619
Weekly perspective:
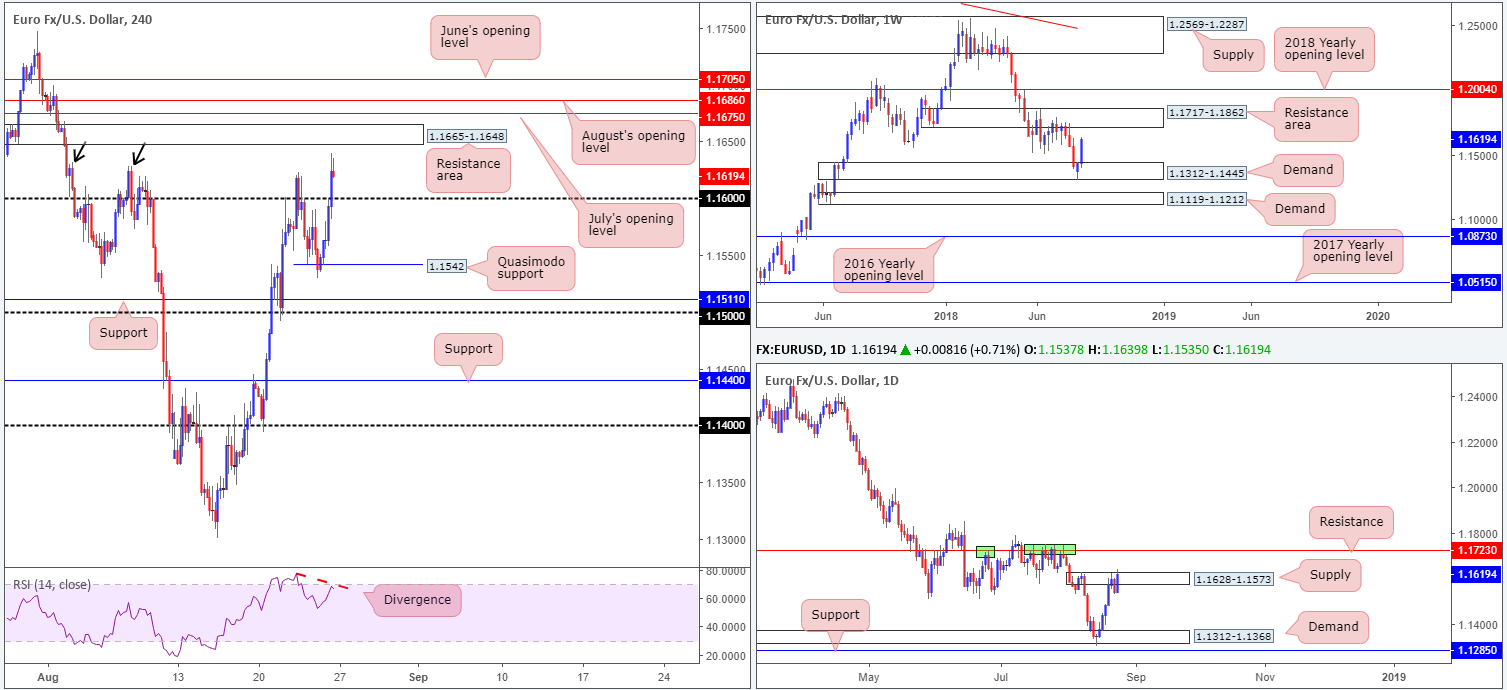
EUR/USD bulls entered an offensive phase last week, developing a near-full-bodied bullish candle. With longs seemingly growing in confidence, the odds of price action shaking hands with the nearby resistance area at 1.1717-1.1862 this week are high.
Daily perspective:
Supply at 1.1628-1.1573, although an area that managed to briefly cap upside last week, had the top edge of its base consumed on Friday. Stop-loss orders for those short from here (which given the recent push to fresh 2018 lows of 1.1301 was likely to be a considerable amount) were potentially filled, possibly setting the stage for further buying this week towards resistance penciled in at 1.1723.
H4 perspective:
A look at Friday’s movement on the H4 timeframe shows the pair cleared orders from the 1.16 handle in strong fashion, exacerbated by a sharp USD decline following Jerome Powell’s speech at Jackson Hole.
Clocking fresh highs of 1.1639. Friday’s advance tripped stops above 1.1628 and also 1.1632 (see black arrows), and came within a few pips of testing a H4 resistance zone at 1.1665-1.1648. Intraday, this zone has the ability to withstand buying pressure we believe, given it was once a fresh demand zone with a strong base.
Also notable on the H4 scale is the market wrapped up the week in the shape of a bearish pin-bar formation, along with the RSI indicator seen displaying a divergence reading out of overbought terrain.
Areas of consideration:
Longer term, the single currency is likely headed for higher ground, at least until we cross swords with the weekly resistance area mentioned above at 1.1717-1.1862.
Intraday movement (H4), however, is likely to observe a pullback in the early hours of today’s action to challenge 1.16 as support. This may be a good location to being thinking of entering long, targeting the H4 resistance zone at 1.1665-1.1648 as the initial port of call, followed then by the collection of monthly opening levels seen above it between 1.1705/1.1675. Aggressive traders may look to enter at market around 1.16 and position stops at 1.1578 (just below the small [kink] demand area). Conservative traders, on the other hand, may opt to wait for additional candle confirmation on the lower timeframes before pulling the trigger: a bullish pin-bar formation or engulfing candle (stop-loss orders should be placed in line with the confirming pattern).
Should 1.16 fail to hold, traders’ crosshairs will likely be fixed on the Quasimodo support level at 1.1542 for a possible buy.
Today’s data points: German IFO business climate survey.
GBP/USD:
Weekly Gain/Loss: +0.78% (99 pips)
Weekly Close: 1.2845
Weekly perspective:
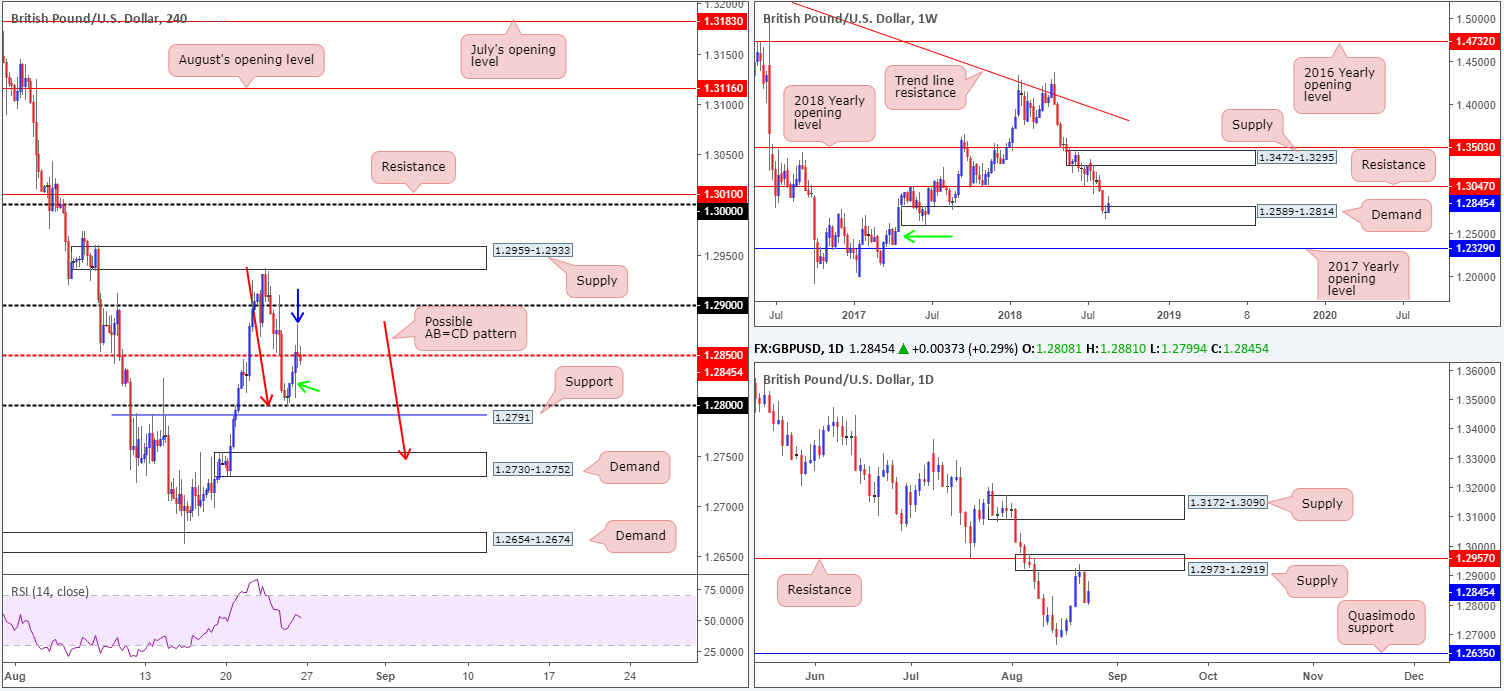
Over the course of last week, a fresh upside attempt was observed out of demand at 1.2589-1.2814, though faltered around the 1.2936 neighborhood. The next upside objective from the current demand base can be seen at support-turned resistance drawn from 1.3047. Beyond the current demand, however, demand marked with a green arrow at 1.2365-1.2555 is likely the next hurdle in the firing range, though with the 2017 yearly opening level lurking just beneath it at 1.2329 there’s a possibility price could fake lower to bring in buyers from this hurdle.
Daily perspective:
While weekly price is attempting to establish ground out of demand, daily flow is seen trading from supply at 1.2973-1.2919, which, as you can see, also houses a resistance level parked at 1.2957. Continued selling on this scale has the 2018 yearly low 1.2661 to target, shadowed closely by a Quasimodo support level at 1.2635.
H4 perspective:
Benefiting from a soft USD across the board, the H4 candles steadied themselves at the 1.28 handle on Friday, clocking session highs of 1.2881 on the day. In view of current candle action on this scale, nevertheless, bullish momentum appears to be waning. Note the indecision candle (blue arrow) and the long tail printed on the candle prior (green arrow) indicating possible selling pressure, as well as a H4 close back beneath the mid-level number 1.2850.
As a result, the market could observe a second retest of 1.28 today. Traders should prepare for the possibility of a fakeout beneath 1.28, though, given how close the number is positioned to support at 1.2791.
Areas of consideration:
In a nutshell, longer-term action is somewhat grounded for the time being it seems, with weekly price trading from demand and daily action from supply.
According to recent intraday movement, a retest of 1.28 is likely in the offing today, with a possibility of a fakeout through this number being observed. Should the fakeout take shape in the form of a bullish pin-bar formation, a long off this candlestick pattern could be an idea (stops set beneath the pattern’s extreme), targeting 1.2850 as the initial take-profit zone.
Should 1.28 fail to hold, the H4 demand area at 1.2730-1.2752 is the next area in the pipeline for a test we believe. Buying from this base is also relatively attractive, owing to the approach: a possible AB=CD pattern (red arrows).
Today’s data points: UK banks will be closed in observance of the Summer Bank Holiday.
AUD/USD:
Weekly Gain/Loss: +0.14% (10 pips)
Weekly Close: 0.7323
Weekly perspective:
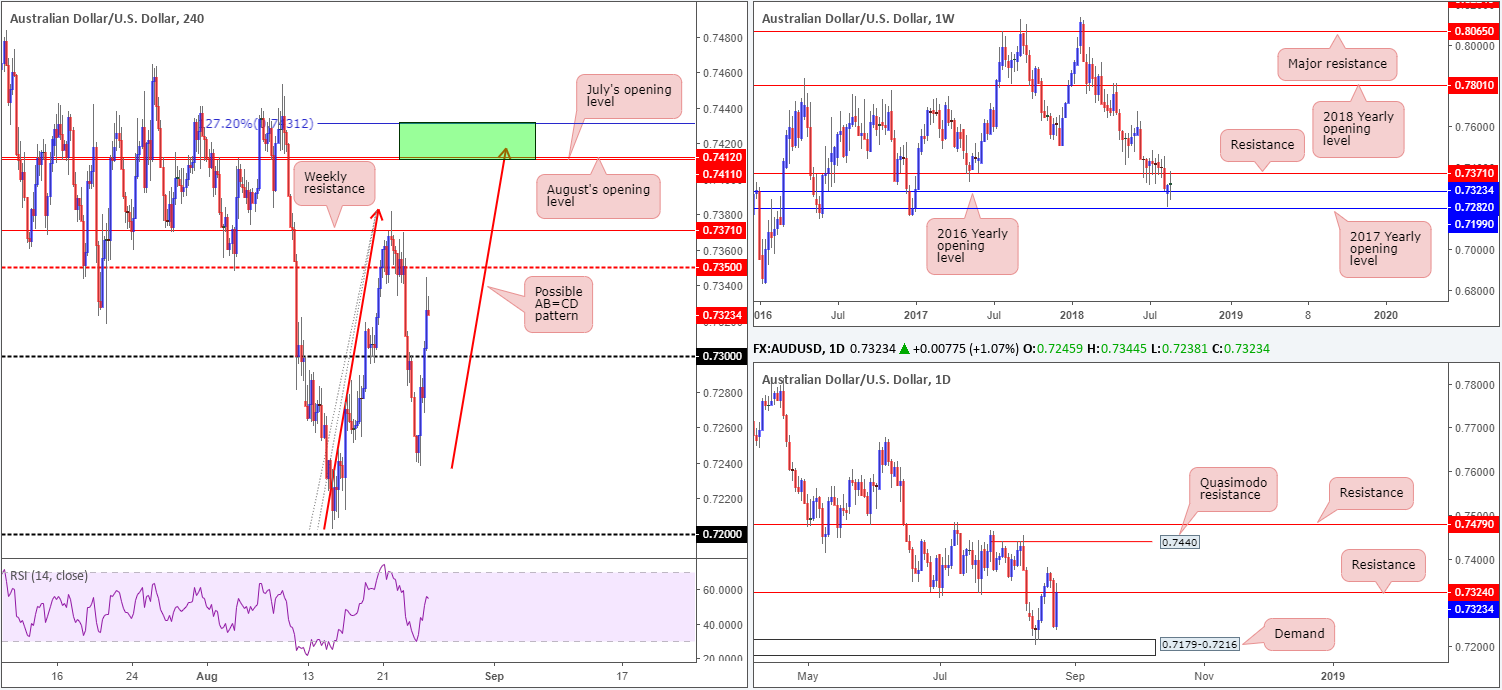
By way of a clear-cut indecision candle, price action was contained between resistance at 0.7371 and the 2016 yearly opening level at 0.7282 last week.
Beneath 0.7282, the 2017 yearly opening level at 0.7199 is the next barrier on the hit list. It is also worth noting the current resistance level carries considerable weight, in light of the barrier holding price higher in May of 2017 and also proving a troublesome support to overcome in June/July of this year.
Daily perspective:
As can be seen from the chart, the week ended with daily action shaking hands with resistance at 0.7324, after coming within striking distance of demand at 0.7179-0.7216. Should the current resistance fail to hold price lower this week, the expectation is for a move towards a Quasimodo resistance level at 0.7440.
H4 perspective:
The commodity currency came under pressure on Thursday amid news Australian PM Turnbull suffered a second leadership contest. A marked turnaround for the pair was observed on Friday, however, as Scott Morrison, the former treasurer, became the new PM. A soft USD, coupled with Aussie political news, drove the H4 candles above the 0.73 handle to session highs of 0.7344.
Areas of consideration:
There are a number of key levels in view this week:
- The daily resistance level at 0.7324 (currently in play).
- The weekly resistance at 0.7371.
- The H4 green zone at 0.7431/0.7411 (comprised of a 127.2% AB=CD (red arrows) formation and July/August’s opening levels).
Each of the above said barriers carry weight. It is, however, difficult to know which base will hold, if any. Therefore, the best thing we can do under these conditions is simply wait and see how H4 action responds once the level is in motion. A H4 (or any timeframe you prefer) full or near-full-bodied bearish candle is a good indication of seller intent, with the option of placing stop-loss orders above the rejecting candle extreme (the wick).
Today’s data points: Limited.
USD/JPY:
Weekly Gain/Loss: +0.69% (76 pips)
Weekly Close: 111.22
Weekly perspective:
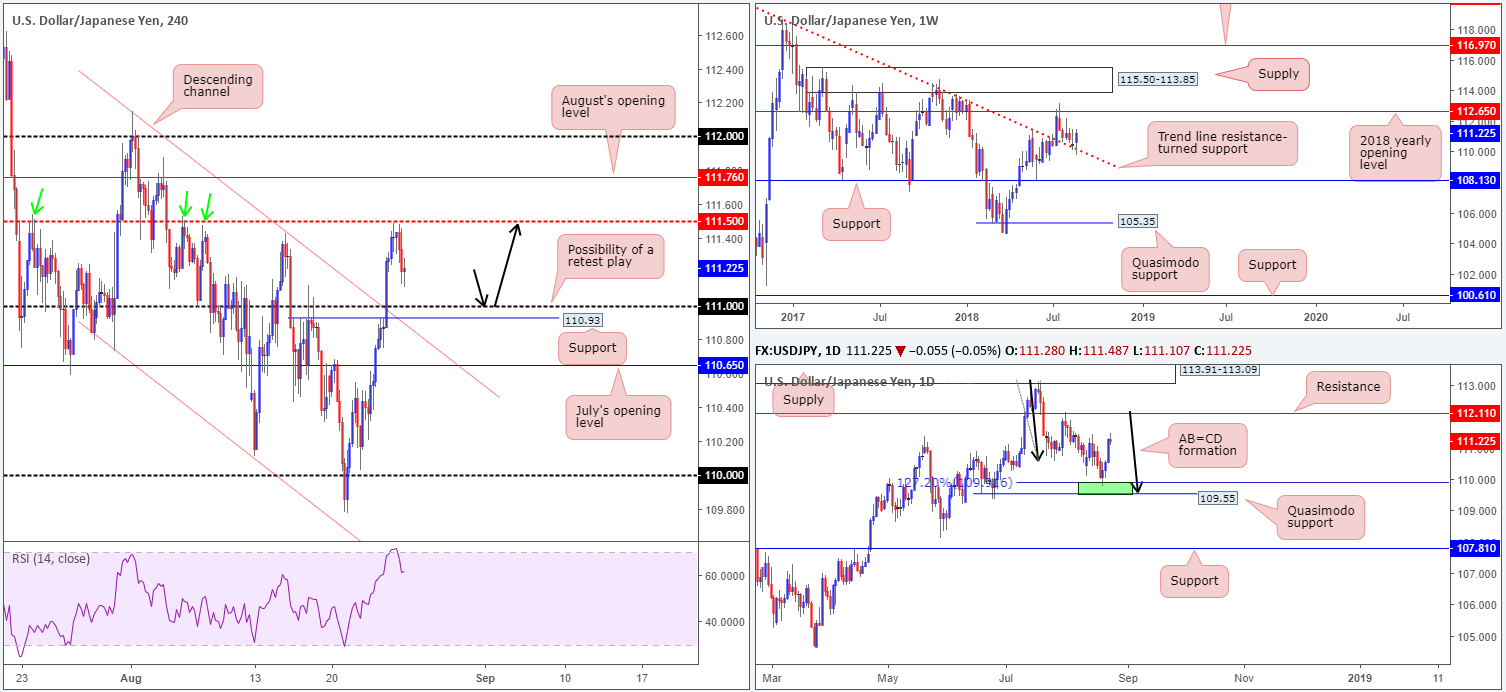
Weekly movement, as you can see, retested a trend line resistance-turned support (taken from the high 123.57) last week in the form of a strong bullish candle. Having seen this line hold firm as resistance on a number of occasions in the past, it’s likely to remain a defensive barrier going forward. Further buying from current price has the 2018 yearly opening level at 112.65 to target.
Daily perspective:
As can be seen on the daily timeframe, the green zone at 109.55/109.91 (an AB=CD formation [black arrows] around the 127.2% Fib ext. point at 109.91 and a nearby a Quasimodo support at 109.55) held beautifully last week. The next obvious upside target on this scale does not come into view until resistance at 112.11.
H4 perspective:
A brief look at recent dealings on the H4 scale shows price action topped just south of a mid-level resistance at 111.50 (a line that boasts reasonably strong history [see green arrows]), and retreated lower on the back of Fed’s Powell’s speech at Jackson Hole.
This has placed the 111 handle back in view this week, which, as you can probably see, is shadowed closely by a minor support level coming in at 110.93 and a nearby channel resistance-turned support (taken from the high 112.15).
Areas of consideration:
A retest play off the 111 handle may come into view today. Upside targets from 111 fall in at 111.50, August’s opening level at 111.76, the 112 handle, followed closely by daily resistance mentioned above at 112.11.
In regard to entry, aggressive traders will likely enter at market, placing stops 10-15 pips beneath 111. While this could work out, conservative traders may prefer to wait and see how H4 action responds before engaging. A H4 (or an even lower timeframe if you prefer) bullish candlestick formation printed off this number would be ideal to confirm buyer intent (stop-loss orders should be positioned below the extreme of the confirming candle).
Today’s data points: Limited.
USD/CAD:
Weekly Gain/Loss: -0.28% (36 pips)
Weekly Close: 1.3025
Weekly perspective:
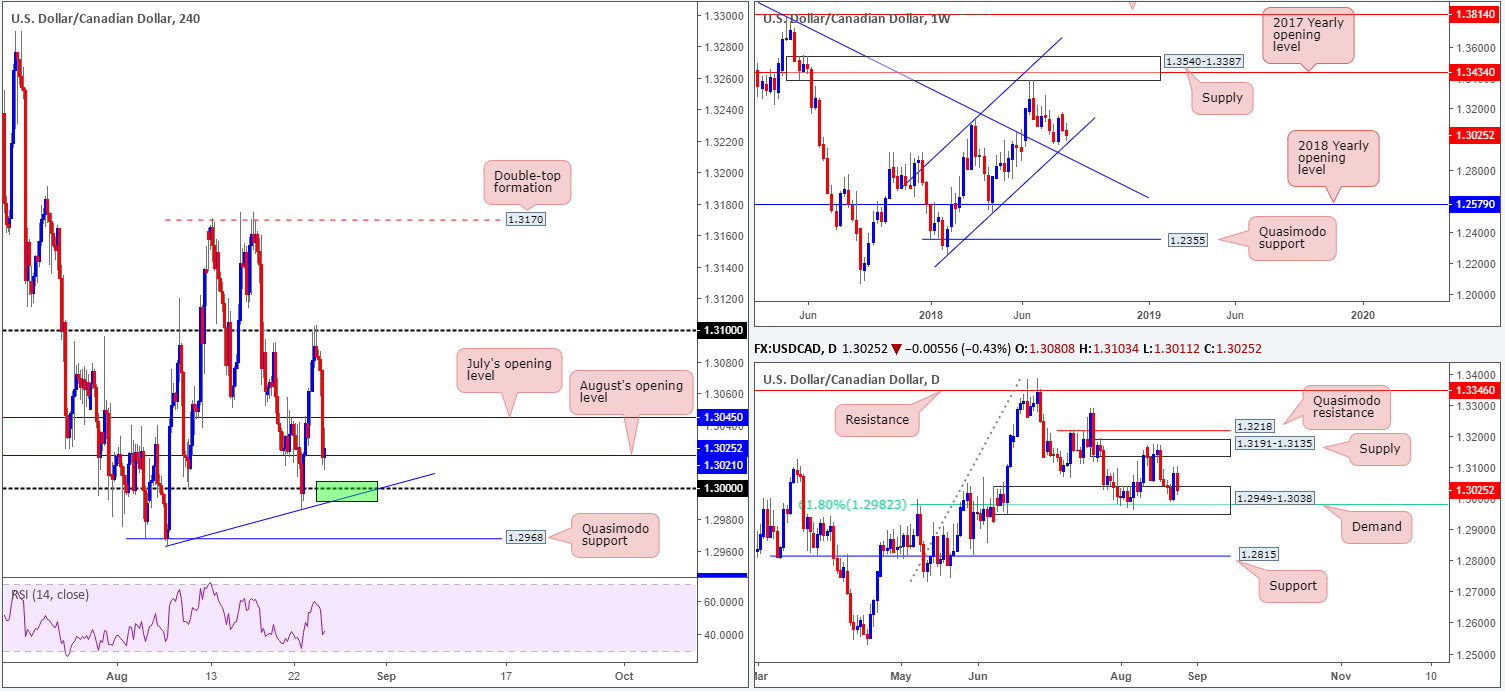
Since the beginning of the year, the USD/CAD has been compressing within an ascending channel formation (1.2247/1.3098). Of late, traders may have noticed the unit basing just north of the lower edge of this channel, seen bolstered by additional support in the form of a nearby trend line resistance-turned support (etched from the high 1.4689). These barriers could play a significant role in the weeks to come, traders.
Daily perspective:
The story on the daily timeframe brings supply at 1.3191-1.3135 and a demand base located at 1.2949-1.3038 into the picture. Note this demand also houses a 61.8% Fib support value at 1.2982. A break of this area has support at 1.2815 in view, whereas a push beyond supply almost immediately places the market at Quasimodo resistance drawn from 1.3218.
H4 perspective:
The 1.31 handle proved a valuable resistance on Friday. Trimming a large portion of Thursday’s gains, the buck, already under modest pressure, extended losses on the back of Fed’s Powell’s speech at Jackson Hole. July’s opening level at 1.3045 was taken out, leaving price action free to challenge August’s opening level at 1.3021 into the close, and challenge it did!
Beneath 1.3021, you’ll find key psychological support resting at 1.30 and a H4 trend line support (extended from the low 1.2962), followed closely by a Quasimodo support marked at 1.2968.
Areas of consideration:
As 1.30 intersects closely with H4 trend line support (green zone), this is likely to be of interest for possible longs this week. Not only is the psychological level positioned within the walls of the current daily demand and closely associated with the weekly channel support, one can also use the 61.8% daily Fib support level mentioned above at 1.2982 as a base to position stops below. The move from here could be quite something given the higher-timeframe areas involved! Ideally a close back above 1.3021 would be the first objective, though.
Today’s data points: Limited.
USD/CHF:
Weekly Gain/Loss: -1.21% (120 pips)
Weekly Close: 0.9829
Weekly perspective:
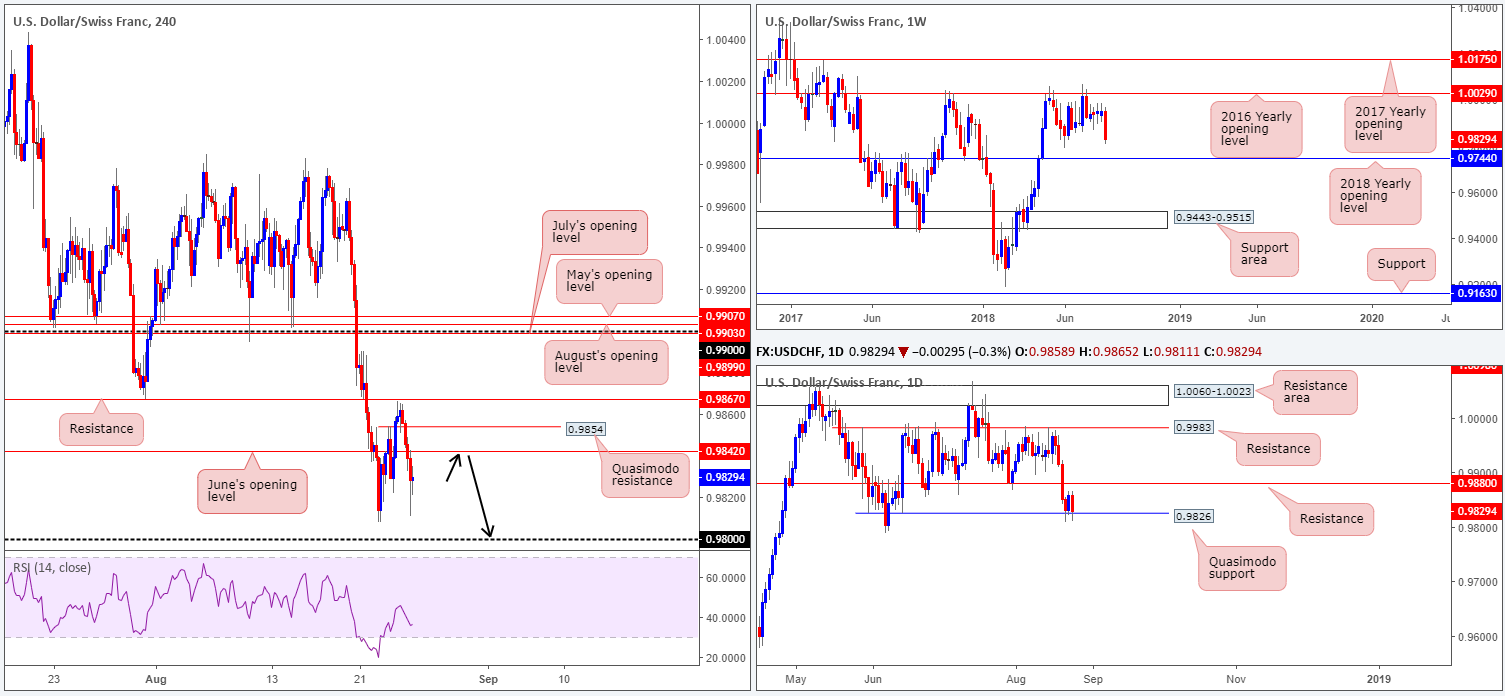
Considerable selling was observed on the USD/CHF over the course of last week’s sessions, forming a near-full-bodied bearish candle. Downside supports to keep eyeballs on this week fall in at June’s low 0.9788, followed by the 2018 yearly opening level at 0.9744.
Daily perspective:
Despite recent selling, the daily Quasimodo support level sited at 0.9826 remained in the fold. According to daily structure, upside is currently limited by resistance at 0.9880, whereas a decisive break of 0.9826 would likely be enough to bring in the 2018 yearly opening level at 0.9744 mentioned above on the weekly timeframe.
H4 perspective:
The greenback was, once again, playing on the defensive on Friday after coming within touching distance of resistance at 0.9867. The move lower, exacerbated on Fed’s Powell’s comments, drove through June’s opening level at 0.9842, though mildly pared losses into the closing bell just north of Wednesday’s low 0.9808.
Areas of consideration:
On the whole, a modest bearish vibe still exists in this market we feel. With weekly price showing room to probe lower and daily buyers displaying a lack of enthusiasm off Quasimodo support at 0.9826, the 0.98 handle on the H4 timeframe may enter the fight today/early this week.
On account of the above reading, a retest to the underside of June’s opening level at 0.9842 may be seen, targeting 0.98 as the initial take-profit zone (see black arrows). For those interested in taking shorts off 0.9842, it may be an idea to position stops above the nearby H4 Quasimodo resistance level at 0.9854.
Today’s data points: Limited.
Dow Jones Industrial Average:
Weekly Gain/Loss: +0.41% (105 points)
Weekly Close: 25800
Weekly perspective:
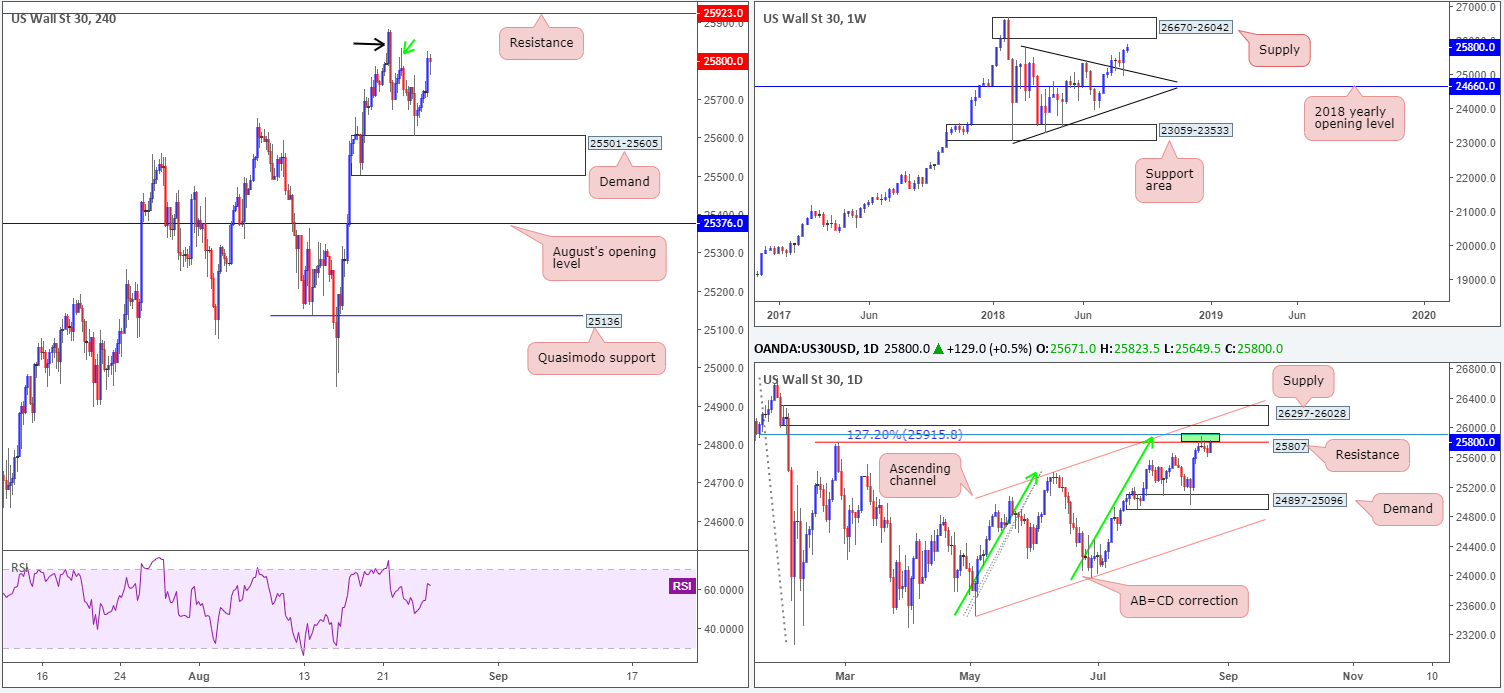
US equities eked out a second consecutive weekly gain last week, following a strong retest off a trend line resistance-turned support (etched from the high 25807) the week prior. From this point, we see no reason, technically on the weekly scale that is, why the index will not shake hands with supply coming in at 26670-26042 in the near future.
Daily perspective:
Upside on the daily timeframe remains capped after touching gloves with a small area of confluence at 25915/25807 (green zone – comprised of a resistance level at 25807 [Feb 27 high], a 127.2% AB=CD [green arrows] correction point at 25915 and a 78.6% Fib resistance at 25904). It is also worth noting beyond this area rests a supply zone pictured at 26297-26028, which not only intersects with a daily channel resistance (taken from the high 25399), it is also glued to the underside of the aforesaid weekly supply zone.
H4 perspective:
Fed Chairman Powell’s cautious stance on rate hikes boosted sentiment on Friday, allowing H4 price to build on Thursday’s bounce off demand at 25501-25605 and reach a session high of 25824. Because of the wick seen marked with a green arrow at 25832 likely consuming the majority of sellers at supply denoted with a black arrow at 25881-25794, resistance at 25923 may be brought into the action today/early week.
Areas of consideration:
With the underside of daily supply (26028) loitering just above the current H4 resistance at 25923, a break of this level is certainly plausible. Even more so as we know a few points above the underside of the daily base is the lower edge of weekly supply at 26042!
Therefore, shorting from 25923 is not considered a high-probability trade, as of writing.
We do, however, believe shorts are worthy of consideration this week from H4 supply at 26201-26024. An area (not seen on the screen) drawn from Feb 2018 that converges with both weekly and daily supply. With this strong higher-timeframe confluence, make sure to keep the H4 zone highlighted on your watchlists, traders!
Today’s data points: Limited.
XAU/USD (Gold)
Weekly Gain/Loss: +1.57% ($18.6)
Weekly Close: 1204.9
Weekly perspective:
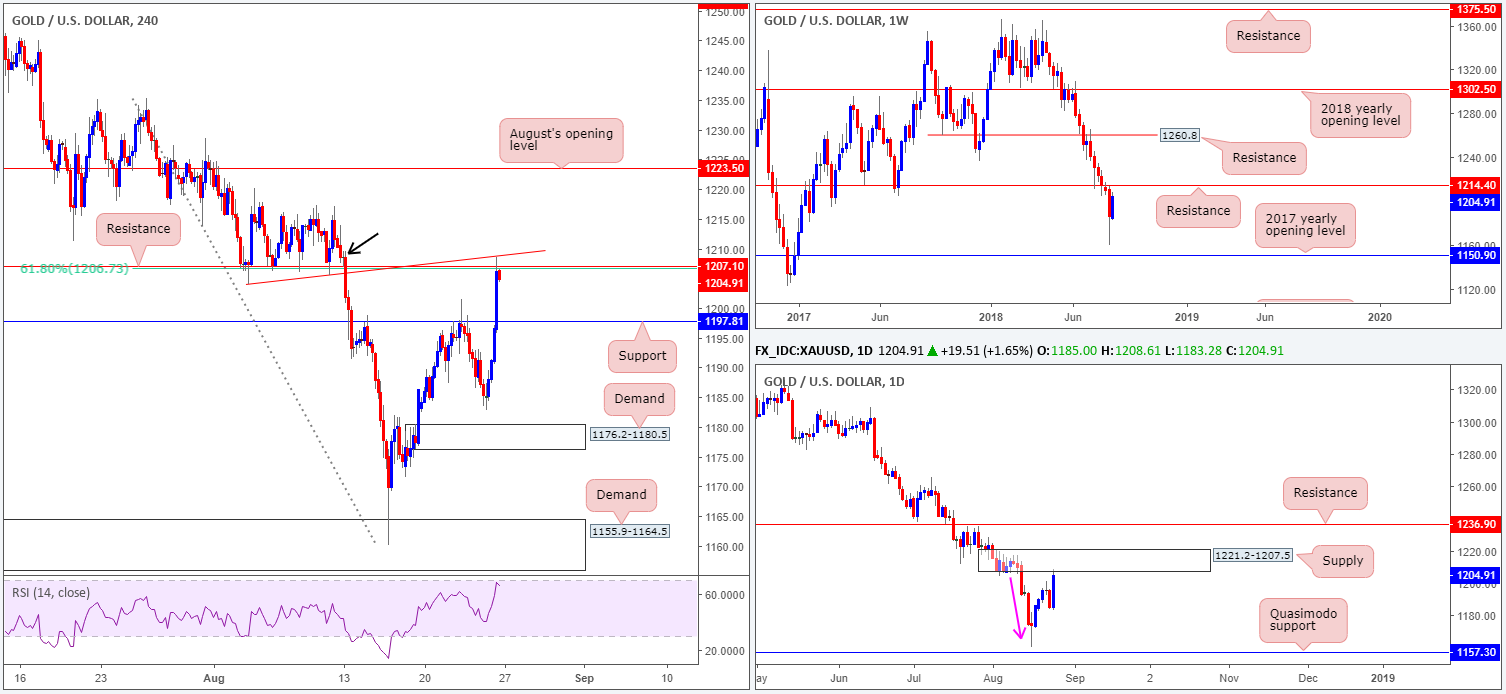
After six weeks of uninterrupted selling, the yellow metal turned a corner last week. Piggybacking off USD weakness, bullion concluded the week closing within striking distance of resistance plotted at 1214.4, a level that held strongly as support on May/July of 2017. As a result, this is not a barrier to overlook, fellow traders!
Daily perspective:
Encasing the current weekly resistance level is a daily supply zone seen at 1221.2-1207.5 (brought into the mix on Friday). Features worth mentioning here is the strong base comprised of a number of daily candles, and robust downside momentum produced from the zone (pink arrow). In addition to this, extra weight is credited to this area given it was effectively the obvious decision point to print 2018 yearly lows of 1160.3.
H4 perspective:
Having seen the USD extend its downside presence on Friday, the price of gold capitalized on this movement, breaking above resistance at 1197.8 (now acting support) and confronting resistance drawn from 1207.1 (fuses with nearby 61.8% Fib resistance at 1206.7 and trend line support-turned resistance [extended from the low 1204.1]). Note this resistance also effectively represents the underside of the aforementioned daily supply, supported further with the H4 RSI indicator seen nearing overbought territory.
Areas of consideration:
Owing to the H4 confluence seen surrounding the current H4 resistance level at 1207.1, along with daily supply at 1221.2-1207.5 recently entering the game, lower prices could potentially be on the horizon, targeting nearby H4 support at 1197.8 as the initial port of call. In regard to stop-loss placement, above the minor H4 supply (small kink) marked with a black arrow at 1209.6 is certainly an option.
The use of the site is agreement that the site is for informational and educational purposes only and does not constitute advice in any form in the furtherance of any trade or trading decisions.
The accuracy, completeness and timeliness of the information contained on this site cannot be guaranteed. IC Markets does not warranty, guarantee or make any representations, or assume any liability with regard to financial results based on the use of the information in the site.
News, views, opinions, recommendations and other information obtained from sources outside of www.icmarkets.com.au, used in this site are believed to be reliable, but we cannot guarantee their accuracy or completeness. All such information is subject to change at any time without notice. IC Markets assumes no responsibility for the content of any linked site. The fact that such links may exist does not indicate approval or endorsement of any material contained on any linked site.
IC Markets is not liable for any harm caused by the transmission, through accessing the services or information on this site, of a computer virus, or other computer code or programming device that might be used to access, delete, damage, disable, disrupt or otherwise impede in any manner, the operation of the site or of any user’s software, hardware, data or property.


