
EUR/USD:
Weekly gain/loss: -0.82%
Weekly closing price: 1.2293
Over the course of last week, the single currency turned lower and eroded much of the prior week’s upside move.
Longer term, the EUR/USD remains capped within a weekly supply base coming in at 1.2569-1.2287. Circling around the top edge of this area, traders may have also noticed a nice-looking Fibonacci resistance cluster (see below) and a long-term weekly trendline resistance taken from the high 1.6038.
- 61.8% Fib resistance at 1.2604 taken from the high 1.3993.
- 50.0% Fib resistance at 1.2644 taken from the high 1.4940.
- 38.2% Fib resistance at 1.2519 taken from the high 1.6038.
Meanwhile, looking down to the daily candles we can see that price concluded the week bottoming just ahead of a daily support area registered at 1.2246-1.2164. Given that this zone dates back to as far as Dec 2014 and has already proved its worth on two occasions this year; this is not an area to overlook. However, should this area give way, the next barrier of interest is a daily trendline support taken from the low 1.0569 and a nearby daily broken Quasimodo line coming in at 1.2070.
A quick recap of Friday’s trading on the H4 timeframe shows that the unit spent the majority of the day seesawing around the 1.23 handle, despite a number of FOMC members taking to the stage. As you can see though, the day did end marginally pushing below the psychological band and, therefore, placed the nearby H4 demand at 1.2235-1.2261 (positioned on top of the said daily support area) back in the spotlight.
Potential trading zones:
As highlighted in Friday’s morning report, this is a somewhat tricky market to trade at the moment, especially for those looking for medium to long-term positions.
On the one hand we have potential sellers from the noted weekly supply, but on the other hand there’s a strong-looking daily support area seen lurking just beneath current price action! Therefore, irrespective of the direction one selects here, you’ll have to entertain going up against some form of higher-timeframe structure.
From an intraday perspective, nevertheless, a short sub 1.23 could be an option, targeting the aforesaid H4 demand. To trade this move, it will require one drilling down to the lower timeframes and pinning down a setup. On the 15M chart there’s a bearish pennant formation (high – 1.2320 low – 1.2279) that looks about ready to blow! As such, waiting for price to close lower and then attempting to trade any retest of this pattern is certainly one avenue you could explore to achieve reasonable risk/reward from this intraday setup.
Data points to consider: ECB President Draghi speaks at 2pm; US new home sales at 3pm; FOMC member Quarles speaks at 8.15pm GMT.
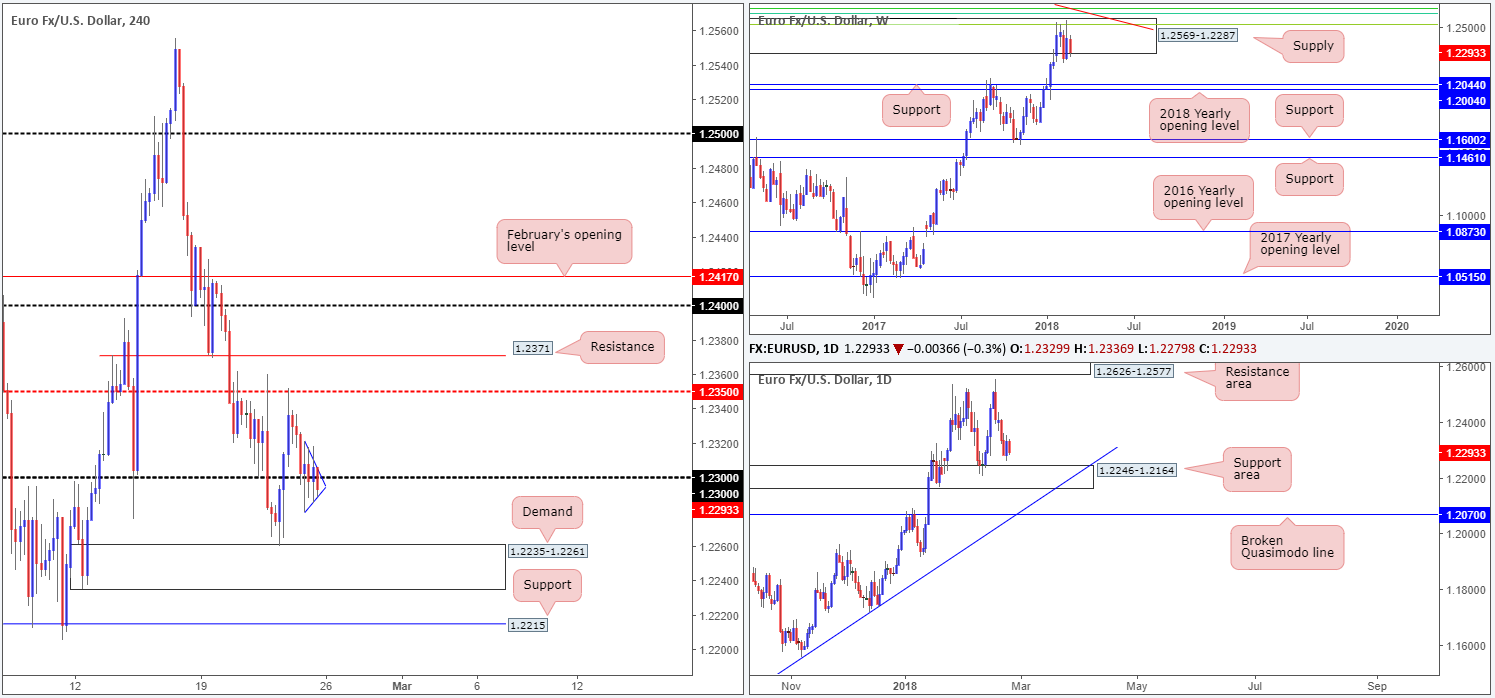
Areas worthy of attention:
Supports: 1.2235-1.2261; 1.2246-1.2164.
Resistances: 1.2569-1.2287; weekly Fib cluster; weekly trendline resistance; 1.23 handle.
GBP/USD:
Weekly gain/loss: -0.48
Weekly closing price: 1.3969
As we hope is demonstrated clearly on the weekly timeframe, price remains capped by a weekly resistance plotted at 1.4079, which is closely situated near a weekly trendline resistance etched from the high 1.5930. A push higher from here could open the gates for an approach up to the 2016 yearly opening level at 1.4732, whereas a move to the downside has the weekly support at 1.3653 to target. Another essential point worth considering is the weekly bearish inside candle formation that completed last week. This has likely excited candlestick traders given the current weekly resistance!
Structure on the daily timeframe brings a daily channel resistance taken from the high 1.2903 and a 61.8% daily Fib support at 1.3804 into view. Beyond the channel resistance we see a daily resistance area plotted at 1.4393-1.4297, while beneath 1.3804 there’s a daily broken Quasimodo line seen at 1.3616 that intersects with a daily channel support extended from the low 1.2108.
A closer look at price action on the H4 timeframe shows that the large psychological band 1.40 was brought into the fight on Friday, proving to be a key resistance throughout the week (green circle). As you can probably see, the path of least resistance from this point appears to be south, as above 1.40 we have a H4 trendline resistance etched from the high 1.4345. Downside appears reasonably free of support until the pair touches gloves with the 1.39 handle that converges with a H4 channel support taken from the low 1.3764.
Potential trading zones:
Although the 1.40 handle houses little higher -timeframe resistance, the closing H4 candle displays bearish intent, in our humble opinion. And considering that there’s space seen for the pair to stretch its legs, a sell from this point, targeting the 1.39 neighborhood, could be something to consider.
Data points to consider: MPC member Cunliffe speaks 6pm; US new home sales at 3pm; FOMC member Quarles speaks at 8.15pm GMT.
.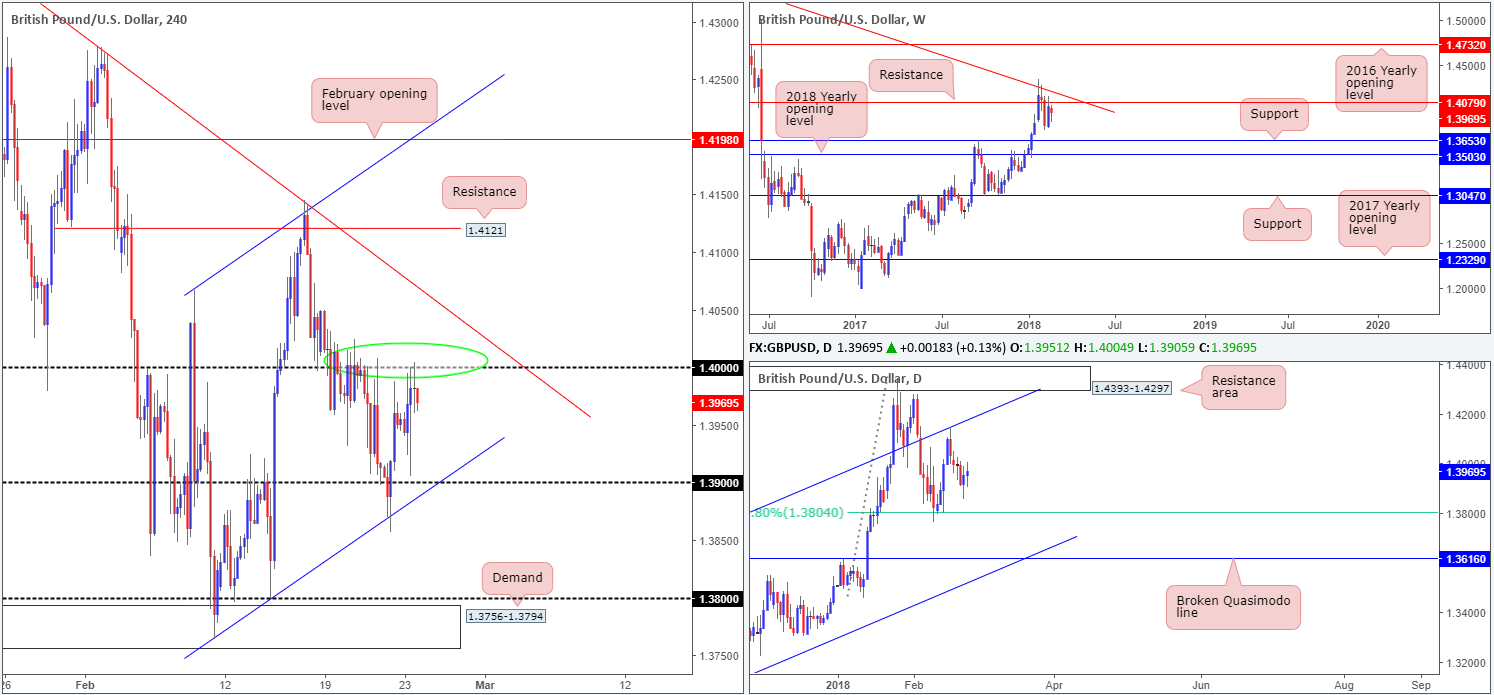
Areas worthy of attention:
Supports: 1.39 handle; H4 trendline support; 1.3804; 1.3616; daily channel support; 1.3653.
Resistances: 1.4079; 1.40 handle; daily channel resistance.
AUD/USD:
Weekly gain/loss: -0.95%
Weekly closing price: 0.7836
Despite a firm correction seen from the 2018 yearly opening level on the weekly timeframe at 0.7801, weekly price was unable to capitalize on this move last week. Reclaiming a large portion of the prior week’s gains, the commodity currency finished the week retesting 0.7801. Technically speaking, this may see the Aussie strike lower this week and potentially attempt to connect with a weekly channel support taken from the low 0.6827.
While the 2018 yearly opening level appears to be lacking substance, there may be a back-up area of support at 0.7699/0.7745 seen marked on the daily timeframe in green. Comprised of a broken Quasimodo line at 0.7699, a daily support pinged at 0.7732 and a daily 61.8% Fib support at 0.7745, this zone likely boasts enough confluence to hold price action, in our technical view.
A brief look at recent dealings on the H4 timeframe reveal that the pair found support off of the H4 trendline support taken from the low 0.7758, consequently wrapping up the week closing within striking distance of the H4 mid-level resistance at 0.7850. What this recent bounce has also brought into view is a potential H4 AB=CD 127.2% Fib ext. point at 0.7879, which is bolstered by a H4 resistance at 0.7876 and a H4 38.2% Fib resistance at 0.7867 (green zone).
Potential trading zones:
Ultimately, we favor the green H4 sell zone for sells this week. However, although you effectively have the backing of daily flow in selling this area until we reach 0.7699/0.7745, traders still need to keep in mind that you are simultaneously going up against potential weekly support.
Assuming that a bounce lower takes place from 0.7879/0.7867, we’d want to see 0.7850 quickly taken out. A H4 close beneath here would be a cue to begin looking to reduce risk to breakeven. The ultimate take-profit target from this region, however, should be the daily zone marked in green mentioned above.
Data points to consider: US new home sales at 3pm; FOMC member Quarles speaks at 8.15pm GMT.
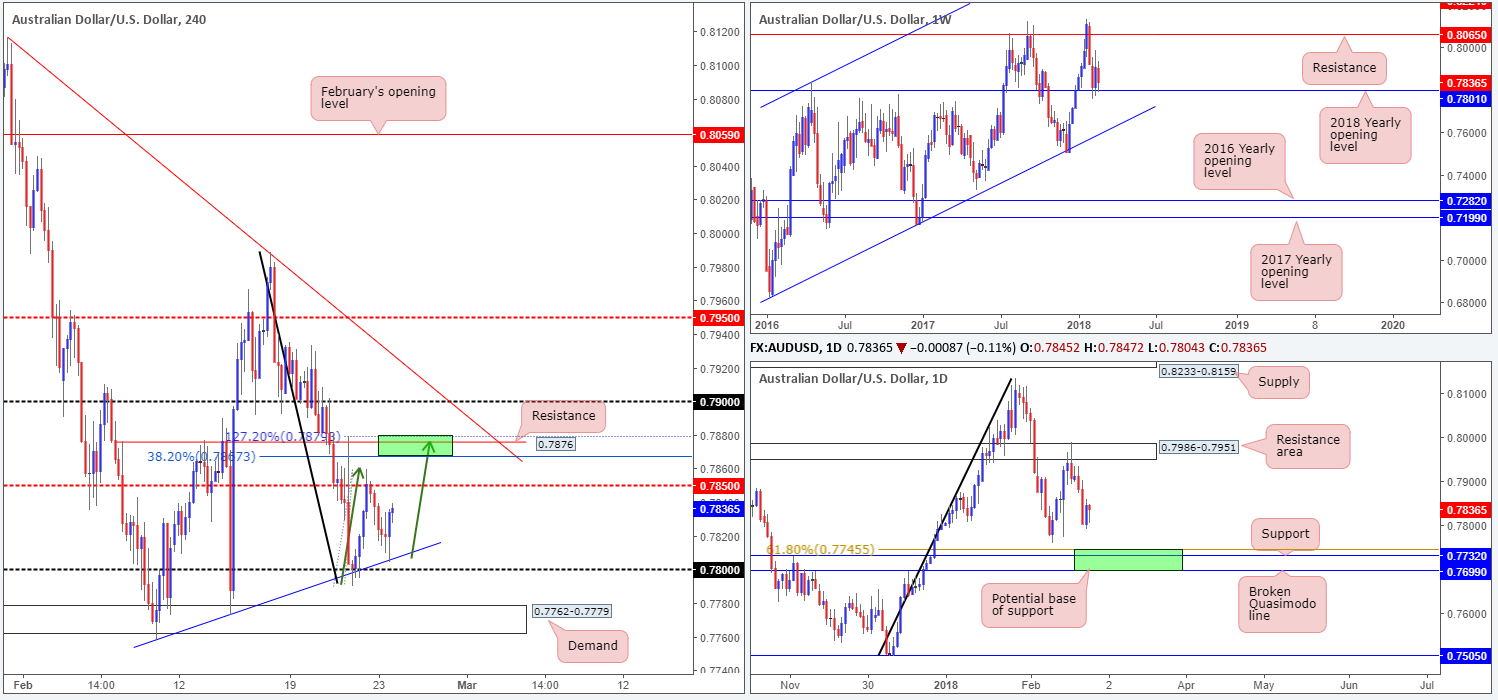
Areas worthy of attention:
Supports: 0.78 handle; H4 trendline support; 0.7801; 0.7699/0.7745.
Resistances: 0.7850; 0.7879/0.7867.
USD/JPY:
Weekly gain/loss: +0.45%
Weekly closing price: 106.85
The weekly support area at 105.19-107.54, as you can see, remains in the fray. But, for how long? Price made an attempt to strike higher levels but was unable to gain much ground thanks to a weekly trendline support-turned resistance extended from the low 98.78. The result of this printed a reasonably nice-looking weekly bearish selling wick. In the event that this encourages sellers into the market this week, a break of the current weekly support area could eventually see the unit shake hands with a weekly support at 100.61.
The story on the daily chart, nonetheless, reveals that the unit is currently compressed within a daily descending channel formation (113.38/108.28). Also in view is a daily support level penciled in at 105.50 and a daily broken Quasimodo line at 108.26. Both levels, in our opinion, carry equal weight.
Looking at Friday’s movement on the H4 timeframe, we can see that upside remained limited by the 107 handle and a H4 mid-level support at 106.50/H4 Fib 61.8% support at 106.47.
Potential trading zones:
In a nutshell, this is what we have so far:
- Weekly price echoing vulnerability within the current weekly support area – lower prices?
- Daily action could potentially bounce either way according to structure.
- H4 flow limited by the 107 handle/106.50 region.
To our way of seeing things, this market offers little in terms of confluence at this time. Therefore, we feel the best course of action is to remain on the bench and look to reassess structure on Tuesday.
Data points to consider: US new home sales at 3pm; FOMC member Quarles speaks at 8.15pm GMT.
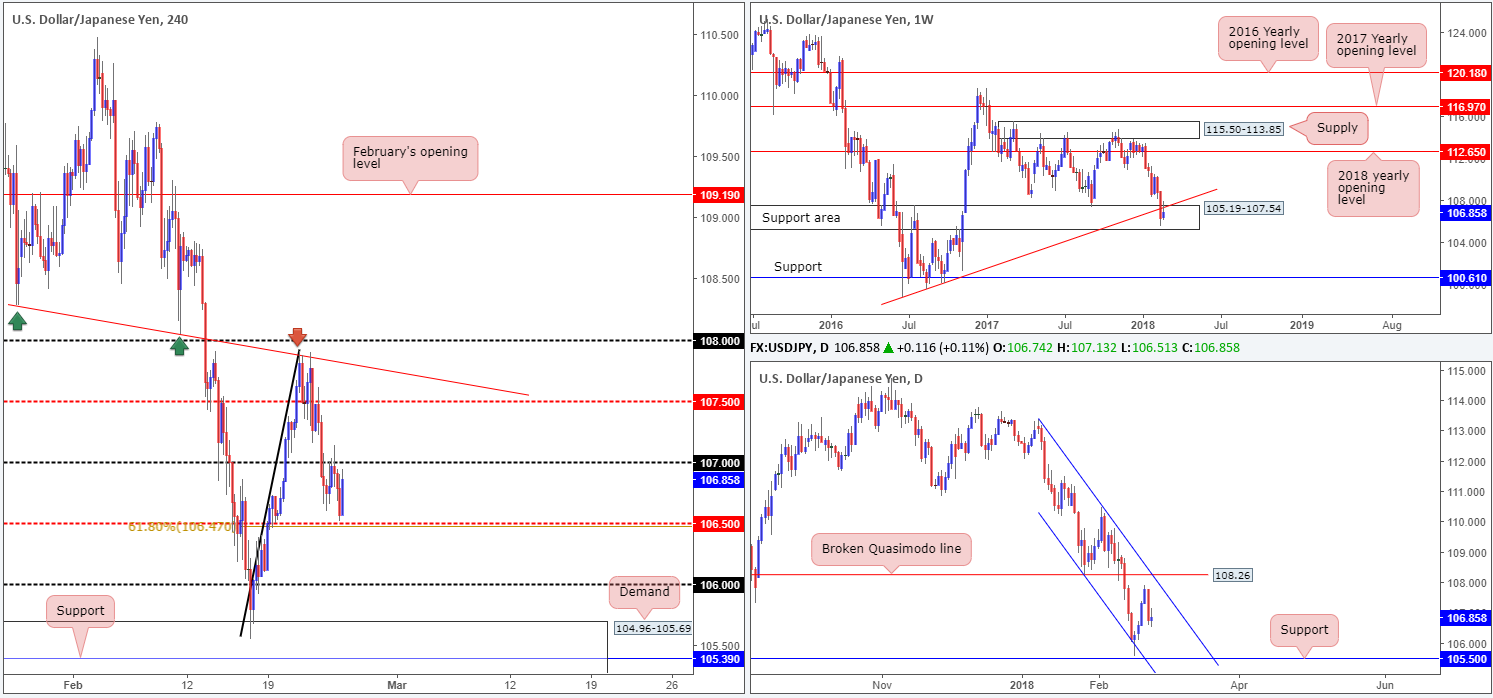
Areas worthy of attention:
Supports: 106.50; 105.50; 105.19-107.54.
Resistances: 108.26; 107 handle; weekly trendline resistance.
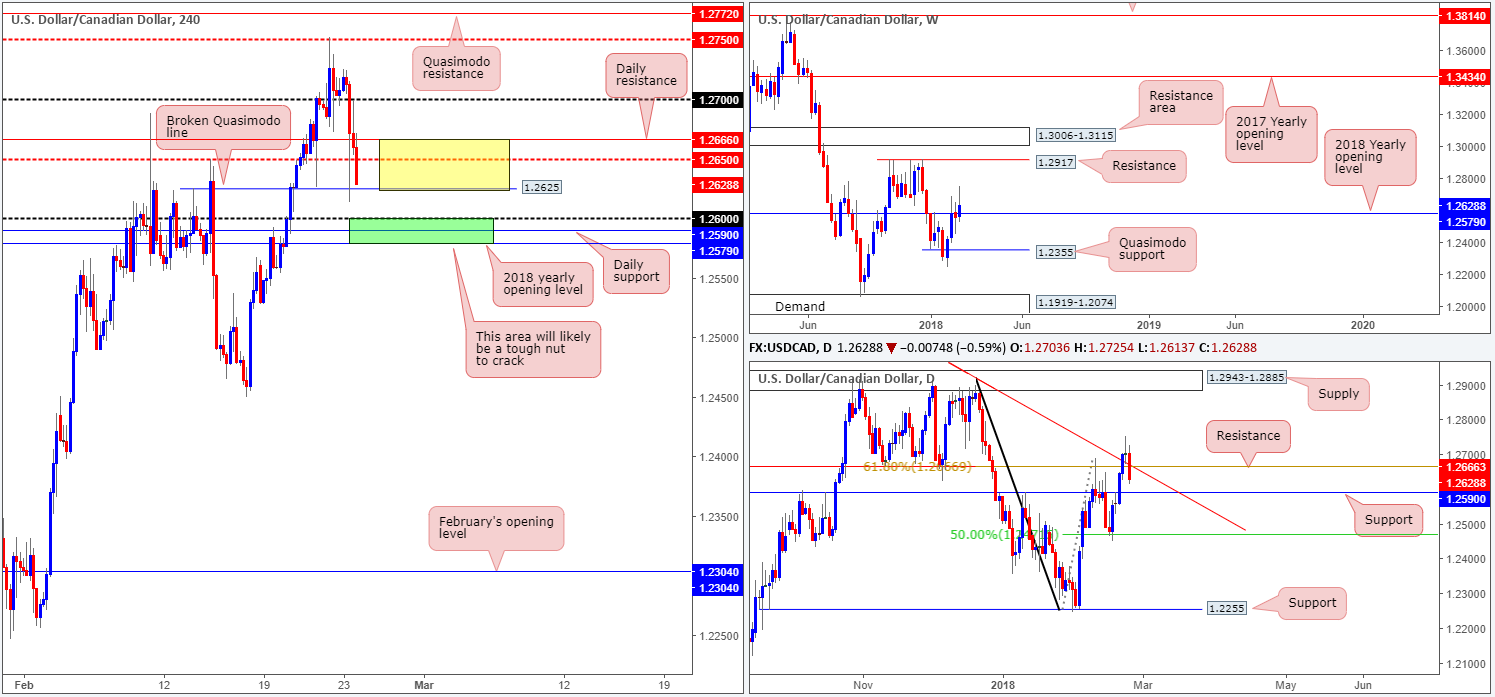
USD/CAD:
Weekly gain/loss: +0.78%
Weekly closing price: 1.2628
Looking at the weekly timeframe, it is clear to see that price managed to conquer the 2018 yearly opening level at 1.2579 last week, and potentially open up the path north to weekly resistance at 1.2917. While the weekly close above 1.2579 is considered a bullish cue, the team has noted concern regarding the end-of-week bearish correction. To print a tail of this size requires serious backing, and therefore could lead to price retesting 1.2579 sometime this week.
Daily price, as you can see, penetrated a daily resistance at 1.2666, a 61.8% Fib resistance and a daily trendline resistance taken from the high 1.3793 in one fell swoop on Wednesday, but failed to gain much ground the following day and ended the week reclaiming recent gains in the shape of a near-full-bodied daily bearish candle. The next base to keep an eyeball from here is seen nearby at 1.2590. Beyond here, there’s the 50.0% support value at 1.2471 to target.
Influenced by upbeat Canadian inflation, the USD/CAD collapsed lower in early US hours on Friday. The initial move saw the unit spike through the H4 mid-level support at 1.2650 and tap a H4 broken Quasimodo line at 1.2625, before recoiling a large portion of immediate losses. Downside continued to be the favored path, however, as 1.2650 was retaken, with the day closing out just ahead of the noted H4 broken Quasimodo line in the shape of a full-bodied H4 bearish candle.
Potential trading zones:
With the H4 broken Quasimodo line seen a few inches from current price, along with the 1.26 handle, the daily support level just below at 1.2590 and the 2018 yearly opening level seen just beneath that at 1.2579, selling this market is a challenge!
So what about looking for longs from 1.2579/1.26 (green H4 zone)? This is certainly a possibility we believe. The only grumble, though, is the collection of resistances seen overhead. Comprised of a daily resistance at 1.2666, the H4 mid-level resistance at 1.2650 and (what will be) resistance from the H4 broken Quasimodo line at 1.2625 (yellow zone), is likely going to be an area sellers will be looking to make an appearance. Therefore, trade cautiously here, traders.
Data points to consider: US new home sales at 3pm; FOMC member Quarles speaks at 8.15pm GMT.
Areas worthy of attention:
Supports: 1.2625; 1.2579/1.26; 1.2471.
Resistances: 1.2650; 1.2666; 1.2917.
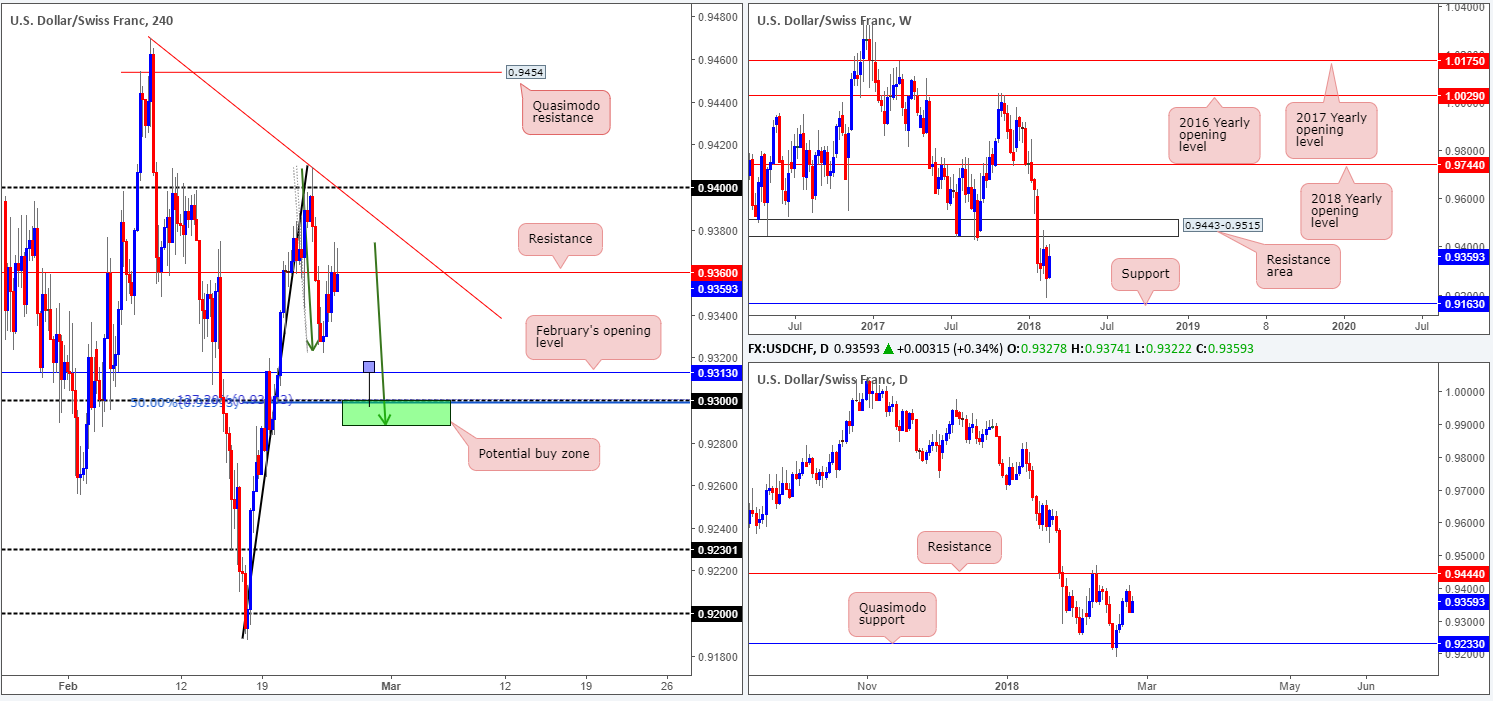
USD/CHF:
Weekly gain/loss: +0.88%
Weekly closing price: 0.9359
Despite leaving the weekly support at 0.9163 unchallenged, the USD/CHF managed to reclaim a major portion of recent losses last week! Overall, though, weekly price remains somewhat restricted by a weekly resistance area at 0.9443-0.9515 and the aforementioned weekly support. Both barriers, in our book, carry equal weight.
In a similar fashion to the weekly timeframe, the daily candles are also encased within two opposing levels: a daily resistance band at 0.9444 (essentially represents the lower edge of the noted weekly resistance area) and a daily Quasimodo support positioned at 0.9233.
Thankfully, things get a little bit more interesting on the H4 timeframe. As you can see, Friday’s session concluded with the candles rejecting the H4 resistance level planted at 0.9360. Continued selling from this point will likely eye February’s opening level at 0.9313, followed closely by the 0.93 handle. Traders may have also noticed that this psychological handle boasts a H4 38.2% Fib support and a H4 AB=CD (green arrows) 127.2% Fib ext. point, with its symmetrical completion seen at 0.9289 (green zone).
Potential trading zones:
Although the green H4 zone holds no higher-timeframe structure, its H4 confluence is striking.
An ideal scenario would be a fakeout through February’s opening level at 0.9313 into our noted green zone (see the H4 timeframe’s image). This, in our view, is considered a strong bullish cue, and could potentially drag the pair up as far as the aforementioned H4 resistance.
Data points to consider: US new home sales at 3pm; FOMC member Quarles speaks at 8.15pm GMT.
Areas worthy of attention:
Supports: 0.9289/0.93; 0.9313; 0.9163; 0.9233.
Resistances: 0.9360; 0.9444; 0.9443-0.9515.
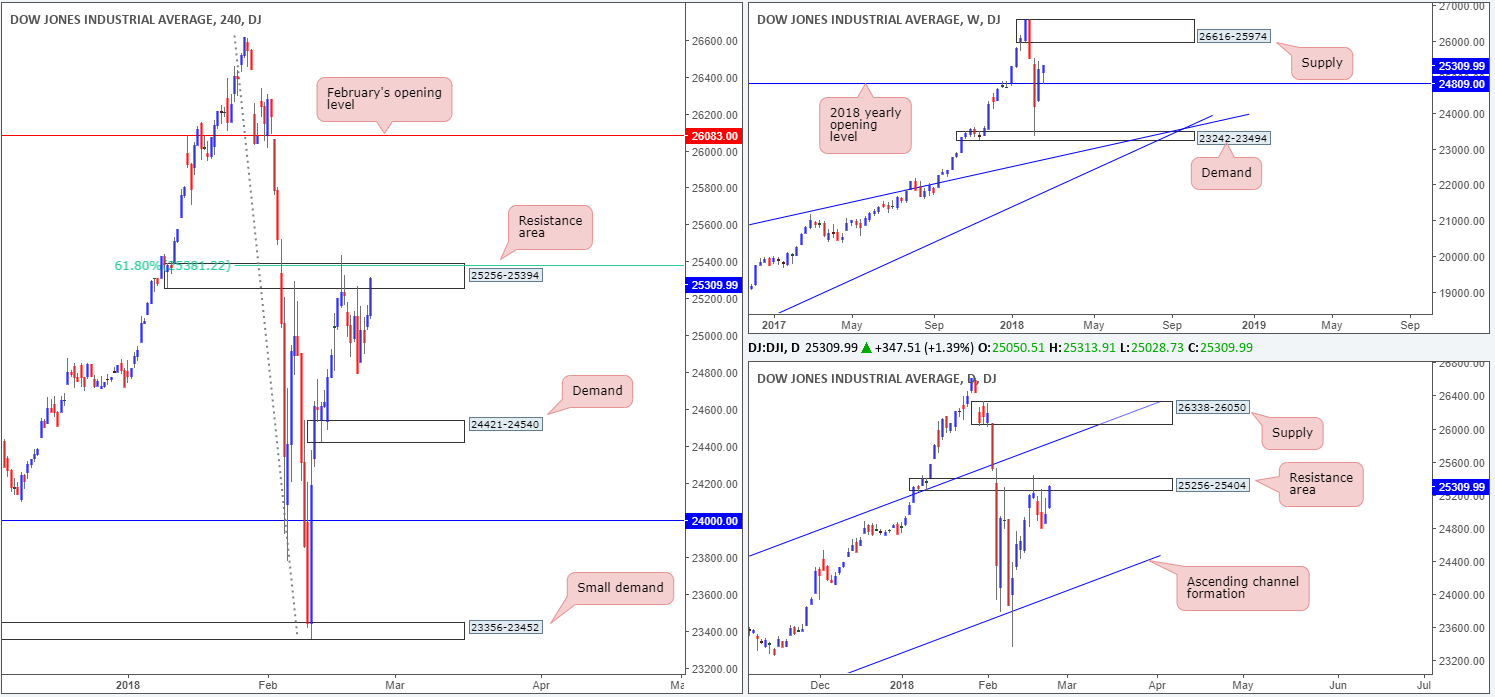
DOW 30:
Weekly gain/loss: +0.36%
Weekly closing price: 25309
US equities reaffirmed a positive stance last week, following a near to-the-pip retest of the 2018 yearly opening level seen on the weekly timeframe at 24809. Shaped in the form of a weekly buying tail (also known as bullish pin bar), the retest could attract buyers and eventually reconnect with a weekly supply zone pegged at 26616-25974.
Before one considers a long position in this market, nevertheless, there is a daily resistance area coming in at 25256-25404 that needs to be engulfed. Taking out this zone potentially clears upside to a daily channel resistance extended from the high 21169.
The basis of Friday’s rally, which brought H4 price back up to within the walls of a H4 resistance area at 25256-25394 (houses a 61.8% Fib resistance band at 25381 and is seen encased within the aforesaid daily resistance area), was, we believe, due to investor confidence that the Jerome Powell-led Federal Reserve won’t rush to raise interest rates as the economy picks up steam.
A decisive push above the current H4 resistance area places February’s opening level at 26083 in the spotlight.
Potential trading zones:
Despite the 2018 yearly opening level being in motion, we would be hesitant buyers in this market! Entering long when both H4 and daily action show limited upside potential is not something our team would label a high-probability setup!
Therefore, traders may want to consider waiting for a H4 close to form above the noted H4 resistance area. This – coupled with a successful retest would, in our technical view, be enough to validate a long trade up to at least the daily channel resistance underscored above.
Data points to consider: US new home sales at 3pm; FOMC member Quarles speaks at 8.15pm GMT.
Areas worthy of attention:
Supports: 24421-24540; 23242-23494; 24809.
Resistances: 25256-25394; 25381; 26616-25974; 25256-25404.
GOLD:
Weekly gain/loss: -1.29%
Weekly closing price: 1328.2
As the US dollar attempts to recover, gold and most major currencies dipped lower last week. As is seen on the weekly timeframe, further selling could be on the cards for the yellow metal this week as the next downside target does not come onto the radar until we reach the 2018 yearly opening level at 1302.5, which happens to align beautifully with a weekly channel support taken from the low 1122.8. Before gold can reach the yearly base line, however, daily price must first contend with a daily support area painted in blue at 1308.4/1316.9 (comprised of a daily support and 38.2% Fib support level).
H4 resistance at 1330.1 held firm throughout Friday’s segment, despite suffering multiple breaches to the upside. Assuming that this line holds ground – other than the newly formed H4 Quasimodo support at 1322.0 – we do not see a whole lot stopping the H4 candles from driving as far south as the daily support level coming in at 1308.4. The green arrows marked on the H4 chart resemble consumption tails. Our rationale behind this is simply that unfilled buy orders were triggered prior to price lifting higher; therefore when price returns to this location, downside should theoretically be reasonably free.
Potential trading zones:
The week ended chalking up a near-full-bodied H4 bearish candle around the underside of the noted H4 resistance level. Given the space seen to move lower on the bigger picture, this candlestick signal is, we believe, enough to drag prices lower. Should you look to take advantage of this potential move, traders are advised to reduce risk to breakeven around the current H4 Quasimodo support as active buyers are likely going to be present. However, the ultimate target for shorts is 1316.9, followed closely by 1308.4.

Areas worthy of attention:
Supports: 1322.0; 1308.4/1316.9; 1302.5.
Resistances: 1330.1.
This site has been designed for informational and educational purposes only and does not constitute an offer to sell nor a solicitation of an offer to buy any products which may be referenced upon the site. The services and information provided through this site are for personal, non-commercial, educational use and display. IC Markets does not provide personal trading advice through this site and does not represent that the products or services discussed are suitable for any trader. Traders are advised not to rely on any information contained in the site in the process of making a fully informed decision.
This site may include market analysis. All ideas, opinions, and/or forecasts, expressed or implied herein, information, charts or examples contained in the lessons, are for informational and educational purposes only and should not be construed as a recommendation to invest, trade, and/or speculate in the markets. Any trades, and/or speculations made in light of the ideas, opinions, and/or forecasts, expressed or implied herein, are committed at your own risk, financial or otherwise.
The use of the site is agreement that the site is for informational and educational purposes only and does not constitute advice in any form in the furtherance of any trade or trading decisions.
The accuracy, completeness and timeliness of the information contained on this site cannot be guaranteed. IC Markets does not warranty, guarantee or make any representations, or assume any liability with regard to financial results based on the use of the information in the site.
News, views, opinions, recommendations and other information obtained from sources outside of www.icmarkets.com.au, used in this site are believed to be reliable, but we cannot guarantee their accuracy or completeness. All such information is subject to change at any time without notice. IC Markets assumes no responsibility for the content of any linked site. The fact that such links may exist does not indicate approval or endorsement of any material contained on any linked site.
IC Markets is not liable for any harm caused by the transmission, through accessing the services or information on this site, of a computer virus, or other computer code or programming device that might be used to access, delete, damage, disable, disrupt or otherwise impede in any manner, the operation of the site or of any user’s software, hardware, data or property.


