
EUR/USD:
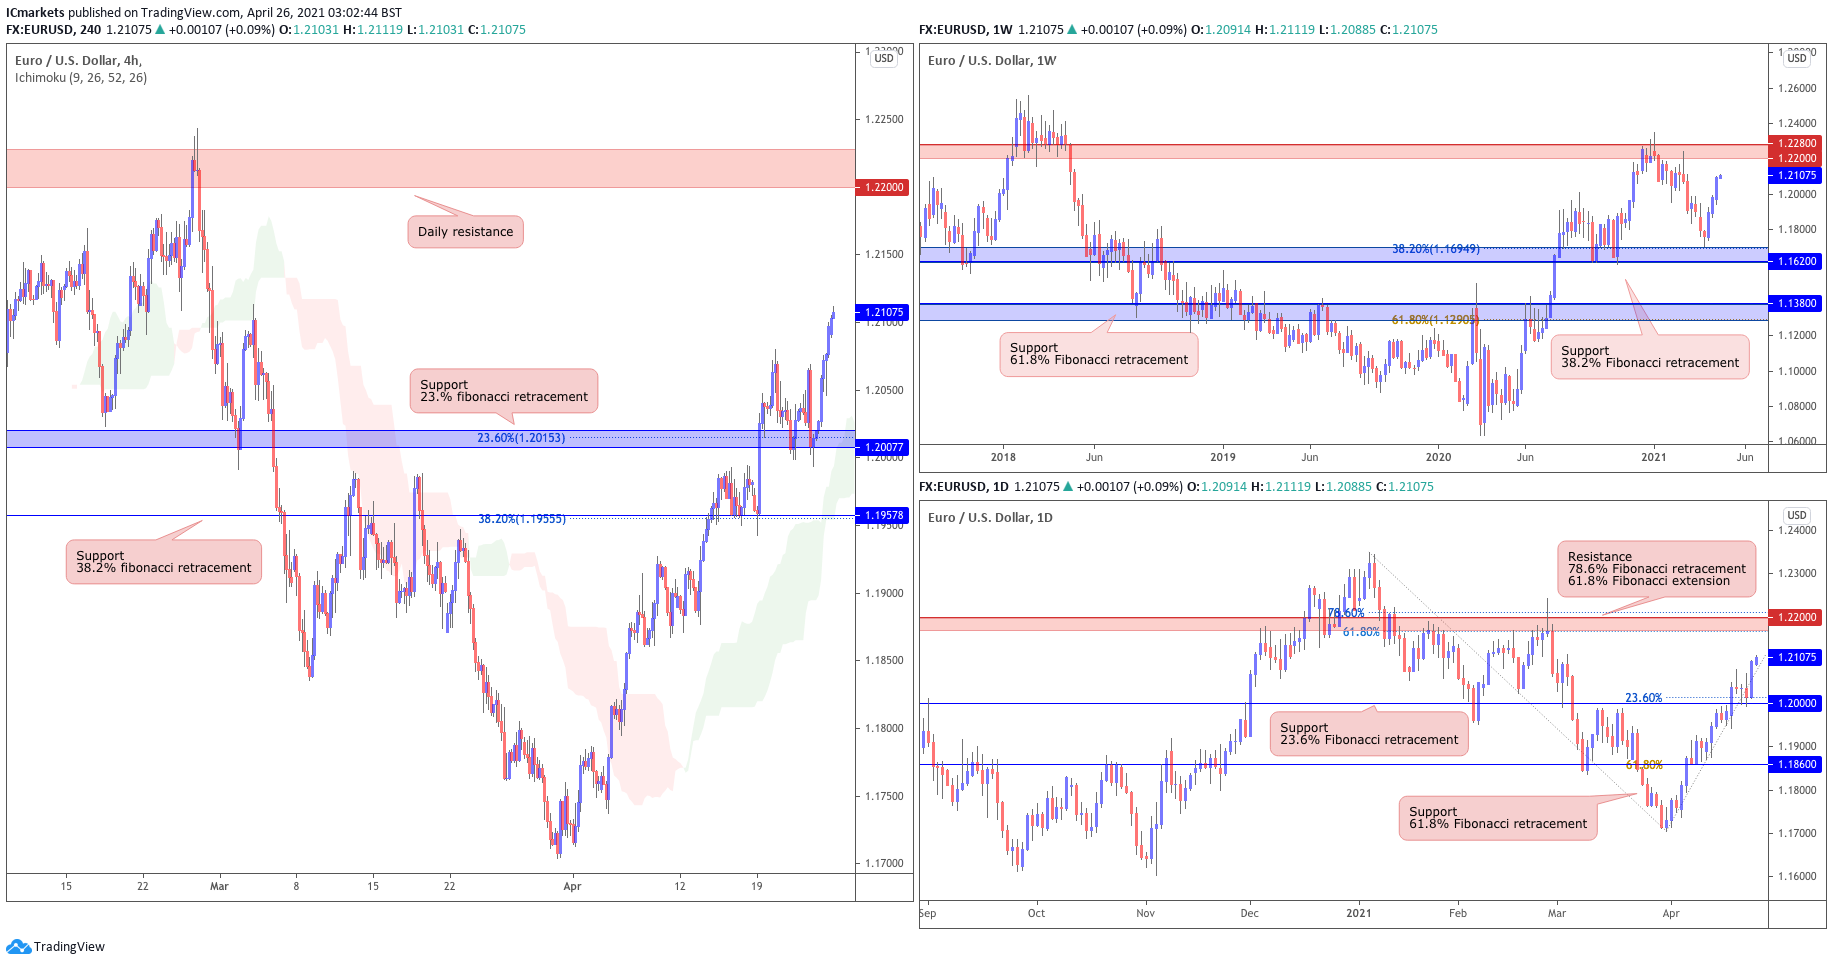
Looking at the weekly chart, we can see that prices are seeing further limited upside before it reaches our resistance area at 1.22000 – 1.22800. On the daily chart, it echoes the same bullish view as well, where prices are facing bullish pressure from our support level at 1.2000, in line with the 23.6% fibonacci retracement where we might see more upside above this level.
On the H4 timeframe, prices are facing bullish pressure from our support at 1.20077, in line with the graphical area, 23.6% Fibonacci retracement where we could see a limited upside above this level, with 1.22000 resistance as our first target. Otherwise, failure to hold above 1.20077 support could see price swing lower towards the 1.19578 area.
Areas of consideration:
- 22000 resistance area found on H4 time frame
- 20077 support area found on H4 time frame
GBP/USD:
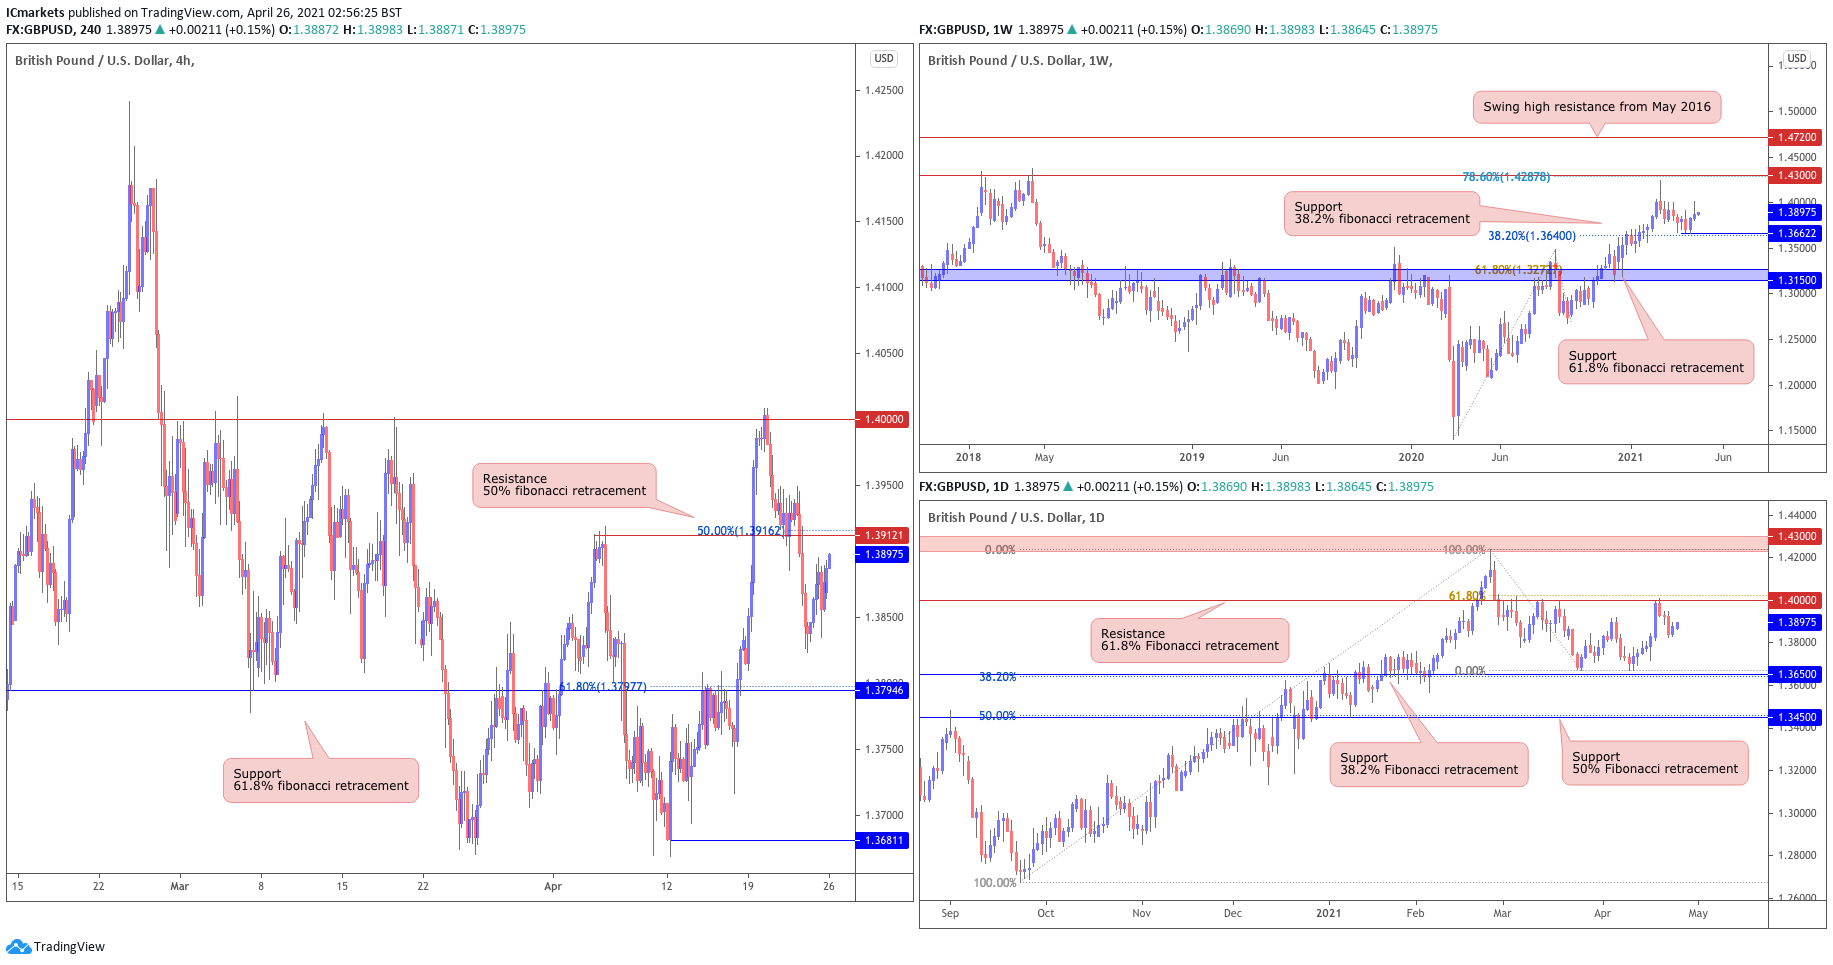
Looking at the weekly chart, we can see that prices are facing bullish pressure from our support at 1.36622, in line with our 38.2% fibonacci retracement and could see a further upside before it reaches our first resistance target at 1.43000. On the daily time frame, prices are approaching our resistance level at 1.4000 level, in line with 61.8% Fibonacci retracement.
On the H4 timeframe, prices are facing bearish pressure from our resistance at 1.39121, in line with our 50% fibonacci retracement where we could see a reversal below this level, with 1.37946 as our support target.
Areas of consideration:
- 39121 resistance area found on H4 time frame
- 37946 support area found on H4 timeframe
AUD/USD:
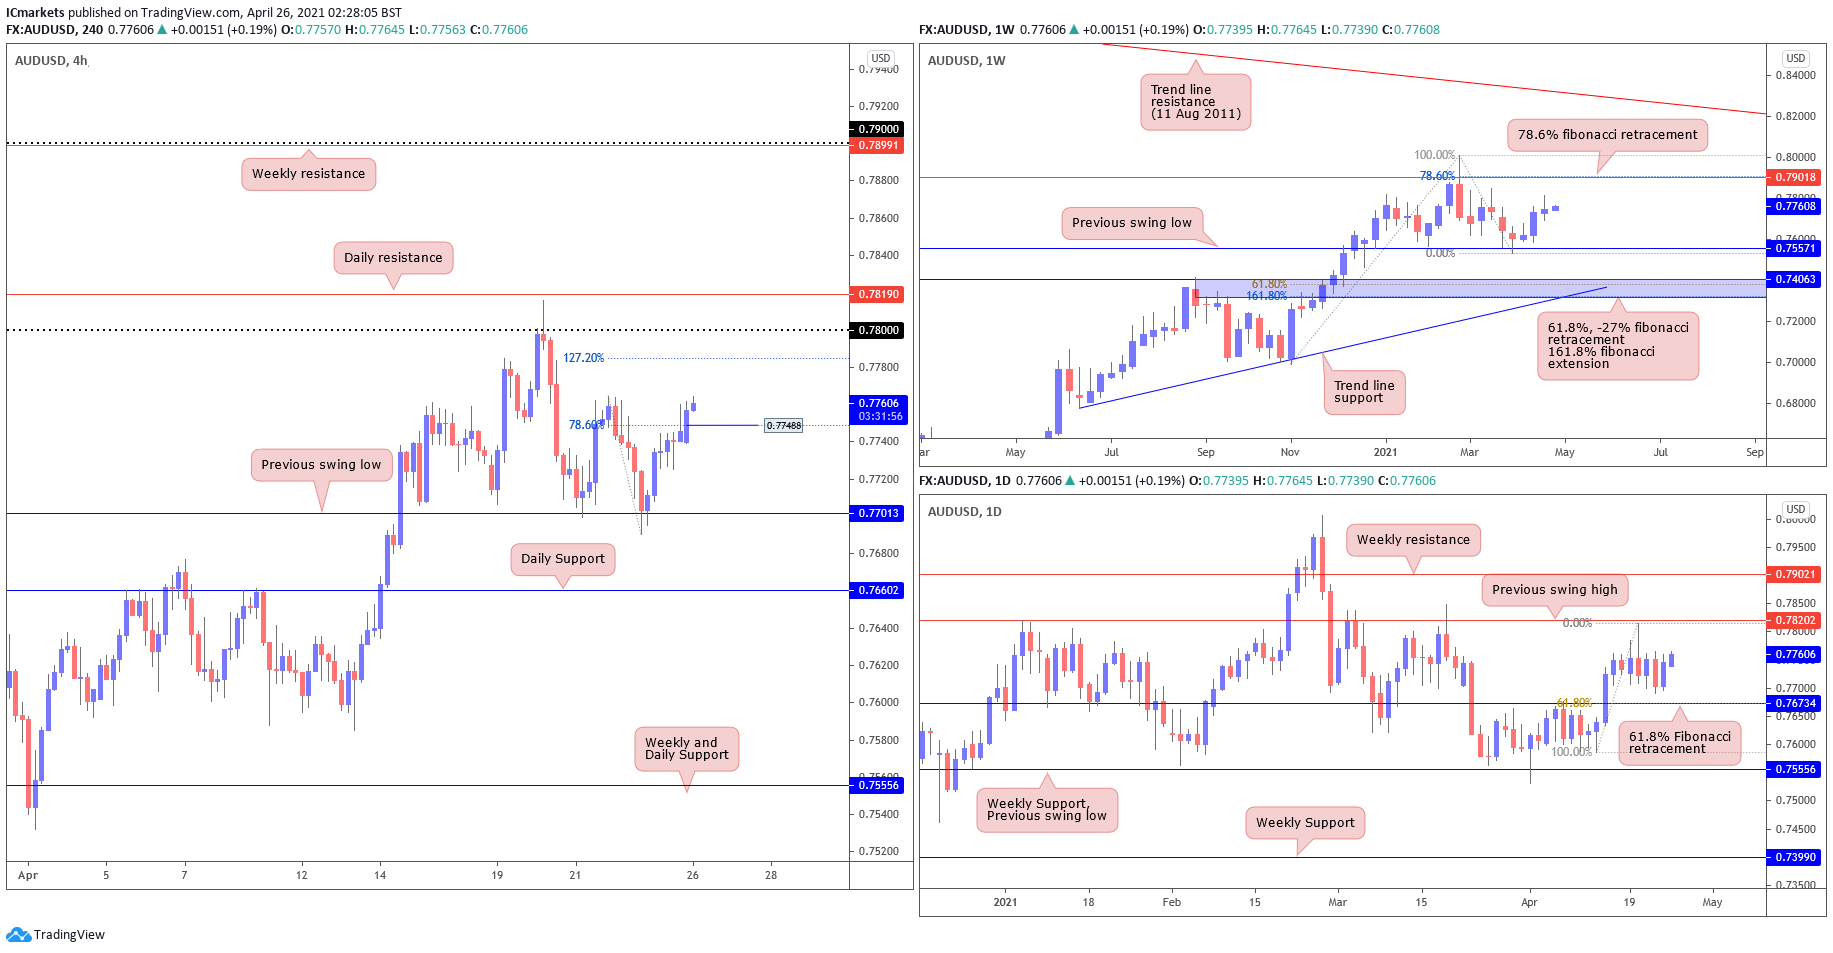
From the Weekly timeframe, price is making a consistent upward move towards where it may find resistance at 78.6% fibonacci retracement level of 0.79018. From the daily timeframe, we see prices making higher highs from the previous days candles.
On the H4 timeframe, price has been very bullish in the past few candles, and using fibonacci retracement on the last swing leg, we could see that price has broken above the 78.6% fibonacci retracement level at 0.77488, where we may potentially see it push higher towards 127% fibonacci retracement and previous swing high level near the major figure of 0.78.
Areas of consideration:
- H4 might retest 0.77488 before pushing higher towards 0.78 major figure.
- Daily and weekly timeframes show more space for upside.
USD/JPY
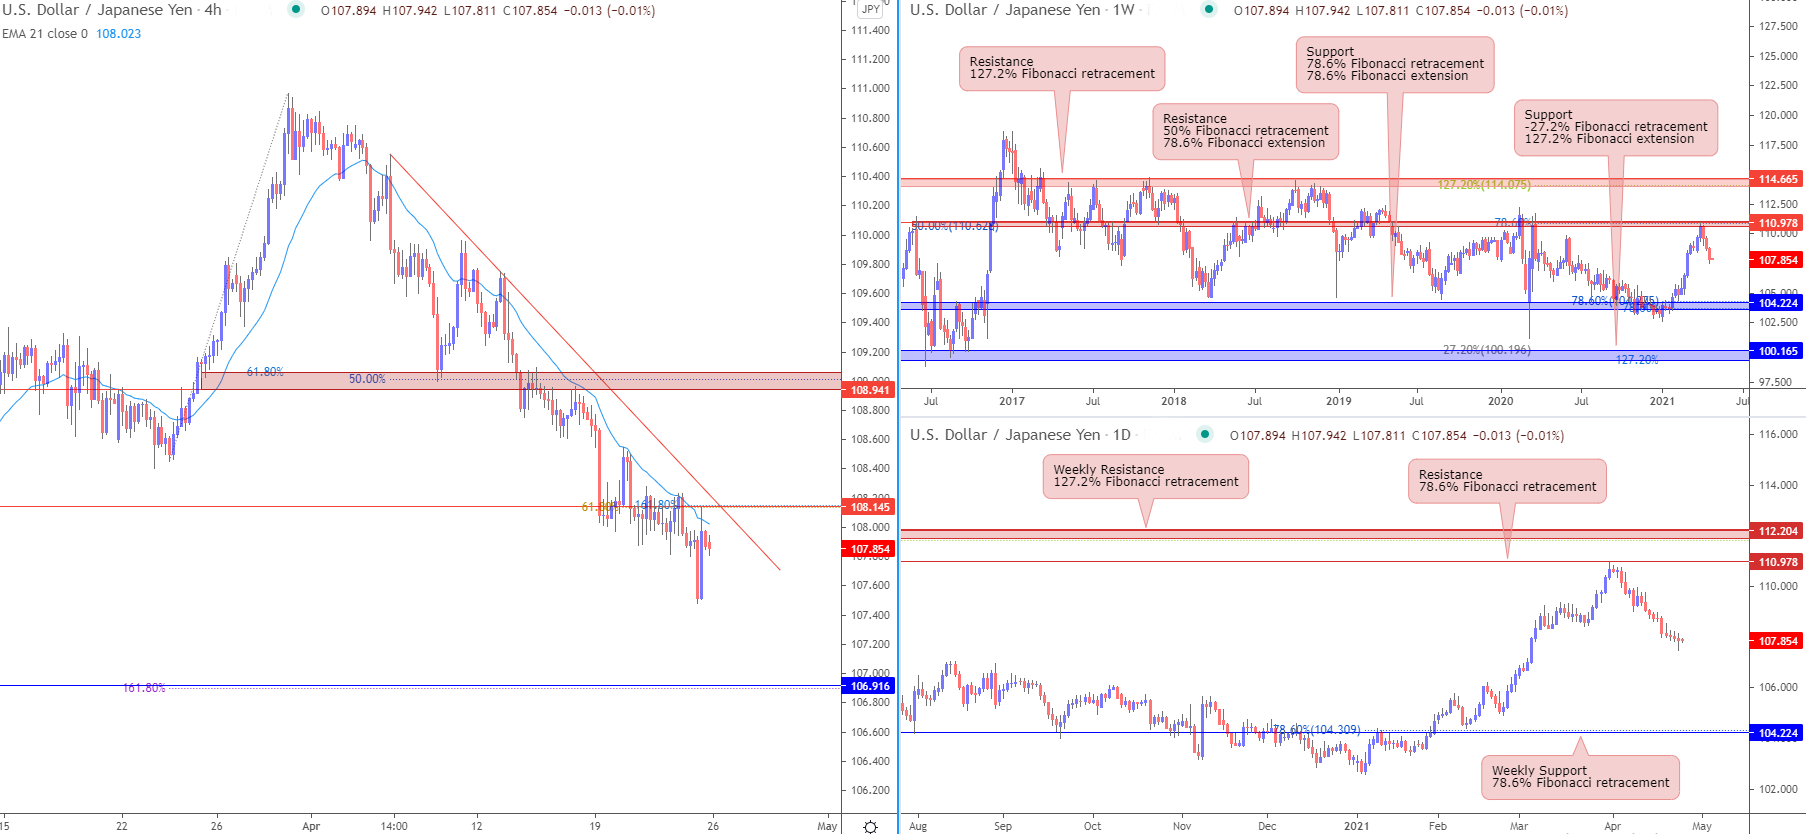
From the weekly timeframe, prices are facing resistance from horizontal swing high resistance which coincides with 50% Fibonacci retracement and 78.6% Fibonacci extension, taking support from 104.224 level which is in line with 78.6% FIbonacci retracement and 78.6% FIbonacci extension. On the daily time frame, prices have broken the ascending trendline support, and is looking to push down towards horizontal swing low support, in line with weekly support level.
On the H4 timeframe, prices are facing bearish pressure from descending trendline resistance. Prices might push down towards horizontal pullback support, in line with 161.8% FIbonacci retracement. EMA is also above prices, showing a bearish pressure for prices.
Areas of consideration:
- On the H4, prices might push up to horizontal swing high resistance of 109.934
- Price facing resistance from 110.978 on weekly
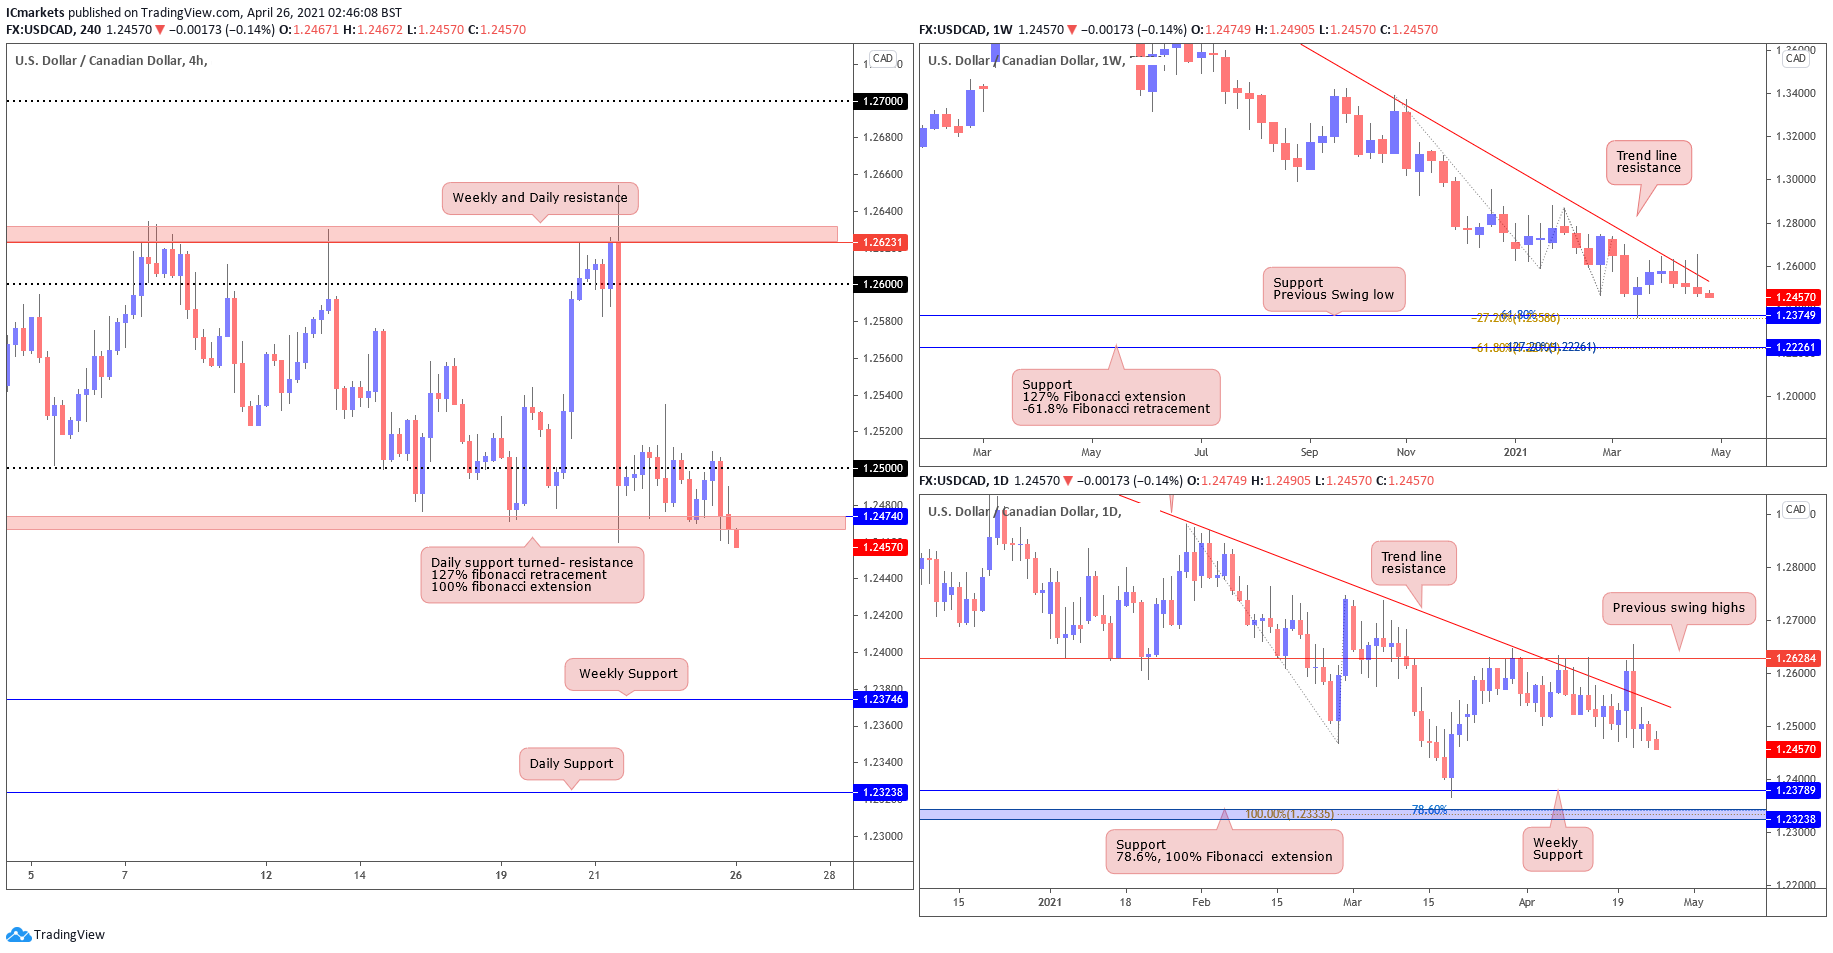
USD/CAD:
The weekly chart shows price respecting the descending trendline, and pushed away from the weekly 1.26464 resistance. The daily chart shows that price has been making a steady move downwards towards the Weekly support and even towards Daily support at 1.23238, in line with 78.6% and 100% fibonacci extension.
The H4 chart shows price breaking under the 1.24675 level in line with 127% fibonacci retracement and 100% fibonacci extension, we might be able to catch a retest of this level before price push further lower towards 1.23746
Areas of consideration:
- The weekly and daily time frame a respect of the descending trendline.
- On H4, price may be pushing lower since breaking the level of 1.24675.
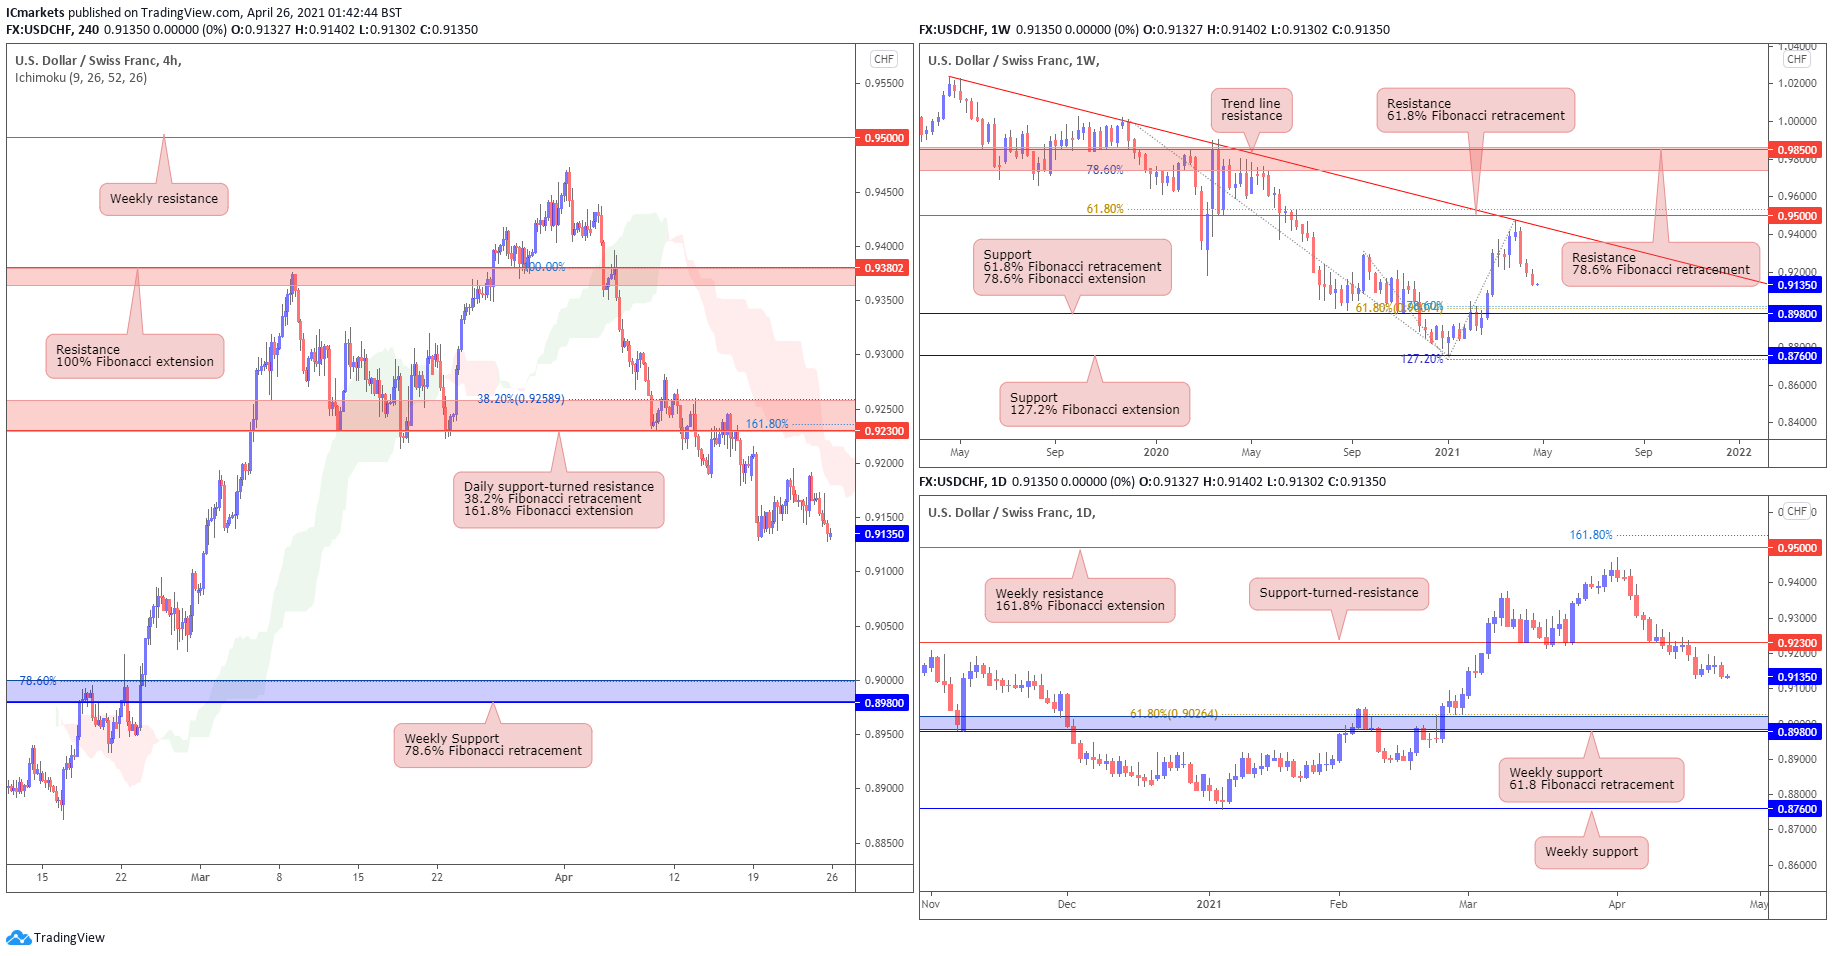
USD/CHF:
USD/CHF has seen a reversal at the descending trendline resistance and is now holding below the weekly 0.95000 resistance level which is in line with our 61.8% Fibonacci retracement. The daily chart shows that price has broken below the key daily 0.92300 support-turned-resistance, re-tested and is now pushing lower. We could potentially see further downside from here towards the next daily 0.89800 support level.
On the H4 chart, we can see that price is now holding below both the Ichimoku cloud, showing bearish pressure in line with our bearish bias. Price is also now holding below the daily 0.92300 support-turned-resistance area, which is in line with our 38.2% Fibonacci retracement and 161.8% Fibonacci extension, where we could potentially see further downside from here towards our weekly 0.89800 support in line with 78.6% Fibonacci retracement. Otherwise, should price break above the daily 0.92300 level, it could swing towards 0.93802 resistance instead.
Areas of consideration:
- Price is facing bearish pressure as it holds below the Ichimoku cloud.
- We could potentially see price swing towards the next 0.89800 weekly support.
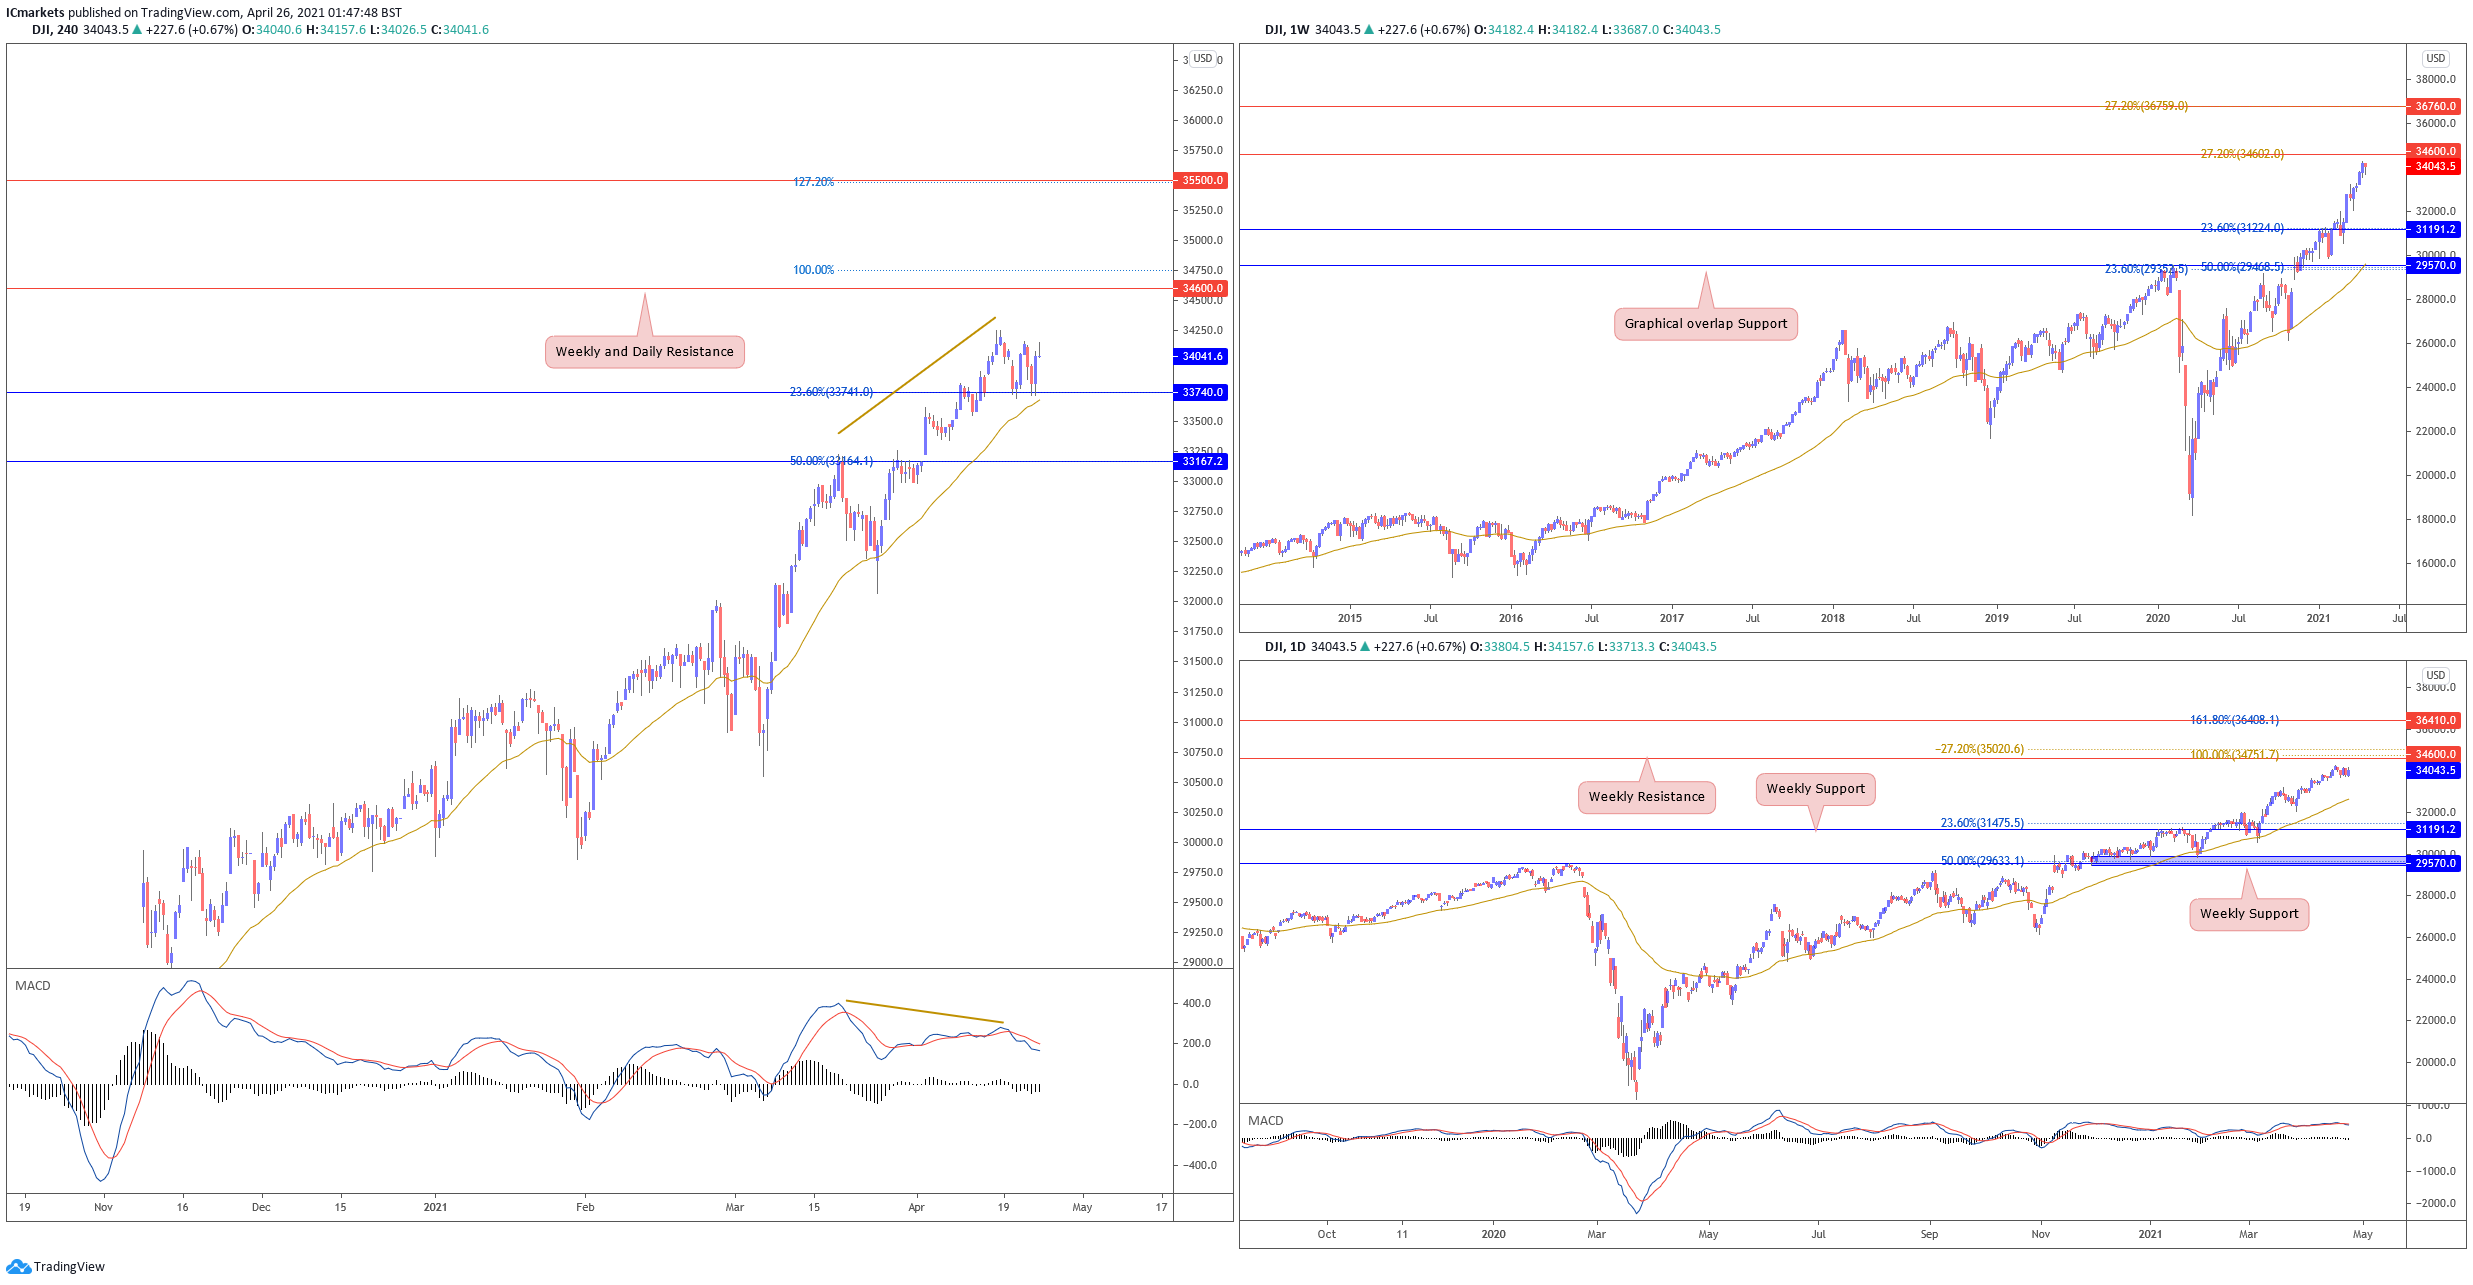
Dow Jones Industrial Average:
On the weekly chart, price is holding below key 34600 resistance. With price deviating so far from the moving average, we may expect to see some mean reversion in the Dow soon. Sellers may add to their shorts below 34600 resistance with a possible long term downside target at 31190 support. Otherwise a weekly break and close above 34600 resistance will see price swing higher. On the Daily, price is capped below 34600 weekly resistance as well facing bearish pressure. Traders should be cautious about any form of selling as technical indicators remain bullish.
On the H4, price tested and reacted above 33740 support. However, with price holding between support and 34600 weekly resistance, and technical indicators giving a mixed signal, we prefer to remain neutral for now. Divergence is still noted on the H4
Areas of consideration:
- Watch closely 34600 weekly resistance.
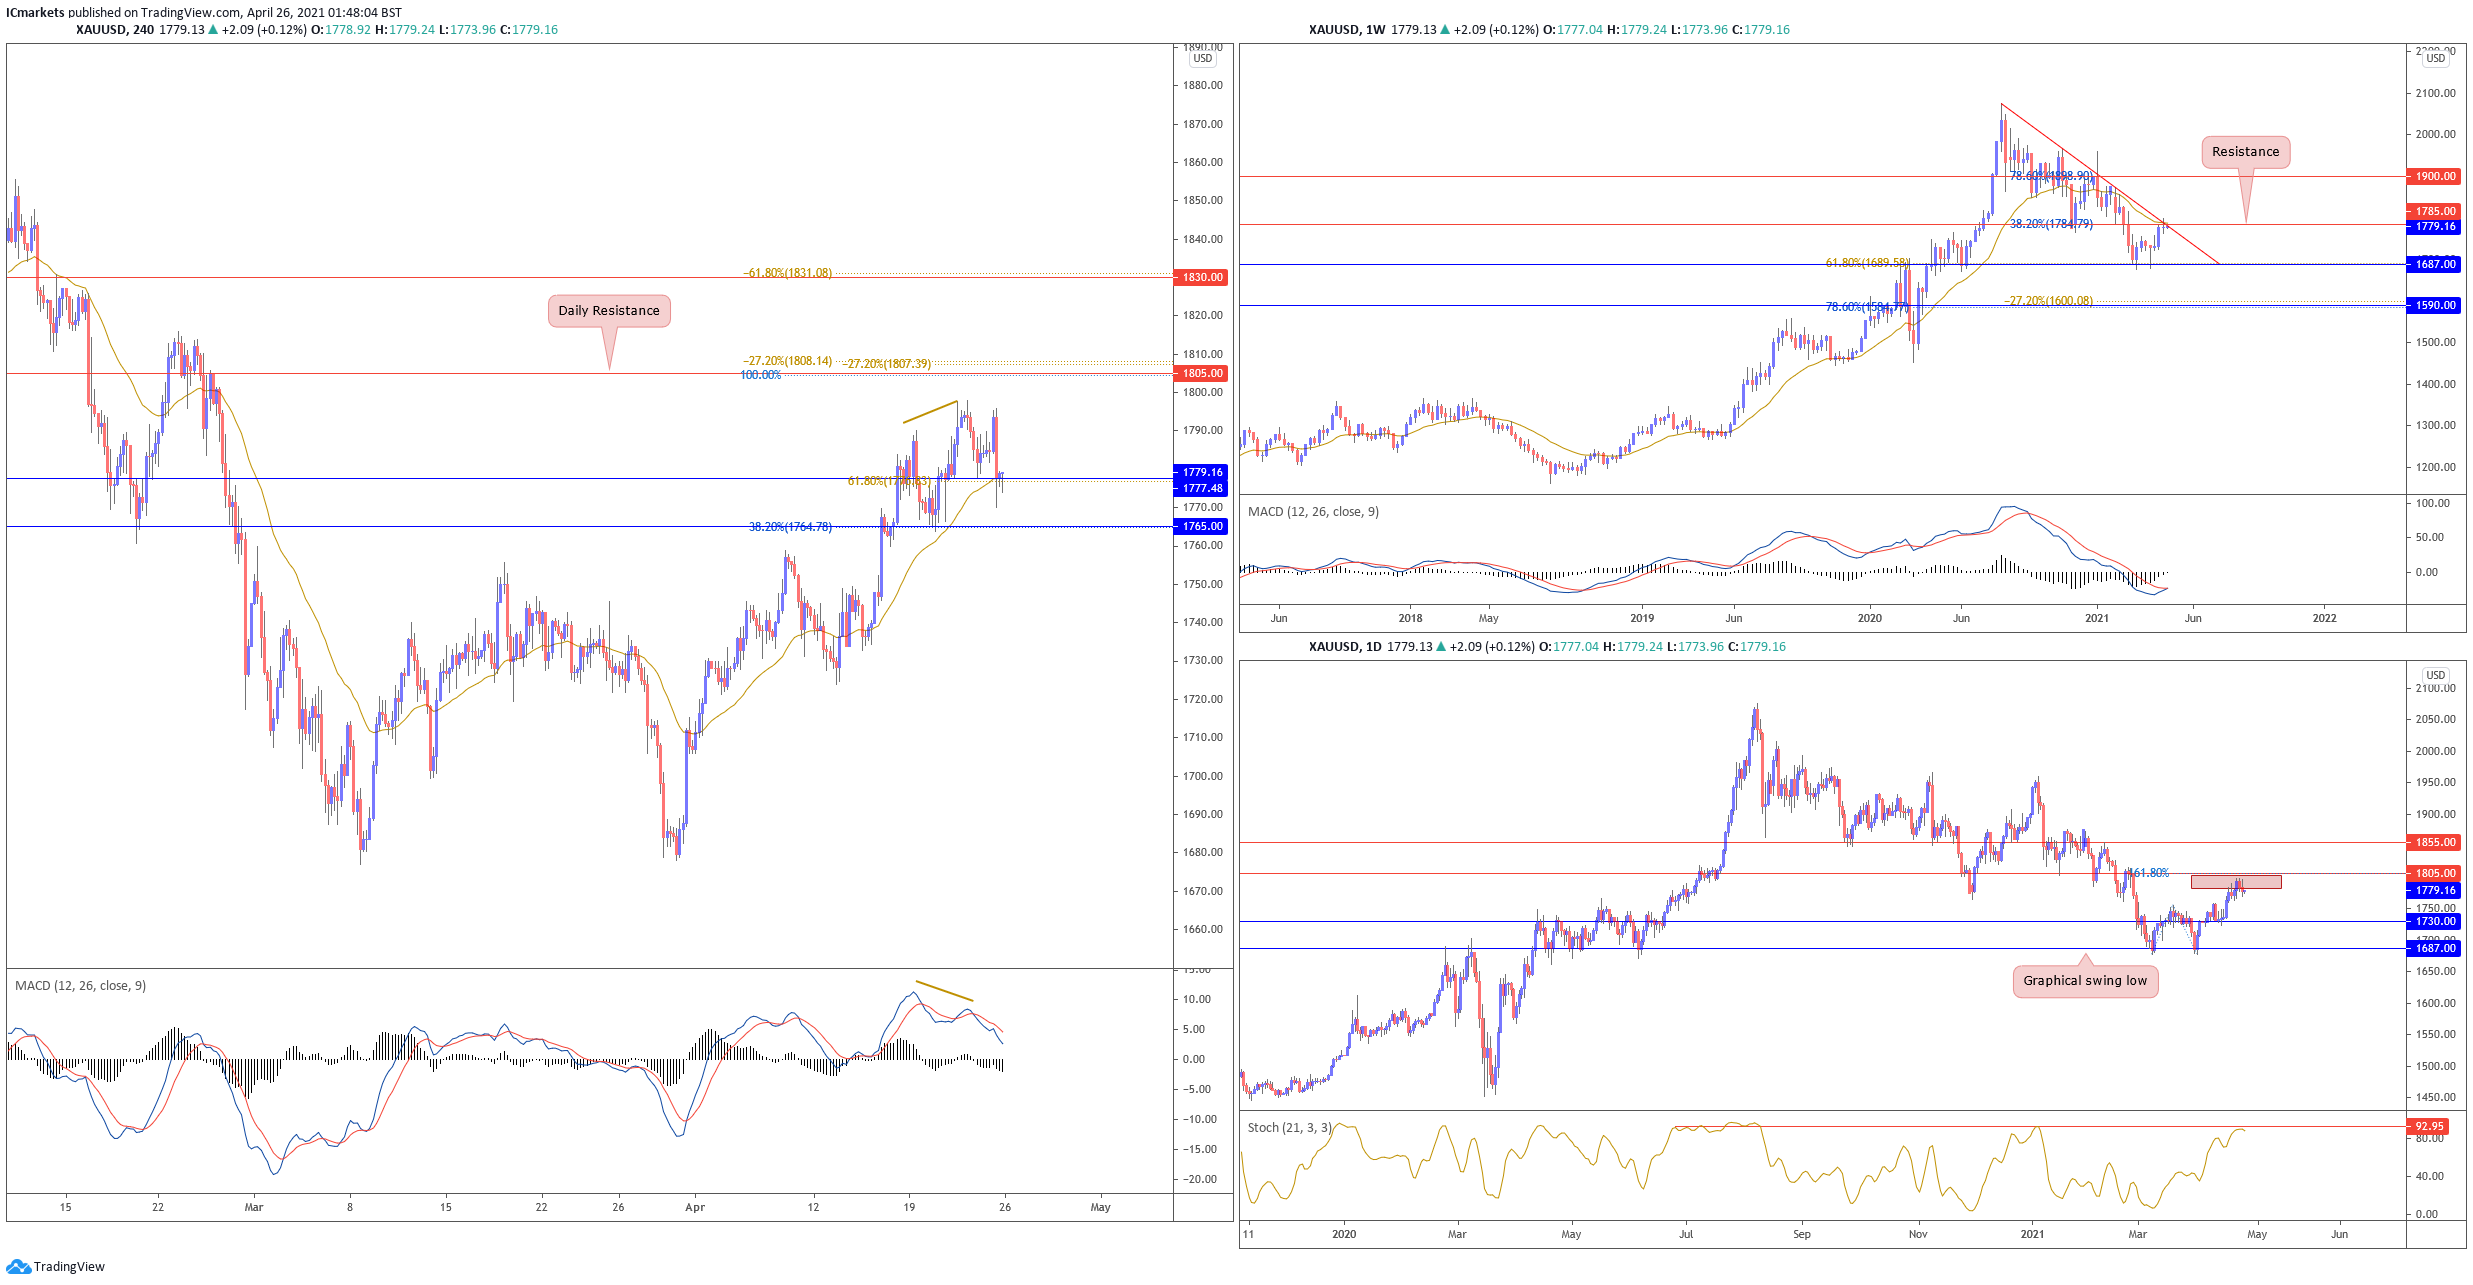
XAU/USD (GOLD):
On the weekly timeframe, gold is testing and holding below descending trendline resistance and long term moving average resistance at 1785. A weekly close below this resistance could see price pull back lower towards 1687 support. On the Daily timeframe, price is also testing the resistance zone at 1805. A short term drop towards support at 1730 could be likely. Otherwise, failure to hold below 1805 resistance could see price swing higher towards 1855 resistance next.
On the H4, pulled back lower and is currently testing support at 1777 level. With price holding above moving average and MACD showing room for further bullish momentum, we see a low conviction bullish scenario with price possibly pushing towards the 1805 level. However we would caution traders about the divergence that is forming on the H4 as well.
Areas of consideration:
- Bearish divergence forming on H4
- 1777 support is the intraday support level to watch
The accuracy, completeness and timeliness of the information contained on this site cannot be guaranteed. IC Markets does not warranty, guarantee or make any representations, or assume any liability regarding financial results based on the use of the information in the site.
News, views, opinions, recommendations and other information obtained from sources outside of www.icmarkets.com.au, used in this site are believed to be reliable, but we cannot guarantee their accuracy or completeness. All such information is subject to change at any time without notice. IC Markets assumes no responsibility for the content of any linked site.
The fact that such links may exist does not indicate approval or endorsement of any material contained on any linked site. IC Markets is not liable for any harm caused by the transmission, through accessing the services or information on this site, of a computer virus, or other computer code or programming device that might be used to access, delete, damage, disable, disrupt or otherwise impede in any manner, the operation of the site or of any user’s software, hardware, data or property.


