
DXY:
The chart for DXY (US Dollar Index) currently exhibits a bearish overall momentum. In this context, there’s a potential scenario where the price could encounter a bearish reaction upon reaching the 1st resistance level at 105.68, possibly leading to a decline towards the 1st support level at 104.34.
The 1st support level at 104.34 is identified as an overlap support level, suggesting that it may serve as a critical support zone where buyers could potentially step in to prevent further downward movement.
On the resistance side, the 1st resistance level at 105.68 is characterized as an overlap resistance level. Additionally, it coincides with the 127.20% Fibonacci Extension, making it a significant potential barrier for any bullish attempts.
Furthermore, the 2nd resistance level at 107.83 is marked as another overlap resistance level, further reinforcing its potential importance as a point of resistance.

EUR/USD:
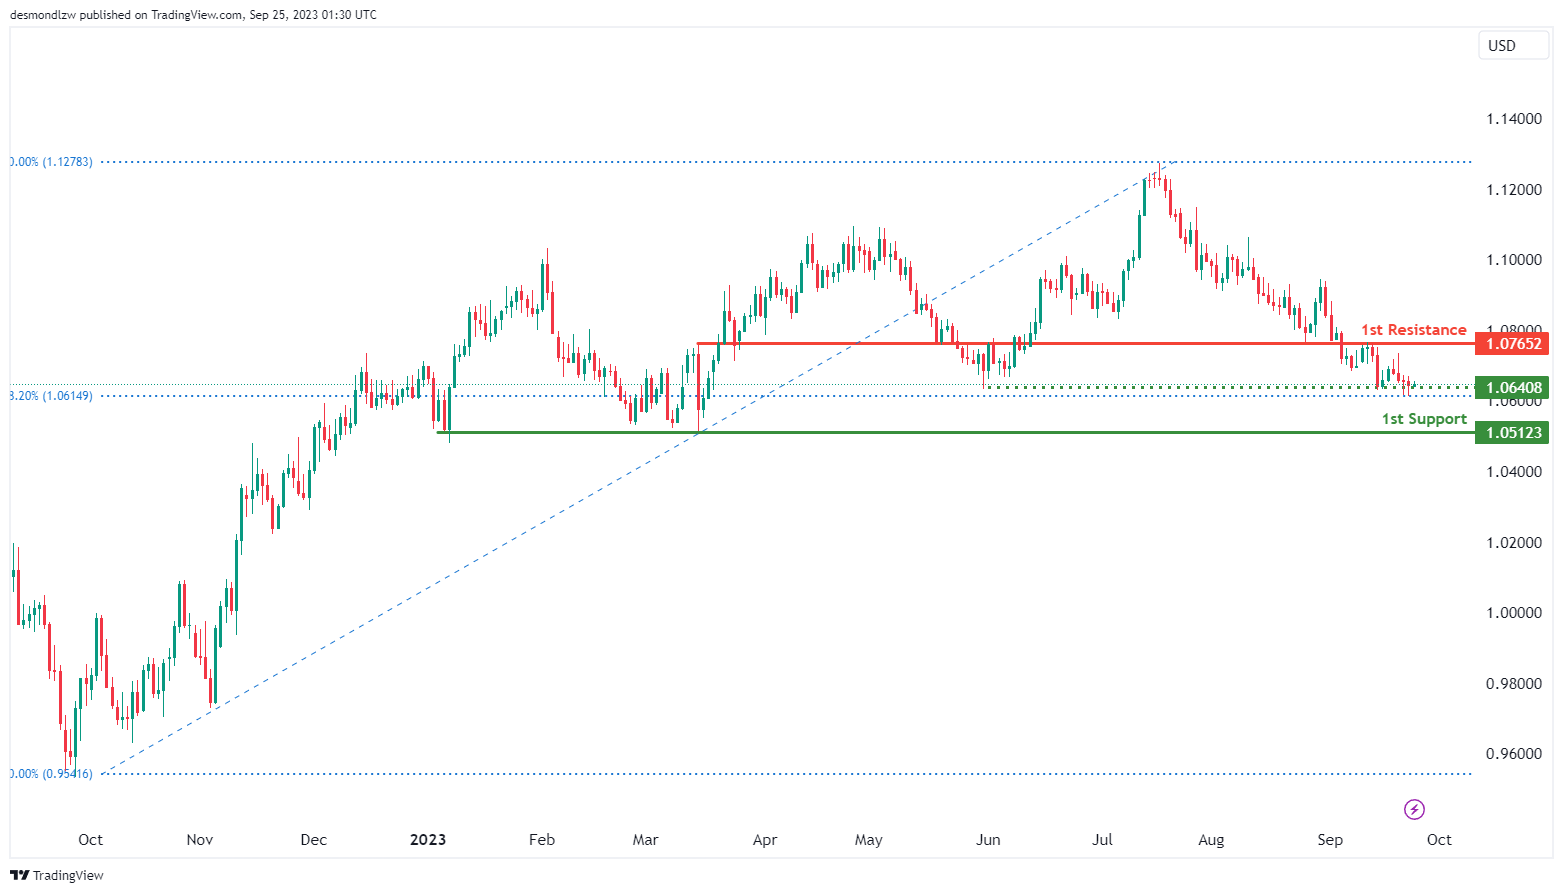
The EUR/USD chart is currently exhibiting a bullish overall momentum. In this context, there is a potential scenario where the price may experience a short-term drop towards the 1st support level at 1.0512 before potentially bouncing from this level and rising towards the 1st resistance at 1.0765.
The 1st support level at 1.0512 holds significance as it is identified as a multi-swing low support. This suggests that it could potentially act as a strong support zone where buying interest may emerge, preventing further downside movement.
Additionally, there is an intermediate support level at 1.0640, which is characterized by the 38.20% Fibonacci Retracement. While this level is not the primary support, it may come into play if the price retraces and provides an additional potential support zone.
On the resistance side, the 1st resistance level at 1.0765 is marked as an overlap resistance. This level could serve as a point of interest for potential bullish movements
.
EUR/JPY:
The instrument EUR/JPY currently shows a bearish overall momentum on the chart. There’s potential for a short-term rise towards the 1st resistance before reversing off it and dropping towards the 1st support.
The 1st support at 156.91 is considered good due to its nature as a multi-swing low support.
The 2nd support at 155.57 is also notable as it acts as a swing low support and is associated with the 50% Fibonacci Retracement, offering an additional layer of potential support.
On the resistance side, we have the 1st resistance at 158.45, which is significant because it represents a multi-swing high resistance and is linked to the 78.60% Fibonacci Projection.
Meanwhile, the 2nd resistance at 159.32 is noteworthy as it functions as a pullback resistance and is associated with the 127.20% Fibonacci Extension, suggesting a potential point where the price may reverse its short-term rise and start to drop.

EUR/GBP:
The instrument EUR/GBP currently indicates a bullish overall momentum on the chart, and there’s potential for a bullish continuation towards the 1st resistance.
The 1st support at 0.8666 is considered good due to its nature as a pullback support.
The 2nd support at 0.8613 is also notable as it acts as an overlap support.
On the resistance side, we have the 1st resistance at 0.8721, which is significant because it represents an overlap resistance and is associated with the 127.20% Fibonacci Extension.
The 2nd resistance at 0.8765 is also considered good as it functions as a pullback resistance.
Additionally, there’s an intermediate resistance at 0.8699, which is noteworthy because it acts as a swing high resistance, potentially contributing to the overall resistance levels as the price moves towards the 1st resistance.
.

GBP/USD:
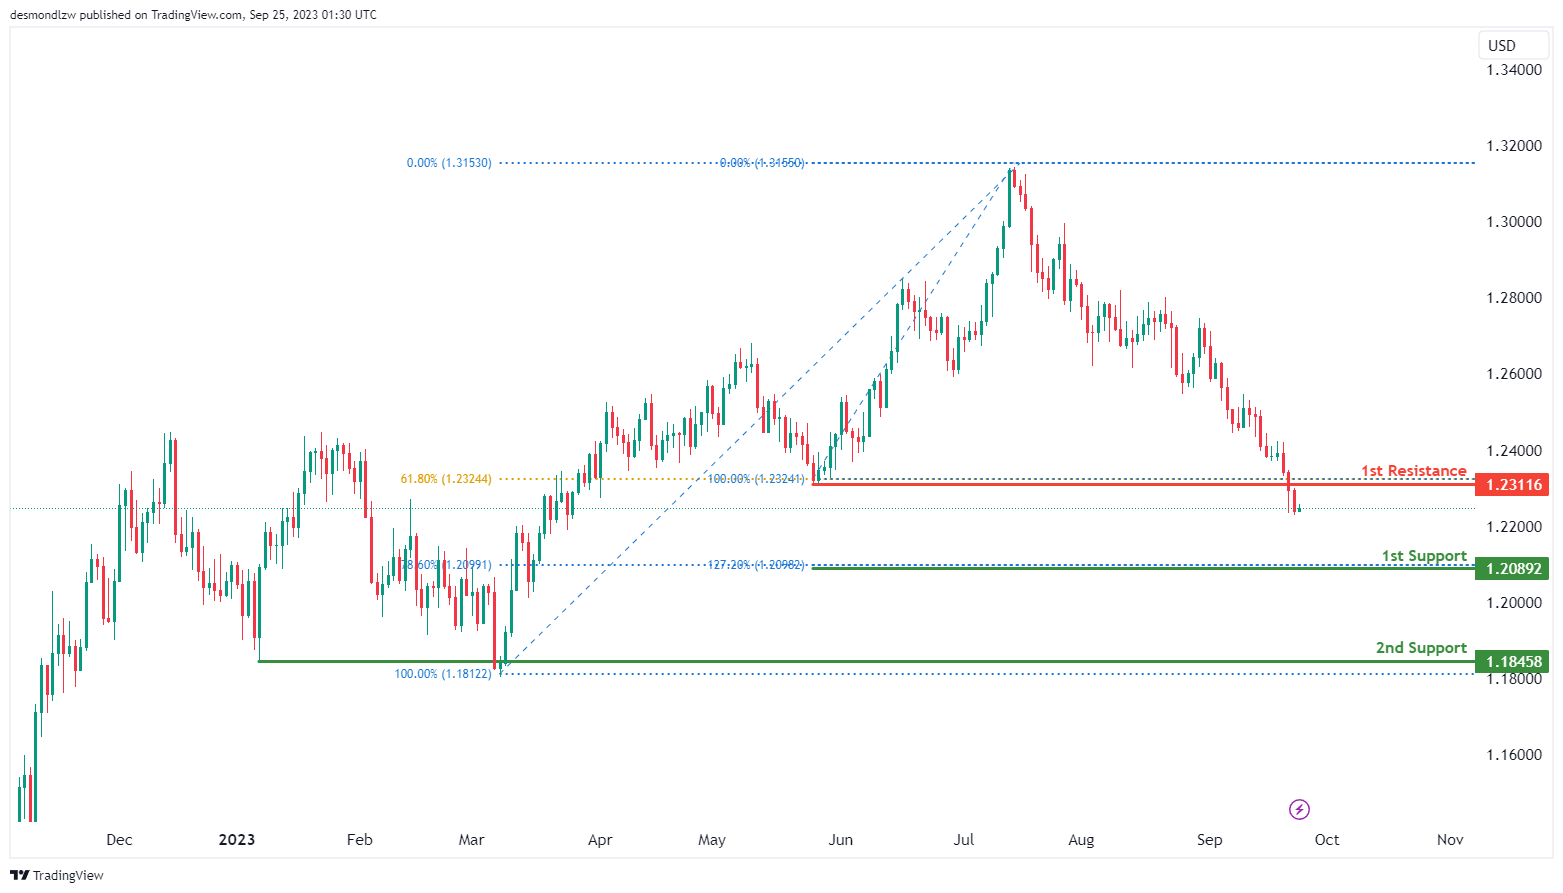
The GBP/USD chart currently reflects a bearish overall momentum. Given this scenario, there is potential for a bearish continuation with a focus on the 1st support level.
The 1st support level at 1.2089 holds particular significance. It is a critical support level due to the confluence of two technical factors: the 127.20% Fibonacci Extension and the 78.60% Fibonacci Retracement. This convergence suggests that 1.2089 could act as a strong support zone where price may find buying interest.
Additionally, the 2nd support level at 1.1845 is another notable area, characterized as a swing low. It signifies a historical level where price has found support in the past.
On the resistance side, the 1st resistance level at 1.2311 stands out as a significant barrier. This level is marked by pullback resistance, indicating a historical point where price retracements have encountered selling pressure. Furthermore, it coincides with the presence of the 61.80% Fibonacci Retracement, adding to its technical significance as a potential resistance zone.
GBP/JPY:
The instrument GBP/JPY currently indicates a bullish overall momentum on the chart, and there’s potential for a bullish continuation towards the 1st resistance.
The 1st support at 180.40 is considered good due to its nature as a swing low support and its association with the 61.80% Fibonacci Retracement.
The 2nd support at 178.32 is also notable as it acts as a swing low support and is associated with the 78.60% Fibonacci Retracement, offering an additional layer of potential support.
On the resistance side, we have the 1st resistance at 183.17, which is significant because it represents an overlap resistance and is linked to the 38.20% Fibonacci Retracement.
Similarly, the 2nd resistance at 186.44 is noteworthy as it functions as a swing high resistance, suggesting potential barriers to further bullish movement at these levels.

USD/CHF:
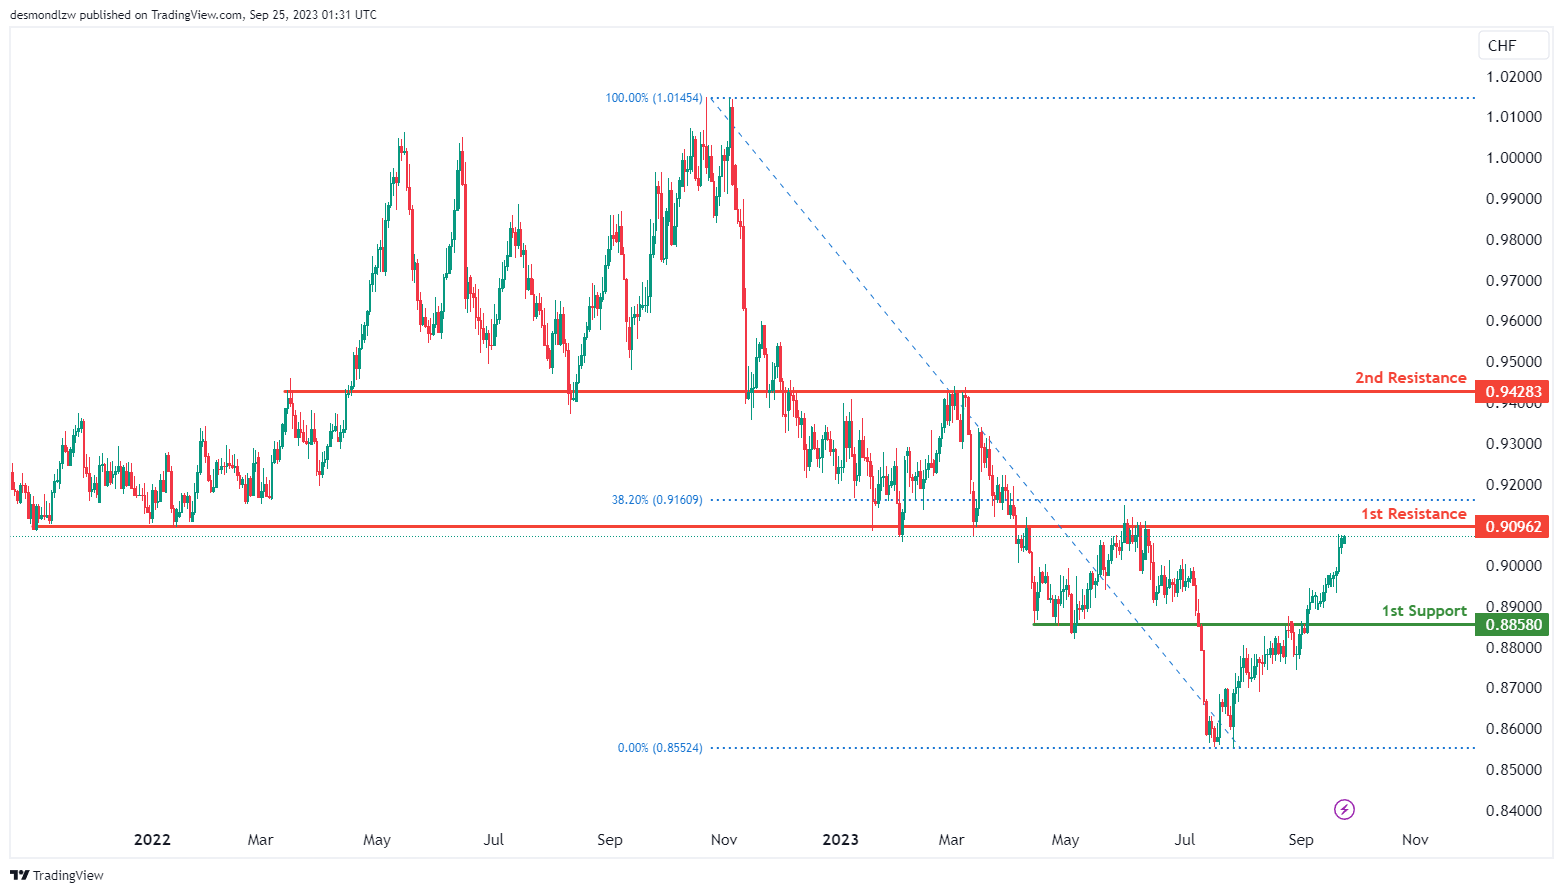
The USD/CHF chart presently indicates a bearish overall momentum. In this context, potential price developments may entail a bearish response upon approaching the 1st resistance level.
The 1st support level at 0.8858 is a crucial support level, characterized as a pullback support. This level could play a significant role in providing support to the price in the event of a bearish move.
On the resistance side, the 1st resistance level at 0.9096 stands out as a notable resistance point. It is marked by the presence of an overlap resistance, which often carries significance in technical analysis. Additionally, this level coincides with the 38.20% Fibonacci Retracement, adding to its potential importance as a barrier to further upward price movement.
Furthermore, the 2nd resistance level at 0.9424 is another noteworthy resistance level, characterized by an overlap resistance.
.
USD/JPY:
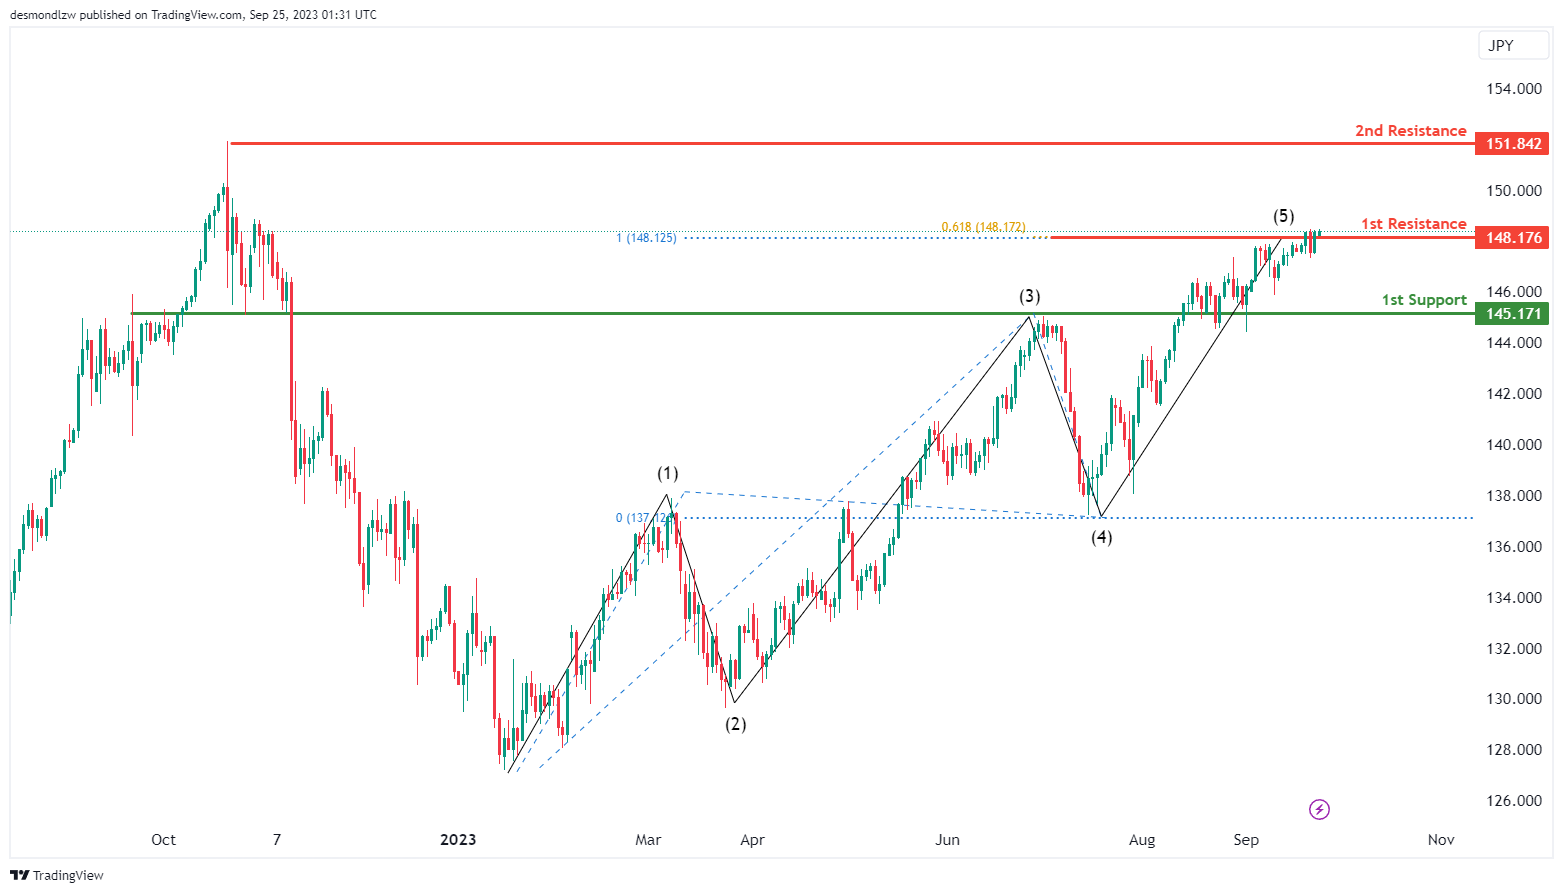
The USD/JPY chart currently reflects a bearish overall momentum. In this bearish scenario, the potential price action suggests a bearish reaction as it approaches the 1st resistance level.
The 1st support level at 145.17 holds significant importance, characterized as an overlap support. This level may play a crucial role in providing support to the price in case of a bearish move.
On the resistance side, the 1st resistance at 148.17 is a notable level to watch. It is marked by the presence of swing high resistance, and it also exhibits a confluence of technical factors, including the 100% Fibonacci Projection and the 61.80% Fibonacci Projection. This suggests that the 148.17 level may act as a strong barrier to further upward price movements.
Additionally, the 2nd resistance level at 151.84 represents another notable resistance point, characterized by swing high resistance.
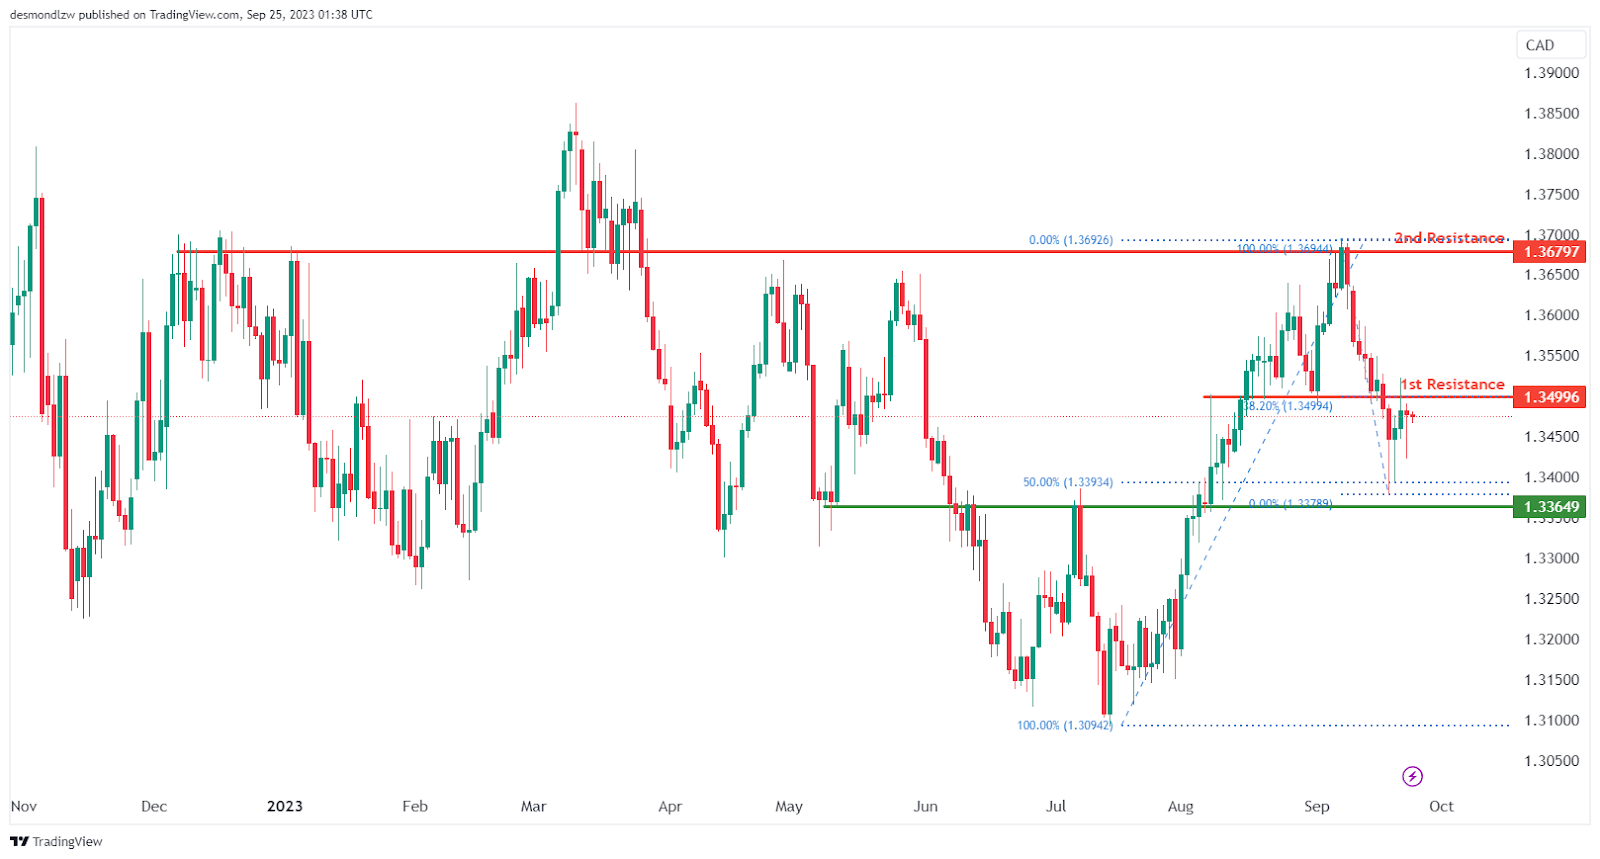
USD/CAD:
The chart for USD/CAD is currently indicating an overall bearish momentum. In this scenario, there is a potential setup for a bearish reaction off the 1st resistance level and drop towards the 1st support level.
The 1st resistance level at 1.3499 is identified as an overlap resistance that aligns with the 38.20% Fibonacci retracement level. Further up, the 2nd resistance level at 1.3679 is also marked as an overlap resistance level, further indicating its potential significance as a point of resistance.
To the downside, the 1st support level at 1.3365 is identified as an overlap support that coincides with the 50.00% Fibonacci Retracement level, offering a strong level of potential support.
AUD/USD:
The AUD/USD chart is currently displaying an overall neutral momentum, suggesting that price may range-bound or oscillate between the 1st support and the1st resistance levels.
The 1st support level at 0.6357 is identified as a pullback support while the 2nd support level at 0.6204 is noted as a swing-low support, suggesting a potential strong support level in the past.
To the upside, the 1st resistance level at 0.6494 is identified as an overlap resistance that aligns with the 23.60% Fibonacci retracement level. Further up, the 2nd resistance level at 0.6575 is also marked as an overlap resistance that coincides with the 38.20% Fibonacci retracement level.

NZD/USD
The NZD/USD chart is currently showing an overall neutral momentum, suggesting that the price may consolidate or move within the 1st support and the 1st resistance levels.
The 1st support level at 0.5861 is identified as a pullback support, where price found strong support in early September.
To the upside, the 1st resistance level at 0.5997 is identified as an overlap resistance that aligns with the 23.60% Fibonacci retracement level. Further up, the 2nd resistance level at 0.6084 is also marked as an overlap resistance that coincides with the 38.20% Fibonacci retracement level.

DJ30:
The instrument DJ30 currently exhibits a bearish overall momentum on the chart, and this bearish momentum has been triggered by the price breaking below an ascending support line. There’s potential for a bearish continuation towards the 1st support at 33612.93.
The 1st support at 33612.93 is considered strong due to its nature as an overlap support, and it’s associated with the 61.80% Fibonacci Retracement, indicating a robust level of potential support.
The 2nd support at 32731.51 is also notable as it acts as a multi-swing low support, offering an additional layer of potential support.
On the resistance side, we have the 1st resistance at 34420.14, which is significant because it represents a pullback resistance.
Similarly, the 2nd resistance at 35066.13 is also an overlap resistance, suggesting potential barriers to further bullish movement at these levels.

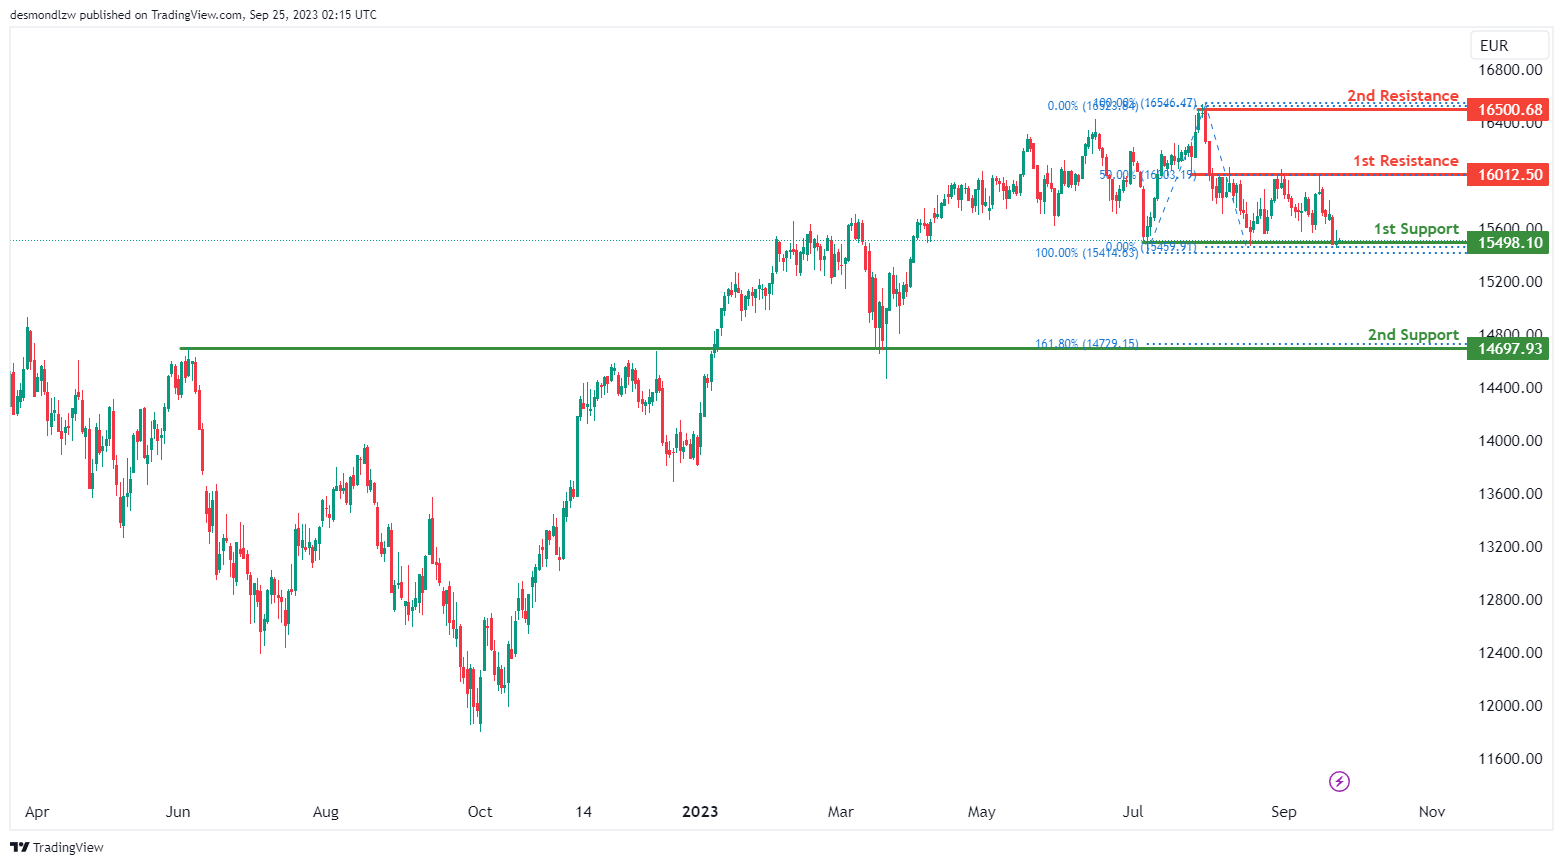
GER30:
The instrument GER30 currently suggests a bullish overall momentum on the chart. There’s potential for a bullish bounce off the 1st support at 15498.10 and a move towards the 1st resistance.
The 1st support at 15498.10 is considered strong due to its nature as a multi-swing low support.
The 2nd support at 14697.93 is also notable as it acts as an overlap support and is associated with the 161.80% Fibonacci Extension, providing another layer of potential support.
On the resistance side, we have the 1st resistance at 16012.50, which is significant because it represents an overlap resistance and is linked to the 50% Fibonacci Retracement.
Similarly, the 2nd resistance at 16500.68 is noteworthy as it functions as a swing high resistance, suggesting potential barriers to further bullish movement at these levels.
`US500
The instrument US500 currently indicates a bullish overall momentum on the chart, and this momentum is supported by the fact that the price is in a bullish ascending channel. There’s potential for a bullish bounce off the 1st support at 4325.3 and a move towards the 1st resistance.
The 1st support at 4325.3 is considered strong due to its nature as an overlap support and its association with the 38.20% Fibonacci Retracement.
The 2nd support at 4205.1 is also notable as it acts as a pullback support and is associated with the 50% Fibonacci Retracement, providing an additional layer of potential support.
On the resistance side, we have the 1st resistance at 4457.3, which is significant because it represents a pullback resistance, suggesting a potential barrier to further bullish movement at this level.

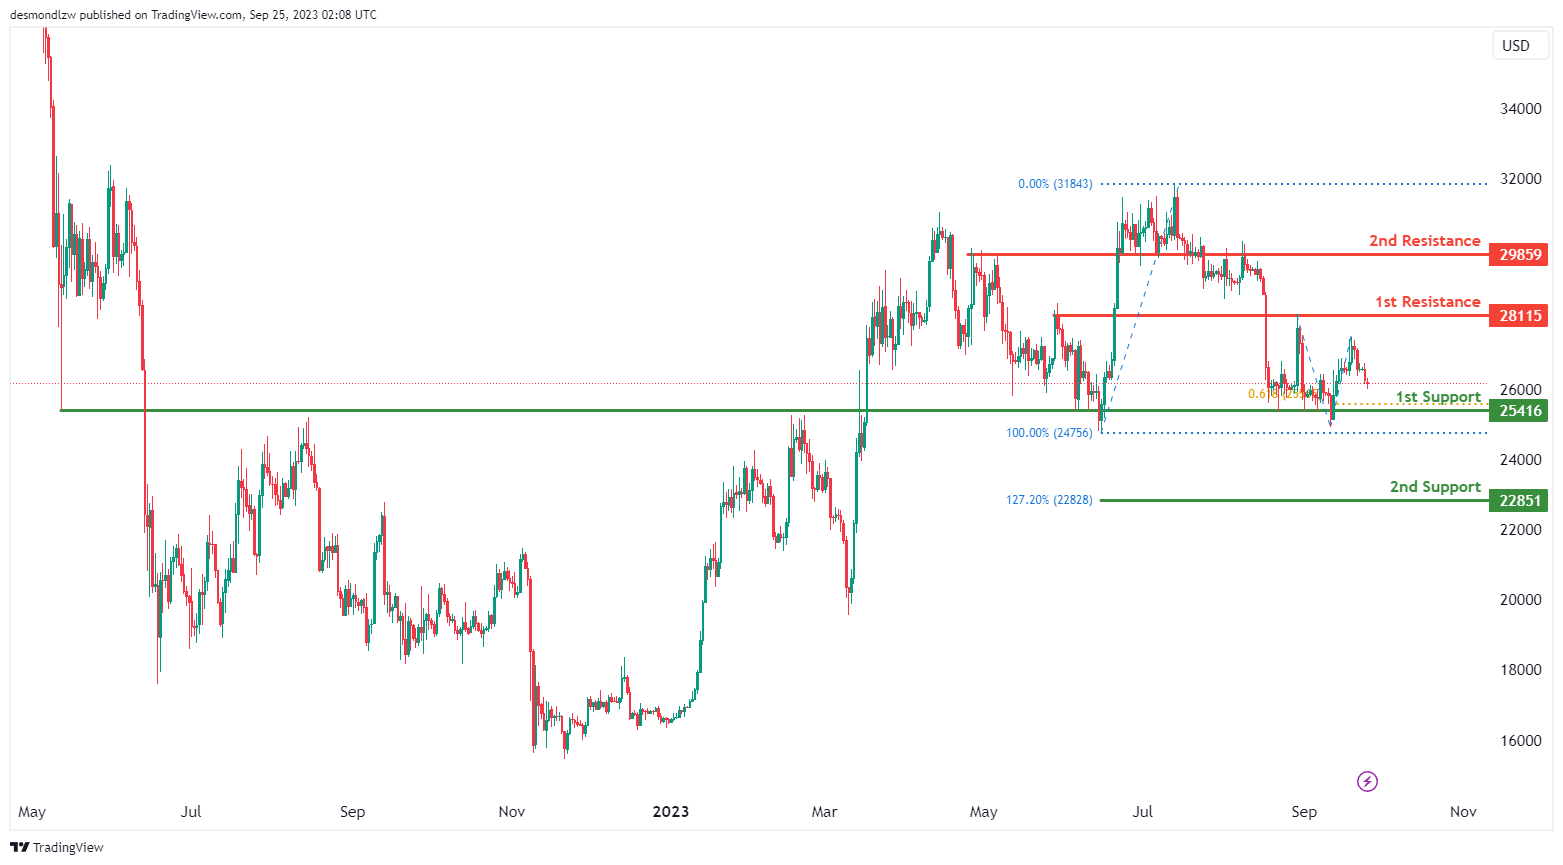
BTC/USD:
The instrument BTC/USD currently has a bearish overall momentum on the chart, and factors contributing to this bearish momentum include the potential for a bearish continuation towards the 1st support at 25416.
The 1st support at 25416 is considered strong due to its nature as an overlap support and its association with the 61.80% Fibonacci Projection, indicating a solid level of potential support.
The 2nd support at 22851 is also noteworthy as it is associated with the 127.20% Fibonacci Extension, providing another layer of potential support.
On the resistance side, we have the 1st resistance at 28115, which is significant because it represents an overlap resistance.
Similarly, the 2nd resistance at 29859 is also an overlap resistance, suggesting potential barriers to further bullish movement at these levels.
.
ETH/USD:
The instrument ETH/USD currently exhibits a bearish overall momentum on the chart, and there’s potential for a bearish continuation towards the 1st support at 1538.01.
The 1st support at 1538.01 is considered strong due to its nature as a multi-swing low support, and it’s associated with the 78.60% Fibonacci Retracement, indicating a robust level of potential support.
The 2nd support at 1370.57 is also notable as it acts as a swing low support, offering an additional layer of potential support.
On the resistance side, we have the 1st resistance at 1628.12, which is significant because it represents an overlap resistance.
Meanwhile, the 2nd resistance at 1817.39 is noteworthy as it functions as a pullback resistance and is associated with the 61.80% Fibonacci Retracement, suggesting potential barriers to further bullish movement at this level.

WTI/USD:
The WTI (West Texas Intermediate) chart currently exhibits a weak bearish momentum with low confidence with price potentially making a bearish reaction off the 1st resistance level.
The 1st resistance level at 92.28 is identified as an overlap resistance that aligns with the 78.60% Fibonacci projection level while the 2nd resistance level at 96.94 is marked as a pullback resistance; this level may act as a significant barrier to any potential upward movements.
To the downside, the 1st support level at 84.52 is identified as a pullback support that coincides with the 50.0% Fibonacci retracement level, a level where price could potentially find strong support.

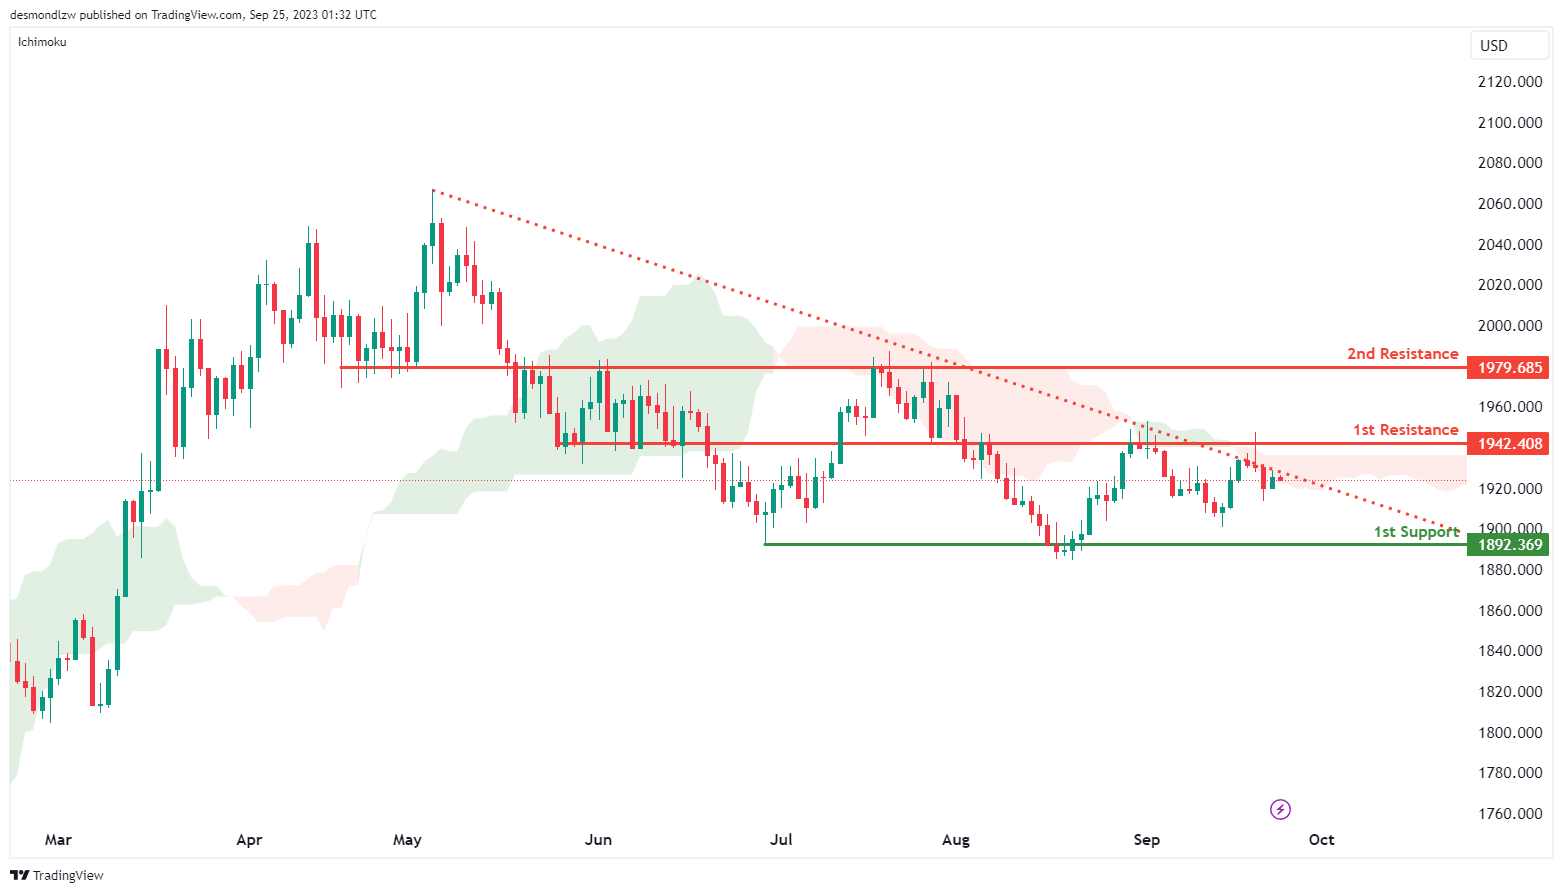
XAU/USD (GOLD):
The XAU/USD chart is currently showing a bearish overall momentum. This bearish sentiment is influenced by the fact that the price is below the bearish Ichimoku cloud and is also trading beneath a major descending trend line, indicating a prevailing bearish trend.
Looking ahead, there is a potential scenario where the price could experience a short-term rise towards the 1st resistance level before eventually reversing and moving towards the 1st support.
The 1st support level at 1892.36 is significant and can be described as an overlap support. It is an important level to watch for potential bullish reversals or increased buying interest.
On the resistance side, the 1st resistance at 1942.40 is noteworthy due to its characterization as an overlap resistance. This level may act as a barrier to further price increases.
Additionally, the 2nd resistance at 1979.68 is another notable resistance level, also marked as an overlap resistance.
The accuracy, completeness and timeliness of the information contained on this site cannot be guaranteed. IC Markets does not warranty, guarantee or make any representations, or assume any liability regarding financial results based on the use of the information in the site.
News, views, opinions, recommendations and other information obtained from sources outside of www.icmarkets.com, used in this site are believed to be reliable, but we cannot guarantee their accuracy or completeness. All such information is subject to change at any time without notice. IC Markets assumes no responsibility for the content of any linked site.
The fact that such links may exist does not indicate approval or endorsement of any material contained on any linked site. IC Markets is not liable for any harm caused by the transmission, through accessing the services or information on this site, of a computer virus, or other computer code or programming device that might be used to access, delete, damage, disable, disrupt or otherwise impede in any manner, the operation of the site or of any user’s software, hardware, data or property.


